Erik van Zwet, Sander Greenland, Guido Imbens, Simon Schwab, Steve Goodman, and I write:
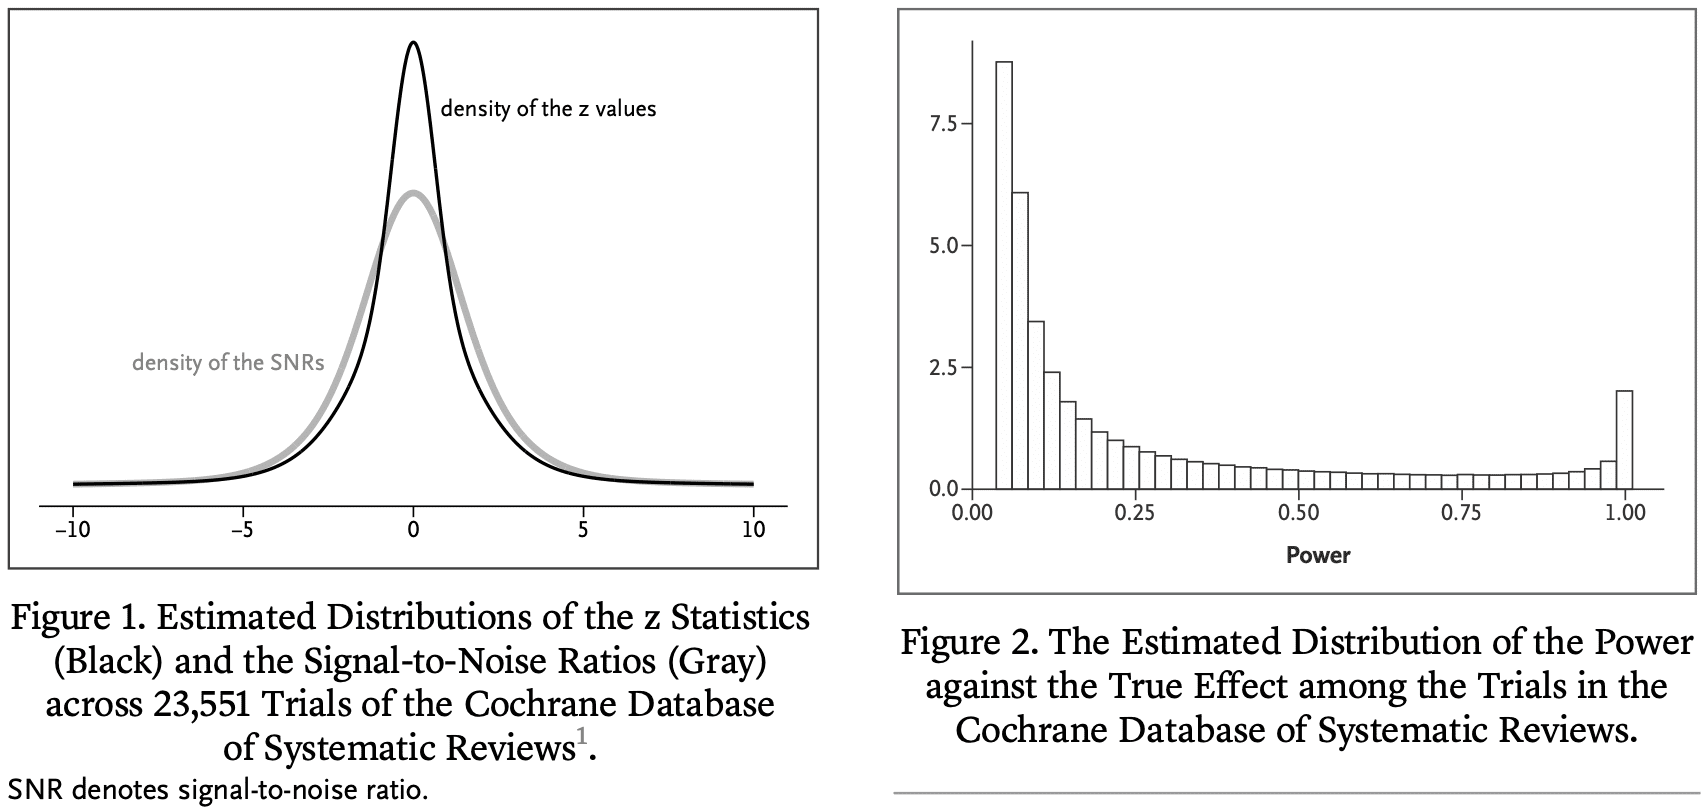
We have examined the primary efficacy results of 23,551 randomized clinical trials from the Cochrane Database of Systematic Reviews.
We estimate that the great majority of trials have much lower statistical power for actual effects than the 80 or 90% for the stated effect sizes. Consequently, “statistically significant” estimates tend to seriously overestimate actual treatment effects, “nonsignificant” results often correspond to important effects, and efforts to replicate often fail to achieve “significance” and may even appear to contradict initial results. To address these issues, we reinterpret the P value in terms of a reference population of studies that are, or could have been, in the Cochrane Database.
This leads to an empirical guide for the interpretation of an observed P value from a “typical” clinical trial in terms of the degree of overestimation of the reported effect, the probability of the effect’s sign being wrong, and the predictive power of the trial.
Such an interpretation provides additional insight about the effect under study and can guard medical researchers against naive interpretations of the P value and overoptimistic effect sizes. Because many research fields suffer from low power, our results are also relevant outside the medical domain.
Also this new paper from Zwet with Lu Tian and Rob Tibshirani:
Evaluating a shrinkage estimator for the treatment effect in clinical trials
The main objective of most clinical trials is to estimate the effect of some treatment compared to a control condition. We define the signal-to-noise ratio (SNR) as the ratio of the true treatment effect to the SE of its estimate. In a previous publication in this journal, we estimated the distribution of the SNR among the clinical trials in the Cochrane Database of Systematic Reviews (CDSR). We found that the SNR is often low, which implies that the power against the true effect is also low in many trials. Here we use the fact that the CDSR is a collection of meta-analyses to quantitatively assess the consequences. Among trials that have reached statistical significance we find considerable overoptimism of the usual unbiased estimator and under-coverage of the associated confidence interval. Previously, we have proposed a novel shrinkage estimator to address this “winner’s curse.” We compare the performance of our shrinkage estimator to the usual unbiased estimator in terms of the root mean squared error, the coverage and the bias of the magnitude. We find superior performance of the shrinkage estimator both conditionally and unconditionally on statistical significance.
Let me just repeat that last sentence:
We find superior performance of the shrinkage estimator both conditionally and unconditionally on statistical significance.
From a Bayesian standpoint, this is no surprise. Bayes is optimal if you average over the prior distribution and can be reasonable if averaging over something close to the prior. Especially reasonable in comparison to naive unregularized estimates (as here).
Erik summarizes:
We’ve determined how much we gain (on average over the Cochrane Database) by using our shrinkage estimator. It turns out to be about a factor 2 more efficient (in terms of the MSE) than the unbiased estimator. That’s roughly like doubling the sample size! We’re using similar methods as our forthcoming paper about meta-analysis with a single trial.
People sometimes ask me how I’ve changed as a statistician over the years. One answer I’ve given is that I’ve gradually become more Bayesian. I started out as a skeptic, concerned about Bayesian methods at all; then in grad school I started using Bayesian statistics in applications and realizing it could solve some problems for me; when writing BDA and ARM, still having the Bayesian cringe and using flat priors as much as possible, or not talking about priors at all; then with Aleks, Sophia, and others moving toward weakly informative priors; eventually under the influence of Erik and others trying to use direct prior information. At this point I’ve pretty much gone full Lindley.
Just as a comparison to where my colleagues and I are now, check out my response in 2008 to a question from Sanjay Kaul about how to specify a prior distribution for a clinical trial. I wrote:
I suppose the best prior distribution would be based on a multilevel model (whether implicit or explicit) based on other, similar experiments. A noninformative prior could be ok but I prefer something weakly informative to avoid your inferences being unduly affected by extremely unrealistic possibilities in the tail of the distribuiton.
Nothing wrong with this advice, exactly, but I was still leaning in the direction of noninformativeness in a way that I would not anymore. Sander Greenland replied at the time with a recommendation to use direct prior information. (And, just for fun, here’s a discussion from 2014 on a topic where Sander and I disagree.)
Erik concludes:
I really think it’s kind of irresponsible now not to use the information from all those thousands of medical trials that came before. Is that very radical?
That last question reminds me of our paper from 2008, Bayes: Radical, Liberal, or Conservative?
P.S. Also this:

You can click through to see the whole story.
P.P.S. More here on the “from defense to offense” thing.
Andrew:
If you’ve gone “full Lindley”, you’ve become a subjective Bayesian, adopting the very philosophy you used to strenuously reject. Error statisticians use background knowledge but without become subjectivists, or denying the importance of error probabilities. A link to Lindley’s statistical philosophy on my blog is here: https://errorstatistics.com/2012/07/12/dennis-lindleys-philosophy-of-statistics/
Deborah:
Yeah, I was exaggerating with the “full Lindley” bit.
Andrew:
You may have been exaggerating, but many of your followers and admirers take you entirely seriously, and then they adopt your position.
Deborah:
I had one word of exaggeration in that entire post. I would be completely happy if my readers were to follow the recommendations of the linked article, and I think it’s also helpful for my readers to see how my views have changed. For one thing, once people see that my views have changed, it should be clear to them that there’s no reason to think that my current views are infallible or anything close to that.
Andrew:
Wat, what? The fact that readers will know that there’s something somewhere that Andrew might change his mind about scarcely provides grounds for their dismissing your announcement that you’ve gone “full Lindley”. I’m sure you don’t think that someone who admits their views have shifted is free to claim “I now hold C” without people thinking they are really describing what they now hold.
Deborah:
This is getting kind of ridiculous. For one thing, it’s a blog post. For another, there’s only a single word of exaggeration in the post. The fully accurate position is that my position is closer to Lindley’s than before. For another thing, there is no such thing as “going full Lindley”; it’s not like this is some sort of precise concept. Finally, and most importantly, the post is about two papers by Zwet et al., and I like those papers.
I absolutely refuse to take the blame for the behavior of some hypothetical reader whom you cannot identify who, after reading thousands of blog posts, happens to come across the phrase “full Lindley,” which causes such hypothetical and nonexistent reader to jump to a philosophy of subjective Bayesianism which I’ve written many thousands of words criticizing.
I think this is a useful tool, but I’m not yet sure when it should be used. I’ve used shrinkage estimators in industry. To keep it hypothetical, let’s say my job was to predict sales for a portfolio of products. In that situation, we do care about minimizing the overall prediction loss. I’m imagining someone who works at the FDA looking at the landscape of all drug trials and saying “well, we know how the distribution of SNRs looks like, so I will use that to rationally adjust my assessment of this new trial”.
I’m also thinking of this quote from van Zwet, Tian and Tibshirani:
“The hazard ratio was estimated at 0.75 with 95% confidence interval of (0.55, 1.02). However, it has been established that many trials have a low signal-to-noise ratio, which can lead to upward bias in the estimate of the hazard ratio. If we apply this general information to our particular trial, the hazard ratio estimate becomes 0.84 with interval (0.62, 1.07).”
I don’t think this kind of statement is very compatible with a falsificationist approach to science. If my theory predicts effect size eta*, and my competitors have estimated effect sizes {eta1, eta2, …, eta5}, I want to design an experiment that has a high chance of being close to eta* and far away from {eta1,…,eta5}, if that’s the truth. But if I take a shrinkage approach, I am in effect hamstrung by the prevailing theory! I am forced to shrink my estimates closer to theirs. One could object: “why should your one study matter much in comparison to the five?” My answer to that is my study is qualitatively better than theirs – we make weaker assumptions, or we have better measurements.
I think that in this context, shrinkage penalizes outsider viewpoints too harshly, in the same way that allowing researcher degrees of freedom can give outsiders too much freedom. From a metascience point of view, I think it would be better to allow outsiders to use unbiased estimators, provided that they come by them honestly.
ou wrote:
“I want to design an experiment that has a high chance of being close to eta* and far away from {eta1,…,eta5}, if that’s the truth.”
You’d need to add “but not otherwise” in order to regard accordance with your theory as having passed a severe test.
I agree with your general sentimate. Falsificationism has been all but abandoned in today’s popular drive for “comparativism”.
you’re right – that’s important to remember.
I’ve had somewhat different experiences. The concept of “falsifying a hypothesis” is still out there in the popular consciousness, even if it’s not often clear what is meant by that. I think the word “falsify” does something to meet the need for a “criterion of scientific honesty”, as Lakatos put it.
I’m trying to think of how I would talk to a client about this. The methods in this blog post can make a difference in the right situation and are straightforward to implement. I think the question would be: “what population of effect sizes in the literature do you want to use as a prior?”. That’s the kind of decision that I would have to insist that they preregister – no takebacks here!
To be clear, I think abandoning falsificationism is a disaster, for the same reasons as is abandoning statistical significance. Tests always have thresholds.
Deborah: When you talk about “chance” or “error probability” you are referring to a relative frequency, right? But relative to what? One answer is: it’s the sampling frequency among future, identical repeats of the study under consideration. Another answer is: it’s the sampling frequency among the population of RCTs in the Cochrane database, and RCTs that are exchangeable with those. Both are perfectly frequentist (remember that Bayesians are frequentists too), so why would the first answer be always better? I think the second is more relevant when we’re interpreting an RCT!
The FDA approves a nearly constant number of new drugs per year. If they deviate far from the previous years, then congress starts asking questions.
That matters much more than SNR or anything else.
Henry: The situation where you’re comparing one study versus 5 others is different from what we’re considering in those two papers. So I can imagine you’d want to focus on a different loss function. In terms of modelling, I would think you’d have to take the heterogeneity between the studies into account.
You mention that your study is better than the others. That may be, and you could bring in that bit of prior information if you want. But maybe I’m not so convinced, and prefer to treat your study like any other. I think that’s often a reasonable starting point.
Erik:
I would have wanted to reply directly to your question to me about frequencies, but I do not see a “reply” there. I don’t know what remark of mine you are referring to in your question. However, I would not agree that so long as one is dealing with a frequentist probability of some sort, it’s fine. See, for one example, my discussion of J. Berger’s “Bayesian error probabilities” in Mayo 2018 section 3.6, and my criticisms of computing positive predictive values in a “screening model” of statistical significance tests (section 5.6). As for your claim “remember that Bayesians are frequentists too,” I do not find this to be the case, even though many turn to frequencies in arriving at degrees of belief. But what matters (to me) is not being a type of frequentist, but being an error statistician.
Deborah: I’m not claiming that any frequentist probabilities are fine, but I do think the frequentist probabilites in our NEJM Evidence paper are fine, even important (see Tables 2 and 3). They are not frequencies under sampling from the null hypothesis, or sampling from hypothetical repeats of the same trial. Instead, they are frequencies under sampling from the trials in the Cochrane database (and trials that are exchangeable with those.) Are those not valid frequencies for an error statistician?
“Bayesians are frequentists” is the title from one of Andrew’s posts. I should have provided a link: https://statmodeling.stat.columbia.edu/2018/06/17/bayesians-are-frequentists/
Is there a non-paywalled version?
https://evidence.nejm.org/stoken/default+domain/KXCEVZP8G9ITKFMSSDMZ/full?redirectUri=/doi/full/10.1056/EVIDoa2300003
Here’s the non-paywalled preprint!
Andrew:
Some very quick reactions:
This is the first I’ve heard of this paper, but it connects to something I discuss in my book and blog (errorstatistics.com). Firstly, the 80% or 90% power, as I understand it, is intended to apply to an effect “one would not like to miss” (paraphrasing Senn), not the actual effect or actual discrepancy from a null value. Supposing the tester takes it as an effect assumed correct leads to fallacious interpretations. Second, it’s worth noting that the term “‘statistically significant’ estimates” is not part of statistical significance tests. The authors are describing using an observed, just statistically significant difference d, as an estimate of the parameter under test. A proper estimate would not be d, but rather the lower (or upper) confidence bound (at the corresponding confidence level). Fields that “suffer from low power”, as described here, are fields where the true discrepancy from the null (i.e., true parametric effect size) is known, at least approximately, to be smaller than d. (In a one-sided positive test of the mean, the power against the null is alpha, and the power against d is .5) So using d as an estimate would be to give an overestimate. One should not give an estimate without a standard error. If even the lower CI bound is larger than the known effect size, there’s a suspicion that the observed effect has been selected for its apparent statistical significance. This renders the P-value completely invalid.
I would like to respond, but I just can’t imagine why you would claim that in medicine the true effect of a treatment is known to be smaller than than the unbiased estimate from an RCT. In any case, your recommendation to estimate the treatment effect by the lower or upper confidence bound (whichever is closer to zero) is a *very* extreme form of shrinkage.
Not sure if you know some related work by Martijn Schuemie David Madigan and colleagues, where likewise a data-driven reference distribution is used, but there to correct for confounding in observational studies:
https://doi.org/10.1002/sim.5925
https://doi.org/10.1073/pnas.1708282114
Would be interested in any thoughts on that use (which actually seems like a more challenging, demanding use).
Dean: It’s related, but still quite different. I discussed with Martijn a while ago, and even got their data (it’s still on my to-do list to look at it). If I recall correctly, they have some actual null effects where they know for certain that a some treatment cannot have an effect. That’s different from the Cochrane where it’s quite unlikely that a treatment has no effect at all (in either direction).
There must be a misunderstanding involved somewhere. What possible treatment is known for certain to have no effect? Most likely they “know” this due to previous non-significant results. Even stuff like praying or sugar pills will do *something*.
And nearly all treatments that get approved have NNTs in the 10s to 100s. So (even ignoring systematic error) the ones deemed to “work” only benefit a small percent of patients to begin with. The line between blockbuster drug and “no effect” is very thin.
Nothing is certain, and I don’t know enough about these studiess to have an opinion. But I can see what Schuemie et al. call “negative controls” having at most very small effects. From their PNAs paper: “One of the negative controls for the dabigatran studies is ingrowing nail.” I guess so.
Thanks for the detail, I found it in the paper linked by Dean Eckles:
Personally my tooth enamel seems to have been messed up from taking antibiotics when I was younger. It was firmly believed cavities had nothing to do with antibiotics at the time, now many researchers believe it can. Maybe if you also drink lots of fluoridated water while your adult teeth are coming in, etc. Who knows? Point is no one knows all the things these drugs are doing.
I mean one of the supposed triggering factors for an ingrown nail is trauma (dropping something on your toe, etc). The use-case for dabigatran/warfarin is to interfere with blood clotting: one of the body’s first responses to trauma.
It is just bizarre to make such a confident claim.
I started grad school in biostatistics in 1990 and the same frequentist/bayesian or bayesian/frequentist (don’t want to put one in front of the other) arguments were going on.
Little progress in the last 30 years.
Bell’s theorem resolved the decades long argument between Einstein and Bohr about the quantum. Can we get a ‘Bell’ for statistics so we can end this never ending argument based on ‘feelings’ and achieve truth?
Until then use whichever method works for the data analysis problem in front of you.
Bill:
The above-linked paper is not about “feelings”; we’re using empirical data to make quantitative statements about statistical summaries. People can use whatever methods they want to use, and we as statisticians can use statistical analysis to better understand published results. That’s what we’re doing here.
>Bell’s theorem resolved the decades long argument between Einstein and Bohr about the quantum.
It did nothing of the kind. What Bell’s theorem showed was that there couldn’t be *local* hidden variables. Bells solution to that was to interpret the EPRB thought experiment to mean that QM was inherently nonlocal and that Bohms pilot wave theory made the most sense, and that particles are real and have positions. Most physicists sided with Bohr and had nothing to say about the reality or instead decided that what makes sense is that particles aren’t real until “wave function collapse” which has no real description in the theory. A few weirdos think there are infinite numbers of alternative worlds…
Jean Bricmont has a great description of the state of things in his book Quantum Sense and Nonsense
“Is that very radical?”
The obvious reason people want to use reems of shitty past data is that it’s way easier than getting new high quality data that can actually address the issue. EZPubs!! The data is bad but self interest is the overwhelming driving factor!! No research money?? Just dig up some bad data!! Geom your jitter! Get some EZ Pubs!
As performed by Klaus Meine:
Tenure comin up? Don’t hire a sub! You can crank out some EZ Pubs!
Bad data!! Yeah we’re using bad data!! Woo hoo hoo.. Bad data!! Getin’ EZ Pubs tonight!! Whoo!!!
Gotta pad that CV? Don’t need to look far!! Just download some bad data and load it up into R!!
Bad data!! Yeah we’re using bad data!! Woo hoo hoo.. Bad data!! Getin’ EZ Pubs tonight!! Whoo!!!
Need a press coup before your tenure review? Just gin up some data iwth P<0.02!!
Bad data!! Yeah we're using bad data!! Woo hoo hoo.. Bad data!! Getin' EZ Pubs tonight!! Whoo!!!
We're gonna get some EZ pubs tonight!
We're gonna get some EZ pubs tonight!
Everything will be alright
We're gonna get some EZ pubs tonight!
I think the problem in this discussion is the idea that there is one and only one “correct” solution to an inference problem. The blog post proposes an approach to set the prior, and obviously then all results are relative to that. From the point if view of somebody who knows the results in the Cochran database and nothing else about a particular new study, this makes a lot of sense – *relative* to that knowledge base. It doesn’t involve any specific information that may be available about the new study, so in all likelihood it doesn’t involve all information available, and of course it can be criticised for that reason. Now different people may find different bits of information reliable, or may disagree to what extent these are informative for the new study at all. The latter issue also applies to the Cochran approach with the argument seen earlier that “the new study is different and better in this-or.that respect, so its estimates shouldn’t be shrunk toward the Cochran distribution”. That makes sense if you are the study designer. At the same time somebody could say that “every study designer would make such a case, also those already in the distribution, so we should ignore this assessing the results”. Who is right? Without into going the details of the situation we can’t tell. Chances are even if we go into the details and different people interpret available evidence differently, we won’t be able to tell either. These probabilities are relative not only to a supposedly objective state of knowledge but also to what people make of it. Which is the basic reason why much Bayesian foundation is subjectivist.
The frequentist can be smug and say, “we don’t even need to get into that discussion”, but of course problems don’t end there and the same applies to decisions the frequentist needs to make, particularly model assumptions. The Bayesdians have the prior to worry about. on top of that, which is both blessing (great tool for incorporating existing information) and curse (no agreement can be expected about how exactly to do that). I’d just say a frequentist test and confidence interval is yet another way of looking at the data that has limitations and merits. I can look at different things and make my mind up taking into account all of them. But of course in a decision making context this will not give a unique answer, and more problems come from the lack of “algorithmic” reproducibility. Sigh! In any case the fact that having a unique “best” solution would be useful and nice doesn’t constitute evidence for such a thing existing.
Christian:
I agree. Inferences are conditional on assumptions. In usual statistical practice, p-values are interpreted conditional on the null hypothesis and under a poorly-justified alternative hypothesis. In our paper we’re proposing a third interpretation, which is to average over a distribution of effect sizes estimated from the Cochrane database. Other alternatives are possible, and in any case I do not think it is generally appropriate to pipe a p-value, no matter how calculated, into a decision analysis.
Our paper provides a way of interpreting or understanding p-values from medical trials. It does not provide or propose any rules for making decisions.
I think you mean a distribution of signal/noise ratios (SNRs), not effect sizes. That makes a difference. Studies with larger N are expected to have a higher SNR with more precise estimates of smaller effect sizes. Shouldn’t we expect those studies to be more replicable than small N studies, which you correctly criticize all the time. Why not use that information to form Bayesian priors?
So basically what you’re saying is that if a series of trials has a hidden experiment error, we should start insert a statistical mechanical that boosts that error for all future trials. Great science. If this is going on in drug trials, the FDA should shut it down.
Anon:
No, that’s not what I’m saying. Actually, I have no idea what your comment even means! I recommend that, instead of taking a statement I’ve never said and attributing it to me, you just directly say what you actually think, and then go from there.
Andrew or anyone:
I often can’t find a reply under the comment I’m keen to reply to. Is there a solution?
Also, I once asked Andrew how to subscribe to his blog and he said he didn’t know. Does anyone? Thank you & happy holiday!
Deborah:
We have an RSS feed. I don’t know how it works, but there must be some experts out there who know how to install such things. Otherwise you can just go on the blog every day and see what’s up!
I’m not much into using RSS. That said, I downloaded NetNewsWire (free RSS client for Apple Macs). Started it up and hit the plus button in the upper left-hand corner.
An empty text box appeared. I pasted https://statmodeling.stat.columbia.edu
into that box and bingo—the screen was populated with the recent posts.
However, the comments do not appear for me. Maybe someone can explain how to get the comments.
“I often can’t find a reply under the comment I’m keen to reply to.” If you mean that some comments show “reply” under them and some don’t, there seems to be a limit on how many comments deep a reply can be. You’ll have to reply to the closest comment “above” the one you want to reply to, and clarify in the comment itself what you’re responding to.
As for subscribing: Feedly works (feedly.com), and it’s a fairly convenient way for keeping track of blogs.
Neat work. I wondered, Is the data and code for this first NEJM Evidence paper available somewhere? It could be nice to work with this distribution for p-values, at least next time I teach design and analysis of experiments.
Looking for data, I found this line: “A data sharing statement provided by the authors is available with the full text of this article at NEJM.org.”
I downloaded the Data Sharing Statement, but the only question with an answer was:
“Will the data collected for your study be made available to others?”
“Not a clinical trial”
which was kind of like, well, yeah, but there is still useful data here no? I, however, can totally relate to finding these kind of (increasingly common) checklists frustrating, and often they have accompanying instructions that might say, “You only need to fill this out for clinical trials” or something.
I then found reference 4 (https://osf.io/xjv9g/), which does have the data — great! Anyway, could be nice to have the code archived somewhere that goes from that data set to the results in this paper. I downloaded the data, but then it wasn’t immediately obvious what subset was being used.
Saw this on X.
Beware of sign errors (Gelman, 2014)
Abandon significance testing (Gelman, 2017)
and now (Gelman, 2023)
if p .05, prob. sign err. = .71
Doesn’t this imply that selecting for significance is reasonable to avoid sign errors.
But the article warns about using statistical significance. Can you clarify.
Js:
This recent paper, and others such as my paper with Loken from a few years ago, examine the statistical properties of methods that select on statistical significance. This is worth studying, because many researchers and publications do select on statistical significance, and we want to understand what that does. That does not mean we think that selecting on statistical significance is a good idea.
I think that the statement, “selecting for significance is reasonable to avoid sign errors,” kinda misses the point. The problem is with what Sander Greenland and others have called dichotomania. I don’t think researchers should be selecting on anything. They should be reporting results. If there is interest in sign error, look at that directly. It will not make sense to do so based on statistical significance, for reasons we discussed here with followup here. See here for further discussion of these points.
Sorry, there was a cut and paste error. I think the post was about your Table 3 in the article.
with p = .10 to 05, there are 91% correct signs.
with p = .05 to .01, there are 95% correct signs.
So, it seems ok to cite your article as evidence that even with low power, the risk of a sign error with p < .05 is less than 5%.
I take this as good news. While point estimates are not trustworthy, the sign of published significant results is likely to match the direction of the effect in the population.
Js:
Kind of. If everything’s kosher then, yes, even a low-powered study, when the outcome is selected on statistical significance, will likely get the sign right. The trouble is that everything isn’t always so kosher.
Here’s an example, one of my favorite, discussed in my post, This is what “power = .06” looks like. Get used to it. and its followup, This is what “power = .06” looks like (visualized by Art Owen). It was a study purporting to show that single women during a certain time of the month were more likely to support Barack Obama for president. I labeled this as a power=0.06 study but I was really being generous, as I think any real effect would be quite a bit lower than the hypothesized true effect size of 2 percentage points that I used in my calculations.
The other issue is that, with weak effects, there is not clear “direction of the effect in the population.” Remember that study claiming that women were three times more likely to wear red or pink shirts during certain times of the month? The authors of that study followed it up with a failed replication that they characterized as a successful development of their theory by hypothesizing a previously-unanticipated interaction with the weather. The point is that there is no meaningful direction of the effect in the population here. Lots of social science studies have this sort of goalpost-shifting, and it happens in medicine too.
The other thing is, even if you keep the outcome and conditions clearly defined, when an effect is small, it can change sign. It can be +0.01 one day and -0.03 the next. A study done of a particular population in a particular time will not necessarily generalize. This can be considered varying effect sizes or as systematic error that varies across scenarios and over time.
I’m not saying that estimated effect sizes should be ignored: of course there’s a difference between an estimate of +X and an estimate of -X, whatever the standard error may be. Again, though, such calculations don’t take account of selection bias, of researchers finding what they are looking for, or rooting around in the data to find something publishable, or designing studies in a way that allows noise mining.
Dean: The code for the NEJM Evidence paper should be available when you scroll to the bottom as “Supplementary Appendix”. Similarly, the code for the Stats in Meds paper should be available as “Supporting Information”. Feel free to email me if it’s not accessible.
To me, it looks like Erik et al.’s Cochrane paper gives empirical evidence for a lot of the theoretical ideas around p-values in Colquhoun, Greenman, and Berger. We can take p-values from frequentist proceedures, and use prior information to adjust our expectation that an individual frequentist result is “true” or “replicable” once we’ve seen the data.
Maybe the devil is in the details, but at least for a user of statistical tests like me, converting p-values into an error probability *seems* like it would be pretty useful for explaining my results to someone else. Something like, “This experiment gave us a 95% frequentist confidence interval of 1.5 +- 1.5, but if we add in our knowledge about how experiments work, there’s only a 70% chance this effect is much different from zero.”
After writing this, I’d admit that my logic might seem a bit convoluted at first glance, even to me. After all, if we don’t really believe that the frequentist confidence interval is good, why report it that way? Wouldn’t a full Bayesian Analysis be better? But maybe it’s still reasonable to separate our “subjective” and “objective” tests. Frequentist statistics are more robust to assumptions, meanwhile (well-calibrated) Bayesian results can inform better decision making. At my job (software), there are certain internal procedures that require frequentist statistics, but there are a lot of other decisions to be made where an “error probability” could be informative, even if that’s just deciding whether to do further investigation.
Just had time to read the article and was surprised you didn’t cite our work.
We found an FDR of 14%, you didn’t believe it. Now your own estimate of Type-S errors is 2%.
Even lower. Just curious how you explain this.
Jl:
I think you’re referring to the article, “Empirical estimates suggest most published research is true,” by Leah Jager and Jeffrey Leek, Biostatistics (2014). Keith O’Rourke and I discussed that paper here. Here’s what we wrote at the time:
In short, while I recognize that the concept of false discovery rate is useful to many researchers, it does not make sense to me in this context.
Regarding the specifics of our recent paper, it would be best to ask the first author, Erik van Zwet, who is the one who was working directly with the Cochrane database. The Jager and Leek (2014) paper did not come to mind when we were doing this recent work, but, now that you mention it, I do see the connection. I guess there’s a whole literature on this sort of empirical evaluation. Several of the coauthors on our paper work in epidemiology and biostatistics, and I’ll defer to them on that literature.
I agree with your general point that there’s more to be said regarding the comparison and integration of summaries from different sources. I don’t have a great answer regarding your question about 14% and 2%, as the two papers are completely different, with different data sources, different goals, and different methods. With the Cochrane database we’re estimating an underlying distribution of effect sizes; the Jager and Leek paper is much more indirect and is based on a selection model. I guess that one way to compare would be to take the Cochrane database, select on p-values less than 0.05, and then apply the Jager and Leek method, or something like that. I would not be so interested in such a result for its own sake—as explained above and in my linked article, I don’t really see the point of the false discovery rate—but it could be helpful if the goal is to map between the two methods.
It feels like the criticisms the authors wrote in response to Jager and Leek’s paper from a decade ago, using this same methodolgoy, were not addressed at all.
Gelman and O’Rourke wrote then (https://academic.oup.com/biostatistics/article-pdf/15/1/18/678375/kxt034.pdf) wrote “… we just do not think it is possible to analyze a collection of published p-values and, from that alone, infer anything interesting about the distribution of true effects.” The new paper does just that.
No references to that work or to Schimmack’s work? It feels wrong.
I’m not a statistician, but I expected the authors to have at least referenced and addressed their own criticisms:
https://www.linkedin.com/posts/ronnyk_it-feels-like-a-stefanik-moment-for-some-activity-7149588595228459008-337R
Ronny:
The collection of p-values studied in the paper by Jager and Leek had huge problems of selection, much beyond the selection model they then used to analyze the data. Here is what we wrote in our paper:
In contrast, we use the Cochrane Database of Systematic Reviews, which, as we state in our paper, “contains the results of more than 20,000 randomized clinical trials (RCTs) in biomedicine.”
Another thing is that, as discussed in my above comment, the method used in the Jager and Leek paper is much different than what we do. They fit a selection model (making strong assumptions that we do not find reasonable, for reasons we already discussed) and are interested in the false discovery rate, which is based on a model in which effects are likely to be exactly zero, whereas we use a continuous model of effects, which makes a lot more sense to us. I don’t think it’s wrong that we don’t cite a fatally-flawed (in our opinion) paper that uses a different approach to answer a different question. I guess there is room for a future paper (perhaps written by you!) comparing all different approaches in the literature of meta-analysis, including but not limited to those being discussed right here.
There were good criticisms written in response to Jager and Meek, beyond just a simplistic model, but about the methodology of analyzing a corpus of results, which you’re now doing.
Given that a subset of the current paper authors wrote these criticisms, I do think you should have addressed them, or at least mentioned them.
I think showing high False Discovery Rate or S/M errors are both ways to show issues with low power. I don’t agree that false discovery rate is invalid for continuous model effects, which you say above. Colquhoun (who calls the concept False Positive Risk) addresses this exact point in https://royalsocietypublishing.org/doi/epdf/10.1098/rsos.171085 Appendix A. Paraphrasing, there is no assertion of an effect that’s exactly zero, but rather we’re calculating and modeling as if it were zero and asking whether results are consistent with zero.
For non-statisticians, I believe the concept is very useful and have used it to warn people about low power experiments (e.g., in https://bit.ly/ABTestingIntuitionBusters).
Finally, your respose did not address my concern about Schimmack’s work not compared or at least referenced. I think his draft note makes some really good points: https://replicationindex.com/2024/01/03/a-comparison-of-the-new-look-and-the-old-look-at-z-values-from-clinical-trials/ and I’d love to see them addressed.
Ronny:
There is a large literature on meta-analysis, and I respect that you and others think that false discovery rate is a useful concept. This is not the position that we take in our paper, and I don’t think it’s necessary for a specific research paper to engage in discussion with all other related methods that we are not interested in following. Our paper is just one contribution to the subject; it is not intended to be a review article on meta-analysis of p-values or z-scores in medical literature. Such a review article would be valuable, and it could discuss and compare the recent papers by Zwet and his collaborators as well as work such as that of Jager and Leek.
Regarding the Schimmack work, I had not been aware of any specific work of his on medical trials. You point to a note of his from 2024 which cites some papers of his that I had not heard of. If I were going to cite any literature on meta-analysis under selectin bias, I would start with Hedges (1984); see discussion here, but this did not seem relevant to our recent work, as we were dealing with a database that did not have this sort of selection on statistical significance.
Finally, I agree with you that more can be done in this area. Our work is pretty specifically set up in a Bayesian context, with the goal of getting prior distributions that are better than the usual defaults. It would be interesting to see further work comparing this to other approaches. I continue to think that the Jager and Leek approach (trying to learn about underlying effects using a selection model applied to an uncurated dataset) is pretty much hopeless, but perhaps some insight can be gained by applying such methods in more controlled settings.
Andrew and Erik:
Thank you for the article(s); I appreciate the approach! My question relates to modeling a prior for a metric that may not always be the primary metric across different medical trials, though it is always included. Would it be better in such cases to avoid converting it to a Signal-to-Noise Ratio (SNR) and instead fit a mixture of normal distributions directly to the point estimates and standard errors? How would you decide whether it’s worth breaking it per medical field, for example? Thanks!