2015-vintage replication-crisis-era junk science floats into the news

So, I came across this news article titled, “Riley Thinks Suits Make the Coach. Research Says He Might Be Right.”:

The suit had a classic name: the Clark Gable. Navy blue and cut just right, it was the creation of Giorgio Armani, the legendary Italian designer.

It was the piece that made Pat Riley, the legendary NBA coach and executive, believe in the power of style. . . .

“I think an audience wants to see somebody on the sidelines who looks like a leader, dresses like a leader, acts like a leader,” Riley said.

It sounded like a bold claim. Sure, a business suit is undoubtedly nicer than the casual “athleisure” look — team-issue polos and pullovers — that NBA coaches adopted during the COVID-19 pandemic. But can a coat and tie really make someone more of a leader?

“It’s a perfectly reasonable thing to think,” said Abe Rutchick, a professor of psychology at California State University, Northridge. “Which is the idea that the clothes we wear have psychological meaning. We put something on, it’s not just clothes. It means something.”

Uh oh, social psychology research . . .

The article continues:

In the early 2010s, during the rise of casual attire, Rutchick and his colleagues examined a similar question and found something intriguing: Wearing formal attire might actually make a person think and act like a leader.

The researchers, using a variety of cognitive tasks, found that wearing formal clothes caused participants to shift from a concrete mode of thinking to a more abstract mindset — they thought of the big picture and looked further into the future. In other words, they thought like someone who was in charge. . . .

The paper, published in 2015, came a few years after another group of researchers found that people who wore a doctor’s white lab coat — and understood its symbolic meaning — had an increased ability to focus and pay attention. . . .

This sounds pretty bad, no joke. The early 2010s were the high-water mark of junk social psychology. This sort of study was one of the main reasons that the replication crisis became a crisis.

I thought journalists had wised up on this sort of thing, but I guess it remains afloat in the business-inspirational world of leadership.

Don’t get me wrong–I have no problem with these “leadership” stories. It’s cool to read about Pat Riley, and I have no reason to doubt that suit-wearing worked well for him. Everyone has to develop their own personal style. My problem is just with the purported scientific claims.

I found the journal article and, yeah, it’s classic replication crisis fodder:

Study 1: N = 60, p = .03
Study 2: “conceptual replication,” N = 60, p = .05 with 18 people excluded because of missing data
Study 3: N = 34, p = .02
Study 4: N = 54, p = .03 after some data were excluded
Study 5: N = 150, a mix of significant and non-significant results, conclusions made based on whether various inferences reached a significance threshold.

This is pretty much textbook bad statistical analysis of the replication-crisis variety:
– Small sample sizes and noisy data so that there’s essentially no power to detect realistic effect sizes (the kangaroo problem);
– Many researcher degrees of freedom in data exclusion, coding, and analysis, the sort of flexibility that makes it possible to achieve statistically significant p-values even in the absence of any signal;
– A bunch of p-values all in the 0.01 to 0.05 range, which is not what you’d expect from a sampling model of independent experiments (or see here);
– Flexible theories that could explain results through many sorts of interactions (the piranha problem);
– No preregistered replications.

That’s just how they did things back in 2015 so I’m not trying to single out these particular researchers. We know better now. We know not to trust this sort of claims. We don’t need to find a Wansink- or Ariely-style smoking gun; nobody’s suggesting there’s fraud here; it’s just standard-issue junk science of the sort that, until recently, was regularly published in major psychology journals and was regularly featured uncritically in major news media.

The only notable thing to me is to see this sort of claim being pushed in the New York Times now, because I had the vague impression that journalists were now aware of the replication crisis. But I guess there’s still a reservoir of credulity for such claims for stories related to the fuzzy topic of business leadership. I’d hope that straight-up sports reporting would have higher standards for the reporting of research on human performance.

P.S. This is an appropriate post for July 4th now that junk science is ensconced in the U.S. government.

The New York Knicks and the martingale property of calibrated probability forecasts (with some simulation and R code)

This long post covers four topics:

1. The Knicks’ stunning series of come-from-behind victories to win the NBA title in 5 games;

2. The martingale property of probability forecasts;

3. An example of learning from simulation;

4. How we (sometimes) do research in probability and statistics.

I don’t know enough about this blog’s audience to know which of the four topics will appeal to most of you. For the internet as a whole, it’s #1; for most of you, it might be #3.

I’m interested in all four, which is why I’m writing this all up right now. I’m embarrassed to say that it took several hours to do this. I was originally planning to post this Sunday morning after the game but it took time for me to get to the task. Most of the effort came from writing the code, not from writing the text. And there’s actually not much code, as you can see if you scroll to the end of this post. The main effort was not figuring out the syntax or even debugging (although there was some of that) but in working out what I wanted to be coding in the first place.

On the plus side, this is research I’ve been wanting to do for awhile, so (a) I don’t think this effort is wasted, even beyond whatever educational and entertainment value if has for you, and (b) I learned a bit from this already. Looking at data is always good; experimenting with simulation is always good.

Ok, here goes.

The NBA finals

Hey, remember this, from game 4 of the recent NBA finals:

Or the trajectory of the game that came after:

Just for completeness, here are the traces for games 3, 2, and 1, also courtesy of ESPN:

In game 4, the Spurs at one point were estimated to have a 99.6% chance of winning. But, as you might have heard, they lost.

Extreme win probabilities

Were those stated win probabilities too extreme?

On one hand, sure, unusual events happen on occasion. If you have a 0.4% chance of losing, that’s something that should happen 1 in 250 times, and there were a lot more than 250 basketball games just in this past season. On the other hand, very unusual event are supposed to happen only very rarely, and there was a point in the third quarter of game 4 where ESPN’s algorithm gave the Spurs a 97.1% chance of winning, a point in game 1 where the Spurs were given a 94.1% chance. There was a moment in game 2 where the Knicks were assigned a 98.2% chance of winning, and, sure, they did win that one, but given that the final score was 105-104, after being tied 97-97 and 104-104, it seems in retrospect that this 98.2% was a bit overconfident.

Should we be suspicious of these probabilities? One way to ask this question is to check calibration: if we collect all game situations where a team has a 99.6% of winning, are they winning 99.6% of the time?

On the other hand, I’m picking the most extreme values of these win probabilities. You should get calibration of win probabilities at any time, and it’s ok to condition on them, but only to condition on what came before.

That is, if we look at win probabilities at the end of the first quarter, or at the end of the first half, or at the end of the third quarter, they should be calibrated. And if you look only at win probabilities only when they’re greater than 99%, they should be calibrated. And if you look only at win probabilities when they are the maximum for the game so far, they should be calibrated. But it’s not clear to me that you should expect calibration for win probabilities selected to be the maximum for the entire game, because if the win probability at time t is p(t), and you condition on the event p(t) < p(t_0) for t > t_0, that could provide information. It’s tricky.

The martingale property of probability forecasts

We wrote about this in section 1.6 of our 2020 article, Information, incentives, and goals in election forecasts:


And it also came up in some blog posts:

from 2020: Do we really believe the Democrats have an 88% chance of winning the presidential election?

from 2020: More on martingale property of probabilistic forecasts and some other issues with our election model

from 2024: “Unusual Betting Patterns With Several Temple Games”: It’s martingale time, baby!

also from 2024: It’s martingale time, baby! How to evaluate probabilistic forecasts before the event happens? Rajiv Sethi has an idea. (Hint: it involves time series.)

I’d expect ESPN’s win probabilities to be closer to calibrated than prediction-market odds or model-based election forecasts. Prediction markets depend on the bettors and there’s no reason to expect calibration, at least not until the market is fully mature in some way. Model-based election forecasts are based on approximate models that have known pathologies (for example here), so they won’t be universally calibrated. ESPN’s probabilities won’t be calibrated either–they too are based on an imperfect model–but I assume it’s model has been trained on tons of data so I don’t think it should be far off.

If someone could send me the moment-by-moment estimated win probabilities from some large database of basketball games, we could take a look.

In the meantime we can get some intuition by simulating from a mathematical model where we can compute win probabilities exactly.

Simulating the process

Assume a simple Brownian motion with drift, where the score differential y(t) starts at y(0) = 0 and then takes a continuous random walk so that y(t) ~ normal(delta*t, sigma*sqrt(t)). We’ll scale t to be in minutes, so the game goes from t=0 to t=48, with the winner being determined by y(48). The drift is then delta=point_spread/48, because this is the expected final score differential before the game has started. And we’ll set sigma=2, which seems reasonable: 2*sqrt(48)=13.8, so that the sd of the final score differential is approximately 14 points.

One cool thing about this model is that the win probability can be trivially computed given the score differential at any point in the game.

How wrong can you be?

To demonstrate, I’ll show the results–the score and the win probability during the game–for 18 independently simulated games. For simplicity I’ll assume the point spread is 0, so the two teams are always assumed to be evenly matched. And I’ll step through the game 10 times per minute, thus approximating the game as a sum of 480 independent increments.

The code is below; here are the results:

I don’t know enough about basketball to have a sense of how plausible these are as game outcomes (setting aside the lack of discreteness in the score; we used a continuous model so that we could more easily compute the relevant probabilities analytically). They don’t look too much like the Knicks-Spurs game except for that one simulation near the lower left of the plot, where the “Spurs” led by 10 points into the third quarter, maxing out with a win probability of 95.6% before eventually losing.

To get a broader picture, I simulated 10,000 games. (Just as a reference point, there are 30 NBA teams, so there are 82*30/2=1230 regular season games each year.)

For each game, I computed “max_p_wrong”: the highest win probability assigned to the game’s eventual loser. In my simulation, every game starts with a 50/50 probability–remember, for simplicity I’m always assuming a point spread of 0–so max_p_wrong must be somewhere between 0.5 and 1. Here’s what comes out:

So, extreme wrong probabilities are not unheard of. How common are they? Out of these 10,000 games, 61 had max_p_wrong greater than 99%. That is, in 0.6% of games, the eventually-losing team exceeds the threshold of 99% win probability during some point in the game.

This result should go up if we move to continuous updating. But we’re already updating 10 times a minute. Increasing this schedule to 50 times a minute increases Pr(max_p_wrong > 0.99) to 0.0075, and increasing to 100 times a minute takes it to 0.0076, so my guess is that this is roughly the continuous limit.

OK, just to check, I’ll simulate 100,000 games, and now Pr(max_p_wrong > 0.99) is 0.0072 with 10 updates a minute, or 0.0084 with 50 updates per minute. So I’ll go out on a limb and say that if we were to compute the exact probability under continuous updating, we’d get 0.0085.

This was a surprise. Before doing this simulation, I was assuming that the probability of p_win exceeding 99% in for the eventual loser at any time in the game would be more than 1% because of selection. I guess my intuition was wrong. Maybe it has to do with the fact that I’m conditioning on which team wins. (Of course, if you go the other way, the probability of p_win exceeding 99% for the eventual winner is 100% in the continuous limit, because with epsilon of a second left in the game the winner will almost certainly be known.)

So, yeah, the above graph is kind of interesting. Under our model, most games won’t stray too far into retrospectively-embarrassing probability estimates, but it can happen sometimes.

It would be interesting to compare the above graph with what you’d get from a database of game-odds data from ESPN or whatever.

Just to be clear: there’s no reason to think that the above graph represents any sort of universal property of martingales. It’s a very specific model! But you have to start somewhere. Also, the existence of various central limit theorems makes me hold out the hope that this could be a general result under some appropriately restricted class of continuous martingale processes. It’s a research question!

A surprising uniform distribution

To get some further understanding of the process, I gathered the win probabilities after the end of each of the three quarters for the 10,000 simulated games. Below are histograms of these probabilities and calibration plots:

Unsurprisingly, the calibration is fine. After all, the probabilities are computed from the same model that the data are drawn from. Indeed, even the apparent anomaly in the lower-left plot is just a small-sample artifact which disappears when we up the number of simulations to 100,000.

More interesting are the histograms. It makes sense that, as the game goes on, the distribution of win probabilities starts at 0.5, then gradually bunches up at 0 and 1. Indeed, at the end of the fourth quarter the win probabilities are exactly 0 and 1.

But it’s funny how the distribution of win probabilities is exactly uniform at halftime. There must be a direct mathematical argument giving intuition for that result; it’s too perfect to just be an accident.

Lots more research to be done here:

– Generalizing beyond the continuous model to allow discrete scoring changes.

– Generalizing beyond the random walk; there’s no reason the model needs to be Markovian.

– Are there general statements that can be made about these distributions of win probabilities under arbitrary martingale processes? I’m guessing there are some results. At least, there should be some inequalities and limit theorems.

– Looking at real data from basketball, other sports, and other realms, including election forecasts and prediction markets.

Our ultimate aim here is to come up with a general measure of departure from the martingale property of probability forecasts. We want something that can be applied to any dataset, obviously with more precision as the series get longer, more finely-spaced in time, and when replications are available (as in those thousands of basketball games).

P.S. Here’s the R code to make the above simulations and graphs:
Continue reading

How much skill is in “skill games”? There can’t be much.

A few years ago we posted on luck vs. skill in poker and luck vs. skill in sports.

A new one of these came up when Palko pointed me to this disturbing news article, “They Look Like Slot Machines. They Pay Out in Cash. And Critics Say They Are Getting Workers Killed,” which reports:

Store clerks in Pennsylvania have been robbed and shot while handling payouts for “skill games,” which are not subject to the security standards required of gambling operations. . . .

They look like casino slot machines and video arcade games, but they are neither. They are skill games. Like their name implies, players must use their skills — memory, reflexes, strategy, recognition — to win cash. They don’t solely rely on the luck of the draw, like with slot machines. . . .

The Pennsylvania Gaming Control Board licenses 17 casinos and 75 truck stop video gaming terminal facilities, requiring them to have secure facilities, trained staff, and digital video recording. Their gambling machines also have to be linked to a centralized computer monitoring system. Businesses that offer skill games are not held to any standards, their critics say. As a result, some are putting their employees in danger by having them pay winners with cash. . . .

Some gruesome stories follow, along with predictable quotes from evil people making money off these things.

“Skill games”?

But here’s my question. How much skill is actually in these “skill games”? I assume not much, because, if the games really did involve skill, then skillful players could just show up and win regularly.

I guess the “skill games” could involve some small amount of skill, but not enough so that skillful players could beat the house edge.

Recent discoveries on the acquisition of the highest levels of statistical fallacies

Mark Goldstein points us to this post by Alex Dimakis, who writes:

A paper was recently published in Science on highest level of human performance across athletics, science, math and music. I think the paper makes some classical statistics mistakes that still fool many smart people. The paper “Recent discoveries on the acquisition of the highest levels of human performance” by Gullich et al. claims: “In summary, when comparing performers across the highest levels of achievement, the evidence suggests that eventual peak performance is negatively associated with early performance.”

The paper makes two mistakes. Base-rate fallacy and . . . Berkson’s paradox . . .

The study says simply that the very top at young age are not identical with the very top adults. (As one would expect, since there are *many many more non-elite young candidates*). Still, elite young performers are 40 times more likely to be in the top adults compare to general population. This is acknowledged in the paper but in page 6-7, a bit buried in the technical analysis and not sufficiently discussed in abstract or conclusions. . . .

The paper claims “Across the highest adult performance levels, peak performance is negatively correlated with early performance.” This is a classic example of Berkson’s paradox. Here is a simplified example to understand this: Assume that to be a successful actor you have to be either extremely good looking or extremely talented. Assume also that talent and looks are independent in the population. However, among sucessful actors you will observe a negative correlation between looks and talent. This doesn’t meant anything beyond the selection process and should not be extrapolated. My favorite example-joke of this is that basketball points scored is negatively associated with height among NBA players. (because to be an NBA player you have to be very tall OR be very good at scoring). From this, I extrapolated that since I’m 5’7, I will be scoring 80+ points per NBA game. . . .

Here’s paper in question, “Recent discoveries on the acquisition of the highest levels of human performance.”

Yeah, this sort of thing comes up all the time! For example, some celebrity academics a couple years ago wrote a book that included the false statement, “while correlation does not imply causation, causation does imply correlation.” Even more amusingly, they prefaced this by “We must, however, remember that”. I guess we must remember a lot of false things! Economist Rachael Meager gave a quick example showing why they were wrong; See details here.

This new example also looks a lot like the well-known regression-to-the-mean fallacy (for more on that, I recommend Section 6.5 of our book, Regression and Other Stories, which includes some simulation code to demonstrate the problem). Of course, just because lots of people know about a fallacy, that doesn’t stop people from making the error in new settings. That’s why it’s a fallacy!

P.S. An anonymous commenter points out that Dimakis (and, by extension, Goldstein and me) are being unfair to this paper. The descriptive results are what they are. I remain skeptical of the paper’s claim that “similar developmental pattern across different domains suggests widespread, and possibly universal, principles underlying the acquisition of the highest levels of achievement,” as I do suspect that much of what they have seen arises from the usual statistical selection artifacts. So maybe it’s ok to caution about the interpretation of these numbers. But now I’m thinking it wasn’t fair of us to slam the paper for presenting some interesting data findings.

An economist writes: “the fulminations over the #1 pick seem overheated to me.”

Jonathan Falk writes:

I [Falk] am always amazed at the amount of (digital) ink spilled on the perverse incentives involved in taking to get the #1 draft pick. The current local woes of the Giants and Jets obviously contribute a lot to these discussions, but they happen all the time. As an economist, it’s clear to me that the value of a draft pick is the incremental value, not the absolute value. I’m completely aware that the upper tails of distributions have much more dispersion than the center, or even the 80th-90th percentile does, but the fulminations over the #1 pick still seem overheated to me.

First, of course, is the fact that assessment is made with error, and there are plenty of #1 busts in every sport. #2s can be busts as well, of course, but that merely lowers the expected difference between #1 and #2 as the true value of both is attenuated towards 0 — #1 loses more.

Second, there is the issue of team fit. Greatness is a vector, not a number, and if the teams ahead of you in draft order need something else, you still stand a chance of getting the player optimized for your needs. Going the other way, of course, is that higher draft picks absolutely lower the number of teams that can steal your guy.

Third, teams are… teams. One person can only contribute so much. So the relevant assessment is now how much better A is than B, but how much the addition of A versus the addition of B will change the prospects of your team — which I think is pretty obviously a lower difference, though I guess your rationale for voting runs in the other direction — you ought to judge a small incremental addition by the gigantic difference between winning a championship or not.

Fourth, more narrowly economic, every incrementally pick costs more. I don’t think that effect is huge in the context of overall payrolls, but isn’t that then another anomaly? If #1 picks are so dramatically better than, say, #5 picks, why aren’t they paid multiples more?

I don’t really have anything to say here, because I have no sense of how much teams are paying for #1 or #2 picks. I do remember a couple years ago that everyone was talking bout Wemby, but basketball’s different than football because there are only 5 players on the court, so one player can make more of a difference.

The case of Wemby makes me think that one way this could be studied would be to compare different years. In some years there is a clear consensus #1 pick, other years not.

Why isn’t it possible to play a fun and serious game of poker not for money?

Dan Luu writes that, as a newcomer to poker, something puzzles him about how the game is played:

Poker players have collectively decided it’s not possible to play the game without trolling unless you play for “serious” money. The reasoning is something like, “obviously, people will make stupid plays like going all in every hand unless there’s real money on the line”. Outside of the implicit collective agreement to do so, this is patently absurd — people play all sorts of games where there’s no money on the line and they don’t, in general, purposely make troll moves, so there shouldn’t be an inherent reason poker can’t be played seriously when there isn’t serious money on the line, but since people have agreed to buy into this collective delusion, it seems fairly difficult to find a poker game where people actually want to play well without putting an amount of money up that’s meaningful to the people playing.

As a poker player myself, this rings true to me. OK, I’ve never been serious about the game–in grad school we had a weekly nickel-dime-quarter dealer’s choice game, mostly seven-card stud (this was before the popularity of table stakes Texas hold ’em, and “going all in” wasn’t a possibility in our game), and in the decades since then I’ve only played a few times, most recently over ten years ago. That last game included some political scientists and also some actual politicos who fit the stereotype (they were cynical and cursed a lot). It was pretty stressy, not a pleasant experience. I won a couple hundred bucks, probably more from luck than anything else, and one of the politicos was annoyed at me about that. I still think about the game, though. It’s a point of reference for me, as here, for example.

Anyway, yeah, in grad school we weren’t broke, but throwing $4 into the pot counted for something; it’s not a move we’d do just for laughs. Playing for pennies wouldn’t have been enough. And playing just to win, in the way that you might play a game of Scrabble, or chess, or ping-pong, or Uno . . . Nah, that just doesn’t work in poker.

The question is, why? Luu argues that this is just a convention, just one of the unwritten rules of the game, just as players avoid strategies using grid positions in Codenames. There’s an implicit agreement in poker not to play seriously unless the stakes compel it, and without this convention, people could play happily for low or even zero stakes, just as they do with chess or bridge. Luu:

There’s often some specific argument like “it’s more fun to play than to fold”, but most people would say this about declaring vs. defending in bridge, and yet you don’t see people randomly bidding 7NT (the maximum bid) in bridge all the time so their team is declaring and not defending, the way you see people randomly going all in in poker when money isn’t on the line (or only a very small amount of money is on the line).

I don’t know about that. I mean, yeah, I think Luu is right about people being willing to play serious bridge or Scrabble or whatever for zero stakes but not doing so with poker, but I don’t think it’s just a convention.

Some possible reasons

So let me throw out a few reasons why it’s essentially impossible to play a fun and serious game of poker not for money, even though people have no problem doing this for many other board games:

1. There’s a historical relation between recreational game-playing and gambling. I’m not an expert here, but my impression is that if you went back a hundred years ago, when people played bridge, gin rummy, poker, cribbage pretty much any card game, it was usual to play for money. Not to mention dice games, which are only played for money. Nowadays I don’t think anyone plays gin rummy–it’s just too damn boring, and there are too many other competing leisure activities.

2. Low effort, high risk, high reward strategies (what Luu calls “trolling”) exist in poker more than in other games. What would be the equivalent in Scrabble, for example? Maybe trading in your letters more often in the hope of getting a seven-letter word? But that’s a lot of work, especially if you’re not a top player. (If you are a good player, then trading in can be a legitimate strategy, just as going all-in can be a serious play for a good poker player.) In chess, you can play more wildly, more offense and less defense, sacrificing pieces for a positional advantage—and players are more likely to do these fun plays in a home game with no stakes than in a tournament where rating points are on the line. There is some “trolling” in chess too–for example, goofy openings where you purposely block off your own pieces, just to get to an interesting position unlike anything your opponent is familiar with–but that’s not quite the same as going all-in; the poker equivalent would be more like a strategy of betting in a slightly irrational way to throw off the other players.

Or what about Uno? Uno’s a boring game but it has the pleasant feature that it requires no thought to play; it can be relaxing in the same way that it’s relaxing to watch a baseball game on a sunny afternoon. When you play Uno for no money, I guess you play with less focus than if you’re playing for money, but it’s pretty much the same game.

I guess my point is that, in any game, the lower the stakes, the more opportunity for silly play, but poker is one of the few games where trolling can be exciting. The closest analogy would be ping pong. Slamming it on every point is like going all-in in poker: it’s exciting, you’ll probably miss, but it’s very satisfying when you win.

3. Poker is a multi-player game. In ping-pong you can have a friendly game where both players are slamming every point, or a friendly game where both players are trying their hardest to win, or a friendly game where both players are just hitting it back and forth–any of these are possible. But in zero-stakes or low-stakes poker, it only takes one player to troll and it throws off the whole game.

4. Poker’s a skill game but not completely a skill game. Luu writes:

I would’ve thought that playing in the largest public cash games around would be the equivalent of joining a local open chess tournament, where anyone who started as an adult, let alone as a middle aged adult, will get demolished by IMs/FMs/NMs (I looked up one random local chess tournament, and there was an IM who placed 3rd). But you can play poker for two weeks and sit down at the biggest public games in town and do fine (there are, supposedly, some well-known private games that are a bit bigger than the largest casino games and I have no idea what the level of skill in those games is). Part of that may be down to variance, but part of that seems to be that the local level of play in poker isn’t all that high, at least in the largest public cash games around. . . .

I strongly suspect the best poker players are much better at poker than the best modern board game players. But, for some reason, you don’t see this difference expressed in local games in the same way that you would if you went down to the local chess club.

I just think the range of abilities, from beginner to intermediate to expert, is much wider in chess than in poker. I’ve played poker with some people who are clearly worse than me and some who are clearly better than me–but these differences are nothing like the difference between me and a really bad chess player, or the difference between me and a really good chess player.

5. The structure of the game. Poker’s much more interesting when you play it for money. An 8-hour poker session is commonplace, but people usually would not want to play a board game for 8 hours. And nobody would play 8 hours of poker if not for money (unless, say, you’re trying to get practice for a future money game)–it would just be too boring.

There a scene in Valis, I believe, where Dick is in a mental hospital and they’re playing games like Go Fish. There’s the opportunity to play poker, but not for money, and Dick says that poker is not a card game, it’s a money game. And he’s got a point. Money is central to poker in a way that it’s not in chess or Scrabble or even bridge. In poker, you’re not just playing for money; the game is built around betting. Money is involved at every stage of the game play.

6. In money poker, the goal is not to win; it’s to improve your bank balance. This makes a difference. For example, suppose it’s the end of the night, you’re down by a lot, and you’re in one last big hand. If your only goal was to end up a winner, you might be motivated to risk a big outlay even if it only gave you a small chance of winning that final pot. But it doesn’t work that way with money. Being down $100 is bad, but being down $300 is worse. It’s not like football where you might as well throw that Hail Mary pass because, if you don’t try, you’ll lose, and getting that pass intercepted won’t make things any worse.

All said and done, though, I think Luu is on to something when he talks about the culture of the game. I could imagine a version of poker that’s played for points, just like Scrabble, and the goal is to be the winner at the end of the game. I guess the point is that such a game would be kind of boring, closer to gin rummy than to Scrabble.

Can you hit a home run off of Paul Skenes?

I received an email with subject line, “Can my friend hit a homerun in infinite tries off the best pitcher in baseball”:

Hey Professor Gelman,

I’m sure this is a weird email that you probably don’t get often but if you could respond that would be awesome!! My school is having a massive debate right now. In an INFINITE amount of attempts (without the loss or gain of strength) could a 5”7, 140lb Senior hit a home run off a 100mph pitch from Paul Skenes, at PNC park (shortest dimension of 320 ft.). If you could get back to me that would be awesome, thanks!

He has no experience playing the sport of baseball, he is not very athletic, there is no wind.

In my opinion I think he can as the possibilities of infinity would eventually create a scenario where he has the perfect swing, with the perfect launch angle, making perfect contact, in the precise direction.

I replied that it’s hard to speak of infinities but my guess is no, he couldn’t ever do it because he couldn’t swing the bat fast enough. But this is just my quick guess; I haven’t done any analysis on the question lately.

My talk at Stanford later this month: “What to do when your estimate is 1 standard error away from 0?”

Tuesday 28 Apr 2026, 4pm in CoDa E160:

What to do when your estimate is 1 standard error away from 0?

Andrew Gelman, Department of Statistics and Department of Political Science, Columbia University

We provide a new answer to this simple yet very important question. Thinking clearly about this problem leads us to bring in many ideas in statistical analysis and computing, including causal identification, meta-analysis, Mister P, expectation propagation, decision analysis, experimental design, and the fundamental unity of Bayesian and frequentist statistics. We demonstrate our approach in examples from many applications, including medicine, social science, business, sports, and public policy.

This work is joint with Witold Więcek and Erik van Zwet.

In addition to all the above, I’ll probably drift into some related general topics such as the role of experimentation in science and engineering and the limitations of thinking about policy analysis in terms of causal inference.

The point of yesterday’s post on the three ways of attacking a statistical problem

I fear that people may have gotten lost in the details of the data and code for the football won/lost example, so I wanted to clarify why I wrote the post.

In general there are three ways of attacking a statistical problem:

1. Probability calculation. Set up a probability model and crank it through. This will require a bunch of assumptions, and you’ll also need to set parameters in your model to reasonable values.

2. Direct empirical calculation. This will work if you have enough data, and if these data are not subject to selection.

3. Statistical modeling. Kind of like method 1 above, except that you fit (“learn”) the parameters from the data; as a result you can fit a more complicated model. I include machine learning in this category too.

In statistics classes, we focus on method 3. No surprise, right? Statistical modeling encompasses probability calculation and direct empirical calculation; indeed methods 1 and 3 can be viewed as special cases of method 3. Method 1 is method 3 but with a simple model and a crude method of setting the parameters. Method 2 is method 3 but with a simple model assuming stationarity in all directions.

So, yeah, statistical modeling. There’s a reason my colleagues and I have written multiple books on the topic, spent innumerable person-hours developing and using Stan, etc.

But . . . it’s good to know about methods 1 and 2 as well.

Why? Four reasons.

First, methods 1 and 2 are simpler, and sometimes they work just fine.

Second, even beyond simplicity, methods 1 and 2 have fewer requirements. Method 1 does not require the data (which is how we were able to get a good answer to that football question in the first place), and method 2 does not require a data-generation model. In contrast, method 3 requires data and a model.

Third, even when estimates based on methods 1 and 2 are seriously flawed, they can be useful starting points and comparison points to better approaches. Indeed, sometimes when a probability calculation gives a ridiculous result, this can be useful in developing intuition. For example, the notorious calculation of a probability of a tied election as 10^-90 came from an inappropriate application of a binomial-distribution model, which motivates the development of models for statistical dependence among voters, while the failure of straight-up empirical estimates motivates models that combine probability modeling and empirics.

Fourth, when people are informally estimating things, they’re often using some version of method 1 or 2. Which is fine! But then I think it’s important to be aware of what you’re doing and to ask, What is the probability model you are assuming, or What is the frequency calculation you are making?

Those four reasons–that’s the point of yesterday’s post.

These are the three ways of attacking a statistical problem (illustrated with the NFL example)

The following question came up the other day:

What's the most common four game start to an NFL season?
W W W W
W W L L
L L W W
W L W L
L W L W
L L L L

I replied:

Logic and math suggest that it’s either the first one or the last one. I think that extremely shitty teams are more prevalent than extremely good teams, so I’m guessing the last option.

There was a bunch of discussion in comments and so I thought I’d elaborate by describing three different ways of attacking this problem. The various ideas discussed in the comments to my earlier post can be thought of as approximations to these three approaches.

1. Probability calculation

Just to flesh out my intuitive reasoning above, let’s go with classic item response theory (a class of models that was originally developed around the time of the founding of the NFL, actually, but for different purposes!) and model the probability that team i beats team j as:

Pr(team i beats team j) = invlogit(a_i – a_j + b*home_ij),

where a_i and a_j are the ability parameters for teams i and j, and home_ij is a home-field measure, equal to 1 if i is the home team, -1 if j is the home team, and 0 if they’re playing on a neutral field. I’ll keep things simple by excluding the possibility of a tie game.

And now some numbers. First, what’s the home-field advantage? It says here that home teams win about 55% of their games, and if we assume this 55% roughly applies to two equally-matched teams, then b = logit(0.55) = 0.2.

Next come the team abilities. Let’s start with a normal distribution: a_i ~ normal(0, sigma_a). What’s a good value for sigma_a? Well, let’s compare a team that’s 1 sd better than average to a team that’s 1 sd worse than average. These are the 84th and 16th percentiles, which for a 32-team league would be roughly the 5th and 27th best teams. The probability that the 5th best team beats the 27th best team on a neutral field will be invlogit(2*sigma_a). What is that probability? Let’s say 90%? In that case, sigma_a = logit(0.9)/2 = 1.1. Or if the probability is 80%, then logit(0.8)/2 = 0.7. I don’t know . . . let’s say sigma_a = 1.

Now we can do some math . . . ummm, let’s just simulate a million games:

n_sim <- 1e6
b <- 0.2
sigma_a <- 1.0
a_i <- rnorm(n_sim, 0, sigma_a)
y <- rep(0, n_sim)
for (k in 1:4){
  a_j <- rnorm(n_sim, 0, sigma_a)
  home_ij <- rbinom(n_sim, 1, 0.5)
  y <- y + 10^(4-k) * rbinom(n_sim, 1, invlogit(a_i - a_j + b*home_ij))
}
output <- table(y)
names(output) <- sprintf("%04d", as.numeric(names(output)))
print(output)

Kind of hacky . . . this is how I learned how to code back in the 1970s!

Anyway, here's the result:

  0000   0001   0010   0011   0100   0101   0110   0111   1000   1001   1010   1011   1100   1101   1110   1111 
102992  56795  56726  48753  56499  48423  48170  63246  56738  48173  48075  63398  48344  62814  63208 127646 

Hey, that's wack! As predicted, more at the extremes, but more 1111's than 0000's! I'd've expected they'd be equal, given that I've simulated the sigma_a's from a symmetric distribution.

Let's try again with a new set of random numbers:

  0000   0001   0010   0011   0100   0101   0110   0111   1000   1001   1010   1011   1100   1101   1110   1111 
102759  56663  56887  48353  56695  48292  48581  63118  56562  48748  48057  63443  48541  62860  62885 127556 

Again, lots more 1111's!

I guess it has something to do with the home-field advantage . . . oh, I see, I have a bug in my code! I'd assigned home_ij as equally likely to be 0 or 1, but what I should be doing is having it equally likely to be -1 and 1. So I'll swap out the line

  home_ij <- rbinom(n_sim, 1, 0.5)

with:

  home_ij <- sample(c(-1,1), n_sim, replace=TRUE)

And now I'll run the corrected code. Here's what we get:

  0000   0001   0010   0011   0100   0101   0110   0111   1000   1001   1010   1011   1100   1101   1110   1111 
114165  60279  60102  48707  59340  48413  48431  59904  59922  48644  48859  59741  48284  60178  60115 114916 

Ahhhh, much better.

But maybe those numbers are too extreme . . . does a good team really have a 90% chance of beating a bad team? Remember the saying, "any given Sunday"! So let's try again with sigma_a = 0.7. Here's what a million simulations gets us:

 0000  0001  0010  0011  0100  0101  0110  0111  1000  1001  1010  1011  1100  1101  1110  1111 
94877 61211 61547 53396 61252 53336 52875 61609 61432 53280 52924 61390 53079 61498 61484 94810 

So, even then, lots more 4-game losing streaks and 4-game winning streaks than anything else.

Some commenters said that the NFL does schedule balancing so that good teams are more likely to play good teams and bad teams are more likely to play bad teams. This would reduce the counts at the extremes. We could model that too but I'm kinda lazy so I won't do it here. As the textbook writers say, I'll leave it as an exercise for the reader.

But what about that other thing, that there are more extremely shitty teams than extremely good teams? We can use some skewed distribution . . . ummmm, I don't know much about these! There's something called the noncentral t . . . I'd like to do something with some intuition, something I understand. OK, for now I'll just hack it, replacing the normal(0,1) distribution by a normal(0,0.7) on the positive side and normal(0,1.0) on the negative.

So, in the above code I'll add the function:

rnorm_split <- function(n_sim, mu, sigma_neg, sigma_pos) {
  z <- rnorm(n_sim, 0, 1)
  ifelse(z < 0, mu + sigma_neg*z, mu + sigma_pos*z)
}

and then change the two instances of

rnorm(n_sim, 0, sigma_a)

to

rnorm_split(n_sim, 0, 1.0, 0.7)

And here we have it:

  0000   0001   0010   0011   0100   0101   0110   0111   1000   1001   1010   1011   1100   1101   1110   1111 
106711  59807  59534  50637  59860  50934  50615  61828  59241  50613  50626  62066  50725  61784  61985 103034 

To check uncertainties, we do it again:

  0000   0001   0010   0011   0100   0101   0110   0111   1000   1001   1010   1011   1100   1101   1110   1111 
107451  59519  59545  50471  59237  50756  51172  62029  59726  50706  50685  61763  50829  61576  61785 102750 

So, yeah, slightly more 0000's than 1111's, but not a lot, so who's to say what will happen after piping it through the scheduling thing where better teams play each other more often. I still think the general pattern will hold, but it might not show up in a small dataset. We'll get back to that point in a bit.

2. Purely empirical solution

According to wikipedia, "The NFL was formed in 1920 as the American Professional Football Association (APFA) before renaming itself the National Football League for the 1922 season." So let's start in 1920. Back in the day they had a lot of ties, so I'll make the decision to exclude ties; thus the above question will be interpreted as, "What's the most common four game start to an NFL season, excluding ties?"
Somebody who knows how to scrape should be able to could scrape the data from all the NFL seasons and just count up what happened.

OK, that's the planned data analysis. Next comes the design analysis: our expectation of what we might see.

The NFL used to have about 15 to 20 teams and now it has 32; just as a rough calculation I'll go with 25 teams per season x 100 seasons = 2500 teams, with 16 possible outcomes for the first 4 games of the season. 2500/16 is approximately 150, and if the games were all decided by coin flips (which they're not), then we'd expect approximately 150 +/ sqrt(150), that is 150 +/- 12 in each category.

But the games aren't decided by coin flips. See section 1 above. Our best guess is that there will be more cases on the extremes. Let's take the above numbers, which are based on a million teams playing 4 games each, and scale them down to 2500. That is, I'll simply take the numbers above and divide them by 400:

print(output*2500/1e6)

This yields:

    0000     0001     0010     0011     0100     0101     0110     0111     1000     1001     1010     1011     1100     1101     1110     1111 
268.6275 148.7975 148.8625 126.1775 148.0925 126.8900 127.9300 155.0725 149.3150 126.7650 126.7125 154.4075 127.0725 153.9400 154.4625 256.8750 

Ugly! Let's try again:

print(round(output*2500/1e6))

Which yields:

0000 0001 0010 0011 0100 0101 0110 0111 1000 1001 1010 1011 1100 1101 1110 1111 
 269  149  149  126  148  127  128  155  149  127  127  154  127  154  154  257 

The counts at the extreme have approximate standard errors of sqrt(260) = 16, so, yeah, we should be able to detect this from all 106 NFL seasons. But the bit about 0000 being more common than 1111? That's kind of lost in the noise.

What about just the past 10 seasons (320 teams)?

print(round(output*320/1e6))

The result:

0000 0001 0010 0011 0100 0101 0110 0111 1000 1001 1010 1011 1100 1101 1110 1111 
  34   19   19   16   19   16   16   20   19   16   16   20   16   20   20   33 

sqrt(34) = 6, so this should still be detectable, but there is a chance that the results could look weird. And you can forget about getting any useful information comparing 0000 to 1111.

One way to see this is to do a couple simulations with n_sim = 320. Here's one:

0000 0001 0010 0011 0100 0101 0110 0111 1000 1001 1010 1011 1100 1101 1110 1111 
  31   19   21   17   15   21   22   26   20   15   20   19   13   17   16   28 

And here's another:

0000 0001 0010 0011 0100 0101 0110 0111 1000 1001 1010 1011 1100 1101 1110 1111 
  40   10   16   21   14   13   20   25   24   20   17   17   22   15   18   28 

And another:

0000 0001 0010 0011 0100 0101 0110 0111 1000 1001 1010 1011 1100 1101 1110 1111 
  29   20   18   20   22   16   16   20   21   17   11   24   16   11   18   41 

If you want to do it from one season, you'd run the simulation with n_sim = 32 . . . forget about it! Here's an example:

0000 0001 0010 0011 0100 0101 0110 0111 1000 1001 1010 1011 1101 1111 
   2    2    1    2    1    1    1    4    3    1    3    4    4    3 

You'll need data from multiple seasons to detect any patterns here.

3. Statistical modeling

A completely different approach is to fit a model to data. Let's assume that our helpful scrapers have done their job and supplied us with a clean dataset of all the games since 1920.

We could fit the above item-response model to the wins and losses (keeping things simple by excluding tie games).

Teams change from season to season, so I'd recommend fitting this model separately for each season, but pooling b (the home-field advantage parameter) and sigma_a (the sd of team abilities), maybe fitting a separate hierarchical model fore each decade.

But we can do better than that. Once we have the game scores, we can model them directly. Don’t model the probability of win, model the expected score differential. Something like this:

score differential ~ normal(a_i - a_j + b*home_ij, sigma_y).

The parameters a and b have slightly different interpretations now--they're on the scale of points rather than logit probabilities--but that's fine. A hierarchical model should be easy to fit. Again I'd fit a different model to each decade, or you can get more sophisticated with some sort of time series model allowing team abilities to change over the season and to have some stability between season. There's no end to the amount of modeling you can do here, if you have interest in the problem.

Once we have this model, we can simulate games and get a model-based estimate of the probability of each of the possible four-game outcomes in each season. Indeed we can do it with the actual matchups and then compare to what would happen in expectation under random matchups. The difference will give us some sense of the effect of the NFL schedule imbalances.

“12-dimensional chess”

In this amusing post, “Twelve Dimensional Chess is Stupid,” Steven Pav writes:

I cringe when I hear the term “Twelve Dimensional Chess” used as a metaphor. Certainly Twelve Dimensional Chess would be hard to visualize, and would present far more possible moves than regular two dimensional chess. However, high dimensional Chess suffers from a Curse of Dimensionality as the number of squares grows so quickly that play becomes uninteresting. In fact, I suspect that strategies exist which effectively guarantee a draw in sufficiently high dimensions. . . .

I [Pav] do not know the rules of high dimensional Chess, and I have assumed the players start with eight pieces and eight pawns. Maybe the number of pawns is linear, or even exponential in the dimension. Even so, it will take over 300 moves to promote the 64 pawns to Queens. Moreover, assuming one’s opponent could muster such an army without any losses, assembling such a large number of Queens in place to achieve checkmate might be tricky. Each Queen attacks at most 1.86 million squares. Again, this would be hard to visualize during play, but there are 2.2 billion internal squares (i.e. those not touching a boundary), and some 68.7 billion in total. Which means that even if your opponent has dozens of Queens on the board, each Queen can attack only a small fraction of the available squares. You could move your King largely at random without coming under attack.

So “Twelve Dimensional Chess” as a metaphor for a situation requiring great foresight or strategy in the face of many possible decision is flawed. Instead, it is a more apt metaphor for a very lonely random walk punctuated by infrequent interactions with others you can easily dodge.

In high-dimensional space, no one can hear you scream.

Maybe one of the remaining ’72 Dolphins will read this one.

Under the subject line “Thought you might find this interesting. (And curious what your intuition is, if you are not too sophisticated to still have one),” Shane Frederick sent me this question:

Suppose a normal distribution has a height of "1" at its peak (the mean).

What is the height of the curve at two Standard Deviations from the mean?

I replied:

exp(-0.5*2^2) = exp(-2), or about 1/7. Sorry, the math was so available that my intuition didn’t come into play. So I was the wrong person to ask this one!

Shane responded:

The vast majority of (smart) people underestimate this, and, more interestingly, override their intuition by adjusting further in the wrong direction – e.g. by correcting 0.06 to 0.03, by remembering that “the tails are long.”

Dan Goldstein asked me this recently at a conference. My guess (0.14) was excellent, but was based purely a perceptual estimate from my memory of what the curve looks like; akin to asking me for an estimate of the diameter of the grapefruit I ate for breakfast yesterday. I have no idea how the math works. I think there is a formula or something, possibly involving “e.” I had no intuition per se, besides the photo in my “minds-eye.” IF I had invoked math, I could imagine my “S1” would yield 0.025. And that my “S2” might have adjusted that downward, since that is ALL the mass of 2 SDs and higher. Butthen my other S1 would have overruled that S2 correction, since, as I visualize it, the curve has not come close to asymptoting at “only” 2 SDs.

He followed up with this one:

What's the most common four game start to an NFL season?

W W W W
W W L L
L L W W
W L W L
L W L W
L L L L

I replied:

Logic and math suggest that it's either the first one or the last one. I think that extremely shitty teams are more prevalent than extremely good teams, so I'm guessing the last option.

Shane respopnded:

Correct and correct. I also find it obvious (that it is WWWW or LLLL), but I swear I asked 60 people (including some statisticians) and only 3 have responded correctly.

The popularity of options and their actual incidence is almost perfectly negatively correlated.

The point of these examples is not that they're super-challenging math or probability problems; rather, it can be interesting to see where people's intuitions can go wrong.

Another reason to hate on prediction markets

Louis Mittel points us to this news article with headline:

Gamblers trying to win a bet on Polymarket are vowing to kill me if I don’t rewrite an Iran missile story

Bettors are using death threats to try to get The Times of Israel’s military correspondent to change his report on a missile impact in central Israel. This is his alarming account.

Mittel writes:

A lot of recent coverage of problematic aspects of prediction markets: the ethics of betting on war and death, ambiguous contracts (“was Khamenei out by March 1?”), insider trading, etc.

One of the weirder issues not covered is how prediction marketss turn ordinary people into de facto umpires, but without the security or pay MLB gives its umpires.

A previously routine call at the National Weather Service can now swing hundreds of thousands of dollars and piss off hundreds of gamblers. Or as in the article: missile strike or interception might hinge on a reporter updating a story or not.

These people never signed up to be umpires. They aren’t paid by Kalshi or Polymarket and never agreed to the role.

Here’s the news story:

Tuesday, I [journalist Emanuel Fabian] received an unusual email, in Hebrew, from someone named Aviv.

“Regarding your Times of Israel report that described today’s launch as an ‘impact’ — Beit Shemesh Municipality and MDA (Magen David Adom) later corrected their reports to clarify that what fell was an interceptor fragment, not a full missile,” he claimed.

“I’d appreciate it if you could update your article, as in its current form it does not reflect reality. Alternatively, if you have information that it was indeed a full missile that was not intercepted, I would be glad to be corrected.”

I told Aviv that, from what I know from the Israeli military, the impact outside Beit Shemesh was indeed a missile warhead and not just fragments. . . .

A day later, on Wednesday, I received another email, also in Hebrew, regarding the impact just outside Beit Shemesh, from someone identifying themselves as Daniel.

“Sorry for reaching out without a prior introduction, but I assume we will get to know each other well,” he wrote, in a somewhat threatening manner.

“I have an urgent request regarding the accuracy of your report on the missile attack on March 10. I would really appreciate a response if possible. There is an inaccurate report from you about the missile attack on March 10, and it’s causing a chain of errors,” Daniel’s email continued. . . .

By Thursday morning, Daniel had sent me another email. . . . “I ask again, if you could handle this as soon as possible, it would help us a lot. It’s really important, if possible, still this morning,” Daniel demanded. . . .

As far as I now understand, the emails I received were intended to confirm whether or not a missile had hit Israel on March 10 in order to resolve a prediction on Polymarket. . . .

Polymarket is one of the largest prediction markets in the world, where users can wager their money on the likelihood of future events, using cryptocurrency, debit or credit cards, and bank transfers. However, there are accusations that the site has been plagued by manipulation and insider trading.

The event that these people had bet on was “Iran strikes Israel on…?” More than 14 million dollars had been wagered on March 10.

The rules of the bet state: “This market will resolve to ‘Yes’ if Iran initiates a drone, missile, or air strike on Israel’s soil on the listed date in Israel Time (GMT+2). Otherwise, this market will resolve to ‘No’.”

However, there is a clause: “Missiles or drones that are intercepted… will not be sufficient for a ‘Yes’ resolution, regardless of whether they land on Israeli territory or cause damage.”

My minor report on a missile striking an open area was now in the middle of a betting war, with those who had bet “No” on an Iranian strike on Israel on March 10 demanding I change my article to ensure they would win big. . . .

This is already pretty creepy (kind of like this related story) but it gets worse:

More emails arrived in my [Fabian’s] inbox.

“When will you update the article?” one was titled. The email had no text content, only an image — a screenshot of my initial interaction with Daniel.

Except it did not show my actual response to Daniel, but a fabricated message that I had not written.

“Hi Daniel, Thank you for noticing, I checked with the IDF Spokesperson and it was indeed intercepted. I sent it now for editing, it will be fixed shortly,” I supposedly wrote. (To be clear, I wrote no such thing.) . . .

By this point, it was clear to me why these people were asking about the missile impact, and I took to X and told the gamblers to get a better hobby.

This did not stop them.

Shortly after midnight between Saturday and Sunday, I started to receive threatening messages in Hebrew on WhatsApp from someone called Haim. . . . “Despite the fact that you received countless inquiries — you insist on leaving it that way.”

“If you do not correct this by 01:00 Israel time today, March 15, you are bringing upon yourself damage you have never imagined you would suffer,” he threatened, in a very lengthy message. . . .

On Sunday morning, he messaged me again. . . . Hours later, more messages . . . I then received a WhatsApp message from another number, someone posing as a lawyer called Vered. I ignored the message. Then they called me, though the person on the other end sounded awfully like a young man, and not a middle-aged female lawyer.

Hey, that reminds me of this story!

Fabian continues:

I hung up and contacted the police. . . . Contacted by The Times of Israel later on Monday, Polymarket denounced the threats against me.

“Polymarket condemns the harassment and threats directed at Emanuel Fabian, or anyone else for that matter. This behavior violates our terms of service and has no place on our platform or anywhere else,” a spokesperson for the betting company said in a statement to ToI.

“Prediction markets depend on the integrity of independent reporting. Attempts to pressure journalists to alter their reporting undermine that integrity and undermine the markets themselves,” the spokesperson said.

He concludes:

The attempt by these gamblers to pressure me to change my reporting so that they would win their bet did not and will not succeed. But I do worry that other journalists may not be as ethical if they are promised some of the winnings.

An Israeli military reservist and a civilian were indicted last month for using classified information to place bets ahead of Israel’s war with Iran in June 2025. Similarly, journalists could easily exploit their knowledge for insider trading on the platform.

OK, I have a few thoughts on this:

1. Most obviously, I have a natural revulsion to people trying to make money by betting on war. Yeah, yeah, I know you can bet on oil futures or whatever, there can be legitimate reasons to hedge your financial risks, etc.–we discussed some of that here–but betting on people being killed as if it’s a sporting event? I say, leave that sort of thing to the ancient Romans.

2. I don’t know that the above story actually happened. I don’t have any reason to believe it didn’t happen, and I guess the Times of Israel is considered a legitimate news source; I’m just saying it’s something that was pointed to me on the internet, and sometimes these “outrage of the week” stories are fake, or at least exaggerated.

3. The bit about these guys threatening the reporter . . . I can picture it happening. From the reporter’s standpoint, this is a scary threat. But these guys could’ve been egging each other on, thinking how cool they are. On social media there are lots of pranks and celebration of violence, and I can see how a group of young guys would want to get into the action, work themselves into a fury, and have an adventure.

When I was in high school, kids would do things like spray paint “KKK” on the wall. They wanted to live on the edge. Nowadays the edgelords are in control (perhaps to the concern of some former edgelords).

I guess the question is: what would have happened if you’d dropped instant news and instant gambling into the world of 50 years ago, back when gambling was something to be embarrassed about, and back when impersonating people on the phone was something that high school kids would do for fun, not associated with death threats?

I guess that, had instant news and instant gambling technology been inserted into the world of 1976, it would’ve been highly regulated. Also money was less liquid so it would’ve been harder to lose it so fast.

Even back in 1976, there was Vegas, there were gambling addicts, there were high rollers, there were people who dissipated their income into lottery tickets or lost big in the neighborhood poker game . . . but it was a smaller corner of the economy, a sort of “red-light district” within the larger society. I’m guessing that, had modern gambling technology suddenly been introduced fifty years ago, that it would’ve been restricted to that red-light district.

Just for example, Pete Rose threw away much of his life in plain old analog gambling, and he ended up involved with dangerous mobsters. The point is, these mobsters mostly stayed in the red-light district. What’s happening now is scary because they’re out on the loose.

And, yeah, prediction markets are cool and can provide social value, I agree with that. They may even be the wave of the future. But something can be cool and also dangerous.

P.S. Further thoughts here from columnist Matt Levine.

And Palko points to this post from Steve Herman, “Betting and Prediction Market Alliances Erode Journalistic Integrity.” In the bio, it says that Herman “began his career in Las Vegas, reporting on the casino industry and organized crime.” So very relevant to our topic here.

Ted Williams and Me

This post is by Phil Price, not Andrew.

Every spring, my friend Sam and I work on a consulting project together. The project is a program evaluation: the State of California requires the company (our client) to hire a disinterested firm (that’s us) to evaluate the effectiveness of one of the company’s programs.

In previous years, the program has been a big part of the client’s revenue and they’ve cared a lot about the answers. But the client has expanded nationwide over the past year, they’ve got contracts with a lot more companies in a lot of states, and this particular program is suddenly (really suddenly!) only a small part of their business… so small, as a percentage, that they pretty much don’t care about the numbers we get this year, as they said (politely) in a phone call. The analysis has a lot of required elements that are kind of a hassle for the client and it wouldn’t surprise me if they don’t participate in this program at all next year.

Still, we were on the hook for the report so Sam and I worked on it just as we always do.

With a couple of days to go before our deadline for submitting the report, we were on Slack on a Saturday afternoon hashing out a few things. We had this exchange:

Me: I get it that they don’t want or need to mess with this nonsense anymore, I’m happy for them and that’s good news for the industry in general. But it’s not a great feeling that the client doesn’t care about our work!   There’s a moderately famous John Updike piece about the retirement of Ted Williams, in which he says “For me, Williams is the classic ballplayer of the game on a hot August weekday, before a small crowd, when the only thing at stake is the tissue-thin difference between a thing done well and a thing done ill.” 
  
Sam: So you are Ted Williams in this scenario?

Me: You and me both. I mean, why are we both doing our best (or something approximating our best) when nobody else cares?

Sam: Gotta have standards and as an independent consultant, standards/reputation are about all that matters. I think it comes from internal compass, but that in turn means we can do this type of work successfully. To answer your question, like Ted Williams, I think we are both worried about personally being associated with deficient work.


There’s no particular message here, I just have the impression that there are a few people who follow this blog who appreciate hearing stories from the world of statistical consulting every now and then.

This post is by Phil

Olympic memories

From 2024:

Here’s my suggestion for next time: After all the events are over and the medals have been given out, do a series of events with the medal winner of sport A, competing against the medal winner of sport B, doing sport C. With A, B, C drawn out of a hat. So we could see a ping-pong champion vs. a wrestler in a diving event. Etc. This would be so cool!

From 2023:

After we got back, people would ask what we had seen at the Olympics. I would say “We saw Usain Bolt run the 200m, we saw the women’s 4x100m relay and the men’s 4×400, we saw the last events of the decathlon…lots of great stuff. But my favorite was the men’s 800m.” . . .

From 2021:

Tokyo Track revisited: no, I don’t think the track surface is “1-2% faster”

From 2013:

How fast do we slow down? . . . For each doubling of distance, the world record time is multiplied by about 2.15. . . . for sprints of 200 meters to 1,000 meters, a doubling of distance corresponds to an increase of a factor of 2.3 in world record running times; for longer distances from 1,000 meters to the marathon, a doubling of distance increases the time by a factor of 2.1. . . . similar patterns for men and women, and for swimming as well as running.

From 2012:

I suppose it’s too late to add Turing’s run-around-the-house-chess to the 2012 London Olympics?

From 2010:

The Whiter Olympics. . . . And they’re not talkin bout the snow, either. . . .

Did you know that Puerto Rico had a Winter Olympics team? One year it featured my cousin Bill, who finished last in the slalom. I’m pretty sure he wasn’t born in Puerto Rico (despite what it says on one website), but I guess he’s probably been there on vacation on occasion. And I wouldn’t be surprised if he speaks Spanish–he does live in L.A., after all. And, of course, it takes some skill to finish last in the slalom. I’d probably fall off the chairlift and never even get to the starting line.

From 2006:

The overseers of international figure skating scoring instituted a new system in 2004, designed to reduce the chances of vote fixing or undue bias after the scandal during the Winter Olympics in Salt Lake City in 2002. Under the old rules eight known national judges scored a program up to six points with the highest and lowest scores dropped. Under the new rules, 12 anonymous judges score a program on a 10-point scale. A computer then randomly selects nine of the 12 judges to contribute to the final score. The highest and lowest individual scores in each of the five judging categories are then dropped and the remaining scores averaged and totaled to produce the final result. . . .

From 1945:

If you wanted to add to the vast fund of ill-will existing in the world at this moment, you could hardly do it better than by a series of football matches between Jews and Arabs, Germans and Czechs, Indians and British, Russians and Poles, and Italians and Jugoslavs, each match to be watched by a mixed audience of 100,000 spectators. I do not, of course, suggest that sport is one of the main causes of international rivalry; big-scale sport is itself, I think, merely another effect of the causes that have produced nationalism. Still, you do make things worse by sending forth a team of eleven men, labelled as national champions, to do battle against some rival team, and allowing it to be felt on all sides that whichever nation is defeated will “lose face”.

Meanwhile, tug-of-warriors haven’t been allowed into the five-ringed halls since 1920.

1 quick tip to improving student participation in your class (motivated by a principle in poker)

There’s a principle in poker that success is determined not so much by successful bluffs or close calls, but (a) the ability to fold a losing hand before it’s too late, and (b) the ability to get the most out of your best opportunities. The most important thing is not just to win with your good hands, but, when you win, to win big. To put it another way, success requires not being satisfied with small victories. The real pressure comes not when you have a mediocre hand and you’re agonizing over whether to stay in, but when you have the nuts and you’re trying to maximize your gain.

I was thinking about this the other day after having a conversation with a small group of students about how I could get more participation in class. As with many teachers, I often have difficulty getting students to speak up in the classroom. My main trick is to have students work in pairs, and there are a few other things I do—-for more on this, see chapter 1 of Active Statistics—-and it kinda works in that students do stay busy and focused in class, but we still don’t get the sort of lively discussions I’d like to see.

But this latest conversation in my office gave me an idea. In this mini-brainstorming session, different students in the group had suggestions, and I responded to each. And then I suddenly realized a pattern: after every student spoke, I responded. That’s natural: they’re talking to me, also they’re talking on a topic I’ve thought a lot about before, so when they say something, it’s natural that I’ll have immediate followup thoughts. Indeed, new ideas will typically come to me even before the other person has stopped talking. Also, that’s how conversation usually goes: someone will speak, I’ll reply, they’ll respond, etc.

But in roomful of students, if I do what seems natural and follow up each student’s question with my response, this takes away much of the life of the discussion. What I need to do, when student A speaks, is to just say nothing, or maybe make a brief nod of acknowledgment, to give the opportunity for students B, C, and D to join in. As it is, I’ve implicitly trained them to wait for my response, and that’s not good.

OK, this won’t always work, especially not at first. I’m waiting for class participation and, if I’m lucky, one student will speak up and say something, and that’s it. At that point it can help for me to keep the conversation going. But when students show some interest, when multiple students are leaning forward, ready to jump in, that’s the time for me to be careful and keep the student involvement going. In poker terms, this is the chance for a big win, and it’s important to do things right.

To put it another way, rather than getting frustrated at the times that I feel students should be participating but they’re not, I should just be willing to “fold” in such settings. My extra effort should be going into facilitating active participation in those settings where I’m holding some good cards, as it were, and students are ready to join in.

I’ll try this in future classes. I doubt it will work all at once–sometimes you just have to wait until you get a good hand–but I’ll try to remain aware of the possibility and take advantage when it happens.

The Mets are hiring

Sam Saskin writes:

I’m reaching out because we are hiring for a couple of jobs on the Mets analytics team and I was wondering if you’d be willing to share the job postings on your blog. The two positions (posting links below) are Senior Data Scientist, which would be a match for anyone looking for a full-time position, and Data Science Intern, which would be a match for current students (either undergraduate or graduate) who would be interested in spending a summer working with our team. I really appreciate the assistance, as we’ve had a lot of luck finding great candidates through visibility on your blog in the past.

Also if you have a 100 mph fastball they might be able to find a place for you somewhere in the organization.

How much of an NBA team’s won-loss record is from skill and how much is luck?

Paul Campos reminds us that just two years ago the Detroit Pistons were in the middle of a historic 28-game losing streak on the way to a 14-68 record (following up previous records of 17-65, 23-59, 20-50, and 20-46, so it’s not like that was much of an aberration), but now they’re leading the Eastern Conference with a 24-6 record, even though “The core talent group on that historically bad team still makes up the core talent of the present Detroit team, exactly two years later: Cade Cunningham, Jalen Duren, Ausar Thompson, Jaden Ivy, and Isaiah Stewart.”

Campos continues:

How did this happen? The answer is that all these players were extremely young two years ago: Cunningham and Stewart were 22, Ivy and Thompson were 21, and Duren was 20. Each of them has taken a huge leap forward in the subsequent two years . . .

I don’t know enough about basketball, and I haven’t been following the NBA at all lately, so I can’t comment on Campos’s judgment of the Pistons situation.

But in his post he also links to this old post of mine that I’d completely forgotten!, where I did a bunch of analysis to estimate how much information we get from 30 games in a season, compared to the information available from preseason betting odds.

I enjoy these posts where we go into the data and crunch through the R, and I know many of you like them too, so I thought I’d repeat it for you today for your holiday reading.

So here goes, from Christmas 2023:

Paul Campos points us to this discussion of the record of the Detroit professional basketball team:

The Detroit Pistons broke the NBA record for most consecutive losses in a season last night, with their 27th loss in a row. . . . A team’s record is, roughly speaking, a function of two factors:

(1) The team’s quality. By “quality” I mean everything about the team”s performance that isn’t an outcome of random factors, aka luck — the ability of the players, individually and collectively, the quality of the coaching, and the quality of the team’s management, for example.

(2) Random factors, aka luck.

The above-linked post continues:

How do we disentangle the relative importance of these two factors when evaluating a team’s performance to some point in the season? . . . The best predictor ex ante of team performance is the evaluation of people who gamble on that performance. I realize that occasionally gambling odds include significant inefficiencies, in the form of the betting public making sentimental rather than coldly rational wagers, but this is very much the exception rather than the rule. . . . the even money over/under for Detroit’s eventual winning percentage this season was, before the first game was played, a winning percentage of .340. To this point, a little more than third of the way through the season, Detroit’s winning percentage has been .0666. . . .

To the extent that the team has had unusually bad luck, then one would expect the team’s final record to be better. But how much better? Here we can again turn to the savants of Las Vegas et. al., who currently set the even money odds of the team’s final record on the basis of the assumption that it will have a .170 winning percentage in its remaining games.

Part of the confusion here is that we’re dealing with inference for p (the team’s “quality,” as summarized by the probability that they’d win against a randomly-chosen opponent on a random day) and also with predictions of outcomes. For the posterior mean, there’s no difference: under the basic model, the posterior expected proportion of future games won is equal to the posterior mean of p. It gets trickier when we talk about uncertainty in p.

How, then, could we take the beginning-of-season and current betting lines–which we will, for the purposes of our discussion here, identify as the prior and posterior means of p, ignoring systematic biases of bettor–and extract implied prior and posterior distributions? There’s surely enough information here to do this, if we use information from all 30 teams and calibrate properly.

Exploratory analysis

I started by going to the internet, finding various sources on betting odds, team records, and score differentials, and entering the data into this file. The latest Vegas odds I could find on season records were from 19 Dec; everything else came from 27 Dec.

Next step was to make some graphs. First, I looked at point differential and team records so far:

nba <- read.table("nba2023.txt", header=TRUE, skip=1)
nba$ppg <- nba$avg_points
nba$ppg_a <- nba$avg_points_opponent
nba$ppg_diff <- nba$ppg - nba$ppg_a
nba$record <- nba$win_fraction
nba$start_odds <- nba$over_under_beginning/82
nba$dec_odds <- nba$over_under_as_of_dec/82
nba$sched <- - (nba$schedule_strength - mean(nba$schedule_strength)) # signed so that positive value implies a more difficult schedule so far in season
nba$future_odds <- (82*nba$dec_odds - 30*nba$record)/52

pdf("nba2023_1.pdf", height=3.5, width=10)
par(mfrow=c(1,2), oma=c(0,0,2,0))
par(mar=c(3,3,1,1), mgp=c(1.5,.5,0), tck=-.01)
#
par(pty="s")
rng <- range(nba$ppg_a, nba$ppg)
plot(rng, rng, xlab="Points per game allowed", ylab="Points per game scored", bty="l", type="n")
abline(0, 1, lwd=.5, col="gray")
text(nba$ppg_a, nba$ppg, nba$team, col="blue")
#
par(pty="m")
plot(nba$ppg_diff, nba$record, xlab="Point differential", ylab="Won/lost record so far", bty="l", type="n")
text(nba$ppg_diff, nba$record, nba$team, col="blue")
#
mtext("Points per game and won-lost record as of 27 Dec", line=.5, side=3, outer=TRUE)
dev.off()

Here's a question you should always ask yourself: What do you expect to see?

Before performing any statistical analysis it's good practice to anticipate the results. So what do you think these graphs will look like?
- Ppg scored vs. ppg allowed. What do you expect to see? Before making the graph, I could have imagined it going either way: you might expect a negative correlation, with some teams doing the run-and-gun and others the physical game, or you might expect a positive correlation, because some teams are just much better than others. My impression is that team styles don't vary as much as they used to, so I was guessing a positive correlation.
- Won/lost record vs. point differential. What do you expect to see? Before making the graph, I was expecting a high correlation. Indeed, if I could only use one of these two metrics to estimate a team's ability, I'd be inclined to use point differential.

Aaaand, here's what we found:

Hey, my intuition worked on these! It would be interesting to see data from other years to see if I just got lucky with that first one.

Which is a better predictor of won-loss record: ppg scored or ppg allowed?

OK, this is a slight distraction from Campos's question, but now I'm wondering, which is a better predictor of won-loss record: ppg scored or ppg allowed? From basic principles I'm guessing they're about equally good.

Let's do a couple of graphs:

pdf("nba2023_2.pdf", height=3.5, width=10)
par(mfrow=c(1,3), oma=c(0,0,2,0))
par(mar=c(3,3,1,1), mgp=c(1.5,.5,0), tck=-.01)
#
par(pty="m")
rng <- range(nba$ppg_a, nba$ppg)
plot(rng, range(nba$record), xlab="Points per game scored", ylab="Won/lost record so far", bty="l", type="n")
abline(0, 1, lwd=.5, col="gray")
text(nba$ppg, nba$record, nba$team, col="blue")
#
par(pty="m")
plot(rng, range(nba$record), xlab="Points per game allowed", ylab="Won/lost record so far", bty="l", type="n")
abline(0, 1, lwd=.5, col="gray")
text(nba$ppg_a, nba$record, nba$team, col="blue")
#
par(pty="m")
plot(range(nba$ppg_diff), range(nba$record), xlab="Avg score differential", ylab="Won/lost record so far", bty="l", type="n")
abline(0, 1, lwd=.5, col="gray")
text(nba$ppg_diff, nba$record, nba$team, col="blue")
#
mtext("Predicting won-loss record from ppg, ppg allowed, and differential", line=.5, side=3, outer=TRUE)
dev.off()

Which yields:

So, about what we expected. To round it out, let's try some regressions:

library("rstanarm")
print(stan_glm(record ~ ppg, data=nba, refresh=0), digits=3)
print(stan_glm(record ~ ppg_a, data=nba, refresh=0), digits=3)
print(stan_glm(record ~ ppg + ppg_a, data=nba, refresh=0), digits=3)

The results:

            Median MAD_SD
(Intercept) -1.848  0.727
ppg          0.020  0.006

Auxiliary parameter(s):
      Median MAD_SD
sigma 0.162  0.021 
------
            Median MAD_SD
(Intercept)  3.192  0.597
ppg_a       -0.023  0.005

Auxiliary parameter(s):
      Median MAD_SD
sigma 0.146  0.019 
------
            Median MAD_SD
(Intercept)  0.691  0.335
ppg          0.029  0.002
ppg_a       -0.030  0.002

Auxiliary parameter(s):
      Median MAD_SD
sigma 0.061  0.008

So, yeah, points scored and points allowed are about equal as predictors of won-loss record. Given that, it makes sense to recode as ppg differential and total points:

print(stan_glm(record ~ ppg_diff + I(ppg + ppg_a), data=nba, refresh=0), digits=3)

Here's what we get:

               Median MAD_SD
(Intercept)     0.695  0.346
ppg_diff        0.029  0.002
I(ppg + ppg_a) -0.001  0.001

Auxiliary parameter(s):
      Median MAD_SD
sigma 0.062  0.009

Check. Once we include ppg_diff as a predictor, the average total points doesn't do much of anything. Again, it would be good to check with data from other seasons, as 30 games per team does not supply much of a sample.

Now on to the betting lines

Let's now include the Vegas over-unders in our analysis. First, some graphs:

pdf("nba2023_3.pdf", height=3.5, width=10)
par(mfrow=c(1,3), oma=c(0,0,2,0))
par(mar=c(3,3,1,1), mgp=c(1.5,.5,0), tck=-.01)
#
par(pty="s")
rng <- range(nba$start_odds, nba$record)
plot(rng, rng, xlab="Betting line at start", ylab="Won/lost record so far", bty="l", type="n")
abline(0, 1, lwd=.5, col="gray")
text(nba$start_odds, nba$record, nba$team, col="blue")
#
par(pty="s")
rng <- range(nba$record, nba$dec_odds)
plot(rng, rng, xlab="Won/lost record so far", ylab="Betting line in Dec", bty="l", type="n")
abline(0, 1, lwd=.5, col="gray")
text(nba$record, nba$dec_odds, nba$team, col="blue")
#
par(pty="s")
rng <- range(nba$start_odds, nba$dec_odds)
plot(rng, rng, xlab="Betting line at start", ylab="Betting line in Dec", bty="l", type="n")
abline(0, 1, lwd=.5, col="gray")
text(nba$start_odds, nba$dec_odds, nba$team, col="blue")
#
mtext("Won-lost record and over-under at start and in Dec", line=.5, side=3, outer=TRUE)
dev.off()

Which yields:

Oops--I forgot to make some predictions before looking. In any case, the first graph is kinda surprising. You'd expect to see an approximate pattern of E(y|x) = x, and we do see that--but not at the low end. The teams that were predicted to do the worst this year are doing even worse than expected. It would be interesting to see the corresponding graph for earlier years. My guess is that this year is special, not only in the worst teams doing so bad, but in them underperforming their low expectations.

The second graph is as one might anticipate: Betters are predicting some regression toward the mean. Not much, though! And the third graph doesn't tell us much beyond the first graph.

Upon reflection, I'm finding the second graph difficult to interpret. The trouble is that "Betting line in Dec" is the forecast win percentage for the year, but 30/82 of that is the existing win percentage. (OK, not every team has played exactly 30 games, but close enough.) What I want to do is just look at the forecast for their win percentage for the rest of the season:

pdf("nba2023_4.pdf", height=3.5, width=10)
par(mfrow=c(1,3), oma=c(0,0,2,0))
par(mar=c(3,3,1,1), mgp=c(1.5,.5,0), tck=-.01)
#
par(pty="s")
rng <- range(nba$record, nba$dec_odds)
plot(rng, rng, xlab="Won/lost record so far", ylab="Betting line of record for rest of season", bty="l", type="n")
abline(0, 1, lwd=.5, col="gray")
fit <- coef(stan_glm(future_odds ~ record, data=nba, refresh=0))
print(fit)
abline(fit, lwd=.5, col="blue")
text(nba$record, nba$future_odds, nba$team, col="blue")
#
dev.off()

Here's the graph:

The fitted regression line has a slope of 0.66:

            Median MAD_SD
(Intercept) 0.17   0.03  
record      0.66   0.05  

Auxiliary parameter(s):
      Median MAD_SD
sigma 0.05   0.01 

Next step is to predict the Vegas prediction for the rest of the season given the initial prediction and the team's record so far:

print(stan_glm(future_odds ~ start_odds + record, data=nba, refresh=0), digits=2)

            Median MAD_SD
(Intercept) -0.02   0.03 
start_odds   0.66   0.10 
record       0.37   0.06 

Auxiliary parameter(s):
      Median MAD_SD
sigma 0.03   0.00  

It's funny--everywhere we look, we see this 0.66. And 30 games is 37% of the season!

Now let's add into the regression the points-per-game differential, as this should include additional information beyond what was in the won-loss so far:

print(stan_glm(future_odds ~ start_odds + record + ppg_diff, data=nba, refresh=0), digits=2)

            Median MAD_SD
(Intercept) 0.06   0.06  
start_odds  0.67   0.09  
record      0.20   0.11  
ppg_diff    0.01   0.00  

Auxiliary parameter(s):
      Median MAD_SD
sigma 0.03   0.00 

Hard to interpret this one, as ppg_diff is on a different scale from the rest. Let's quickly standardize it to be on the same scale as the won-lost record so far:

nba$ppg_diff_std <- nba$ppg_diff * sd(nba$ppg_record) / sd(nba$ppg_diff)
print(stan_glm(future_odds ~ start_odds + record + ppg_diff_std, data=nba, refresh=0), digits=2)

             Median MAD_SD
(Intercept)  0.06   0.06  
start_odds   0.67   0.09  
record       0.20   0.11  
ppg_diff_std 0.17   0.10  

Auxiliary parameter(s):
      Median MAD_SD
sigma 0.03   0.00  

OK, not enough data to cleanly disentangle won-lost record and point differential as predictors here. My intuition would be that, once you have point differential, the won-lost record tells you very little about what will happen in the future, and the above fitted model is consistent with that intuition, but it's also consistent with the two predictors being equally important, indeed it's consistent with point differential being irrelevant conditional on won-lost record.

What we'd want to do here--and I know I'm repeating myself--is to repeat the analysis using data from previous years.

Interpreting the implied Vegas prediction for the rest of the season as an approximate weighted average of the preseason prediction and the current won-lost record

In any case, the weighting seems clear: approx two-thirds from starting odds and one-third from the record so far, which at least on a naive level seems reasonable, given that the season is about one-third over.

Just for laffs, we can also throw in difficulty of schedule, as that could alter our interpretation of the teams' records so far.

nba$sched_std <- nba$sched * sd(nba$record) / sd(nba$sched)
print(stan_glm(future_odds ~ start_odds + record + ppg_diff_std + sched_std, data=nba, refresh=0), digits=2)

             Median MAD_SD
(Intercept)  0.06   0.06  
start_odds   0.68   0.09  
record       0.21   0.11  
ppg_diff_std 0.17   0.10  
sched_std    0.04   0.03 

So, strength of schedule does not supply much information. This makes sense, given that 30 games is enough for the teams' schedules to mostly average out.

The residuals

Now that I've fit the regression, I'm curious about the residuals. Let's look:

fit_5 <- stan_glm(future_odds ~ start_odds + record + ppg_diff_std + sched_std, data=nba, refresh=0)
fitted_5 <- fitted(fit_5)
resid_5 <- resid(fit_5)
#
pdf("nba2023_5.pdf", height=5, width=8)
par(mar=c(3,3,1,1), mgp=c(1.5,.5,0), tck=-.01)
#
par(pty="m")
plot(fitted_5, resid_5, xlab="Vegas prediction of rest-of-season record", ylab="Residual from fitted model", bty="l", type="n")
abline(0, 0, lwd=.5, col="gray")
text(fitted_5, resid_5, nba$team, col="blue")
#
dev.off()

And here's the graph:

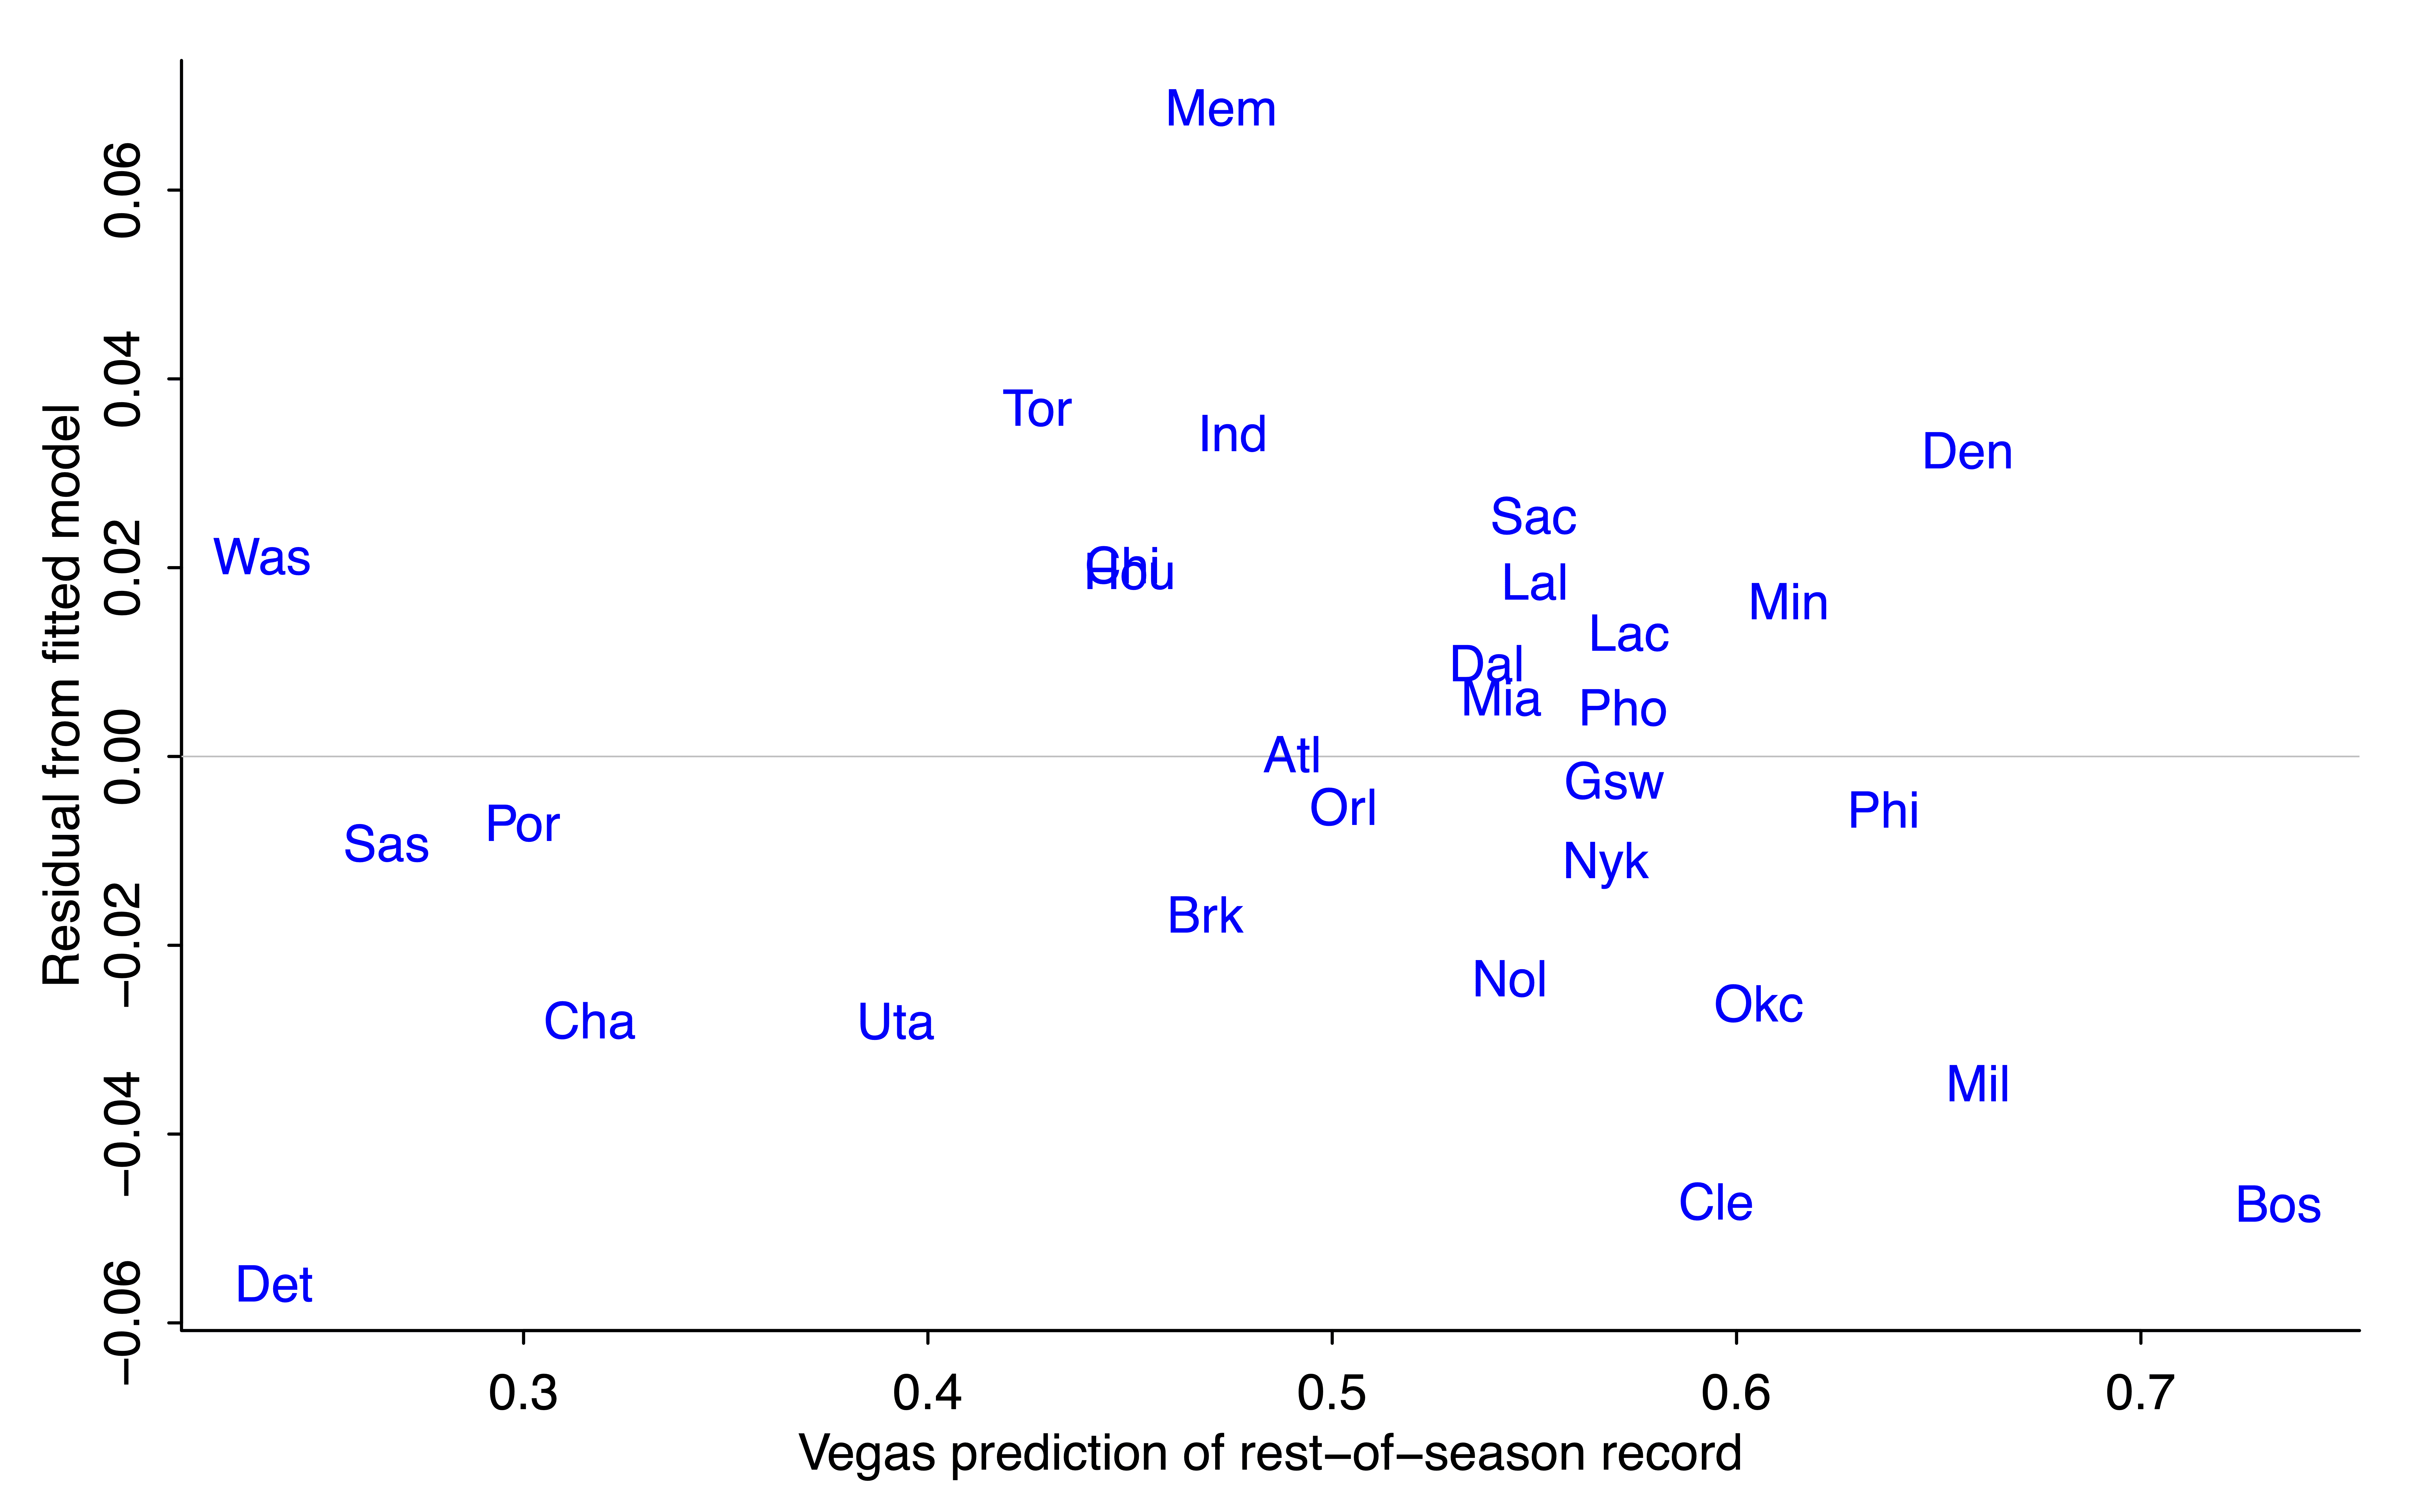
The residual for Detroit is negative (-0.05*52 = -2.6, so the Pistons are expected to win about 3 games less than their regression prediction based on prior odds and outcome of first 30 games). Cleveland and Boston are also expected to do a bit worse than the model would predict. On the other direction, Vegas is predicting that Memphis will win about 4 games more than predicted from the regression model.

I have no idea whassup with Memphis. The quick generic answer is that the regression model is crude, and bettors have other information not included in the regression.

Reverse engineering an implicit Bayesian prior

OK, now for the Bayesian analysis. As noted above, we aren't given a prior for team j's average win probability, p_j; we're just given a prior point estimate of each p_j.

But we can use the empirical prior-to-posterior transformation, along with the known likelihood function, under the simplifying assumption the 30 win-loss outcomes for each team j are independent with constant probability p_j for team j. This assumption that is obviously wrong, given that teams are playing each other, but let's just go with it here, recognizing that with full data it would be straightforward to extend to an item-response model with an ability parameter for each team (as here).

To continue, the above regression models show that the Vegas "posterior Bayesian" prediction of p_j after 30 games is approximately a weighted average of 0.65*(prior prediction) + 0.35*(data won-loss record). From basic Bayesian algebra (see, for example, chapter 2 of BDA), this tells us that the prior has about 65/35 as much information as data from 30 games. So, informationally, the prior is equivalent to the information from (65/35)*30 = 56 games, about two-thirds of a season worth of information.

Hey--what happened??

But, wait! That approximate 2/3 weighting for the prior and 1/3 weighting of the data from 30 games is the opposite of what Campos reported, which was a 1/3 weighting of the prior and 2/3 of the data. Recall: prior estimated win probability of 0.340, data win rate of 0.067, take (1/3)*0.340 + (2/3)*0.067 and you get 0.158, which isn't far from the implied posterior estimate of 0.170.

What happened here is that the Pistons are an unusual case, partly because the Vegas over-under for their season win record is a few percentage points lower than the linear model predicted, and partly because when the probability is low, a small percentage-point change in the probability corresponds to a big change in the implicit weights.

Again, it would be good to check all this with data from other years.

Skill and luck

There's one more loose end, and that's Campos taking the weights assigned to data and prior and characterizing them as "skill" and "luck" in prediction errors. I didn't follow that part of the reasoning at all so I'll just let it go for now. Part of the problem here is in one place Campos seems to be talking about skill and luck as contributors to the team's record, and in another place he seems to considering them as contributors to the difference between preseason predictions and actual outcomes.

One way to think about skill and luck in a way that makes sense to me is within an item-response-style model in which the game outcome is a stochastic function of team abilities and predictable factors. For example, in the model,

score differential = ability of home team - ability of away team + home-field advantage + error,

the team abilities are in the "skill" category and the error is in the "luck" category, and, ummm, I guess home-field advantage counts as "skill" too? OK, it's not so clear that the error in the model should all be called "luck." If a team plays better against a specific opponent by devising a specific offensive/defensive plan, that's skill, but it would pop up in the error term above.

In any case, once we've defined what is skill and what is luck, we can partition the variance of the total to assign percentages to each.

Another way of looking at this is to consider the extreme case of pure luck. If outcomes determined only by luck, then each game is a coin flip, and we'd see this in the data because the team win proportions after 30 games would follow a binomial distribution with n=30 and p=0.5. The actual team win proportions have mean 0.5 (of course) and sd 0.18, as compared to the theoretical mean of 0.5 and sd of 0.5/sqrt(30) = 0.09. That simple calculation suggests that skill is (0.18/0.09)^2 = 4 times as important as luck when determining the outcome of 30 games.

And maybe I'm getting just getting this all tangled myself. The first shot at any statistical analysis often will have some mix of errors in data, modeling, computing, and general understanding, with that last bit corresponding to the challenge of mapping from substantive concepts to mathematical and statistical models. Some mixture of skill and luck, I guess.

Summary

1. Data are king. In the immortal words of Hal Stern, the most important aspect of a statistical analysis is not what you do with the data, it’s what data you use. I could do more than Campos did, not so much because of my knowledge of Bayesian statistics but because I was using data from all 30 teams.

2. To continue with that point, you can do lots better than me by including data from other years.

3. Transparency is good. All my data and code are above. I might well have made some mistakes in my analyses, and, in any case, many loose ends remain.

4. Basketball isn't so important (hot hand aside). The idea of backing out an effective prior by looking at information updating, that's a more general idea worth studying further. This little example is a good entry point into the potential challenge of such studies.

5. Models can be useful, not just for prediction but also for understanding, as we saw for the problem of partitioning outcomes into skill and luck.

Everything I need to know I learned in Little League

This post is by Bob

“Little League” is what we call baseball for kids in the United States. I often tell people that I learned a ton about how to behave and how to approach problems, teamwork, and life in little league. Turns out I’ve been saying that for a while. My sister just sent me this little poster I made for my dad at some point.

Dad repeated this advice regularly, even decades after my baseball-playing days. I still believe it’s good advice, so I’m sharing.

I put the most important advice first—keep your eye on the ball. That’s really key to just about anything.

I have found that hustle is also really critical in life. Dad and I loved hustling baseball players like Pete Rose. Dad used to drive me from Detroit to Cincinnatti in the early 70s to see the Big Red Machine in person, then drive back for work the next day. I find it demoralizing today how players just watch their hits rather than hustling as soon as there’s contact. I really miss “little ball”, which is why Cleveland’s my favorite team (that and it’s Mitzi’s home town).

The staying loose part is also really important and really hard. No editor, so I included keeping your eye on the ball twice. Without the duplication, I could have saved enough space to not cramp the bottom—otherwise, my graphical layout’s pretty good.

For me, sportsmanship is really critical. I also makes me sad that players only shake hands with their own team after the end of the game. We always had to go and shake every other player’s hand and tell them “good game” (even if it wasn’t). And the pros did the same.

I can’t emphasize the teamwork advice enough for the real world—part of that should have said “there’s enough credit to go around.” I should have put that higher up. Listening to how star players respond to interviews is key—it’s usually along the lines of, “I’m just trying to play my role and help the other 8 guys out on the field.”

Getting in front of the ball is also super important not only literally in baseball, but also metaphorically in life. You can do so much by just getting in front of the ball. It might hurt a bit when it hits you if you can’t catch it cleanly, but at least it didn’t get by you! I might rephrase “throw overhand” as “take the straight ahead approach” rather than “trying to get fancy.”

As a bonus, my sister also sent along this photo of our Little League days in Detroit.

That’s dad in the back and me on the far left of the back row. This is 1972 or 1973, so I was 8 or 9 years old (top row, far left) and dad was only 29 or 30. At the time this was taken, he was paying his way through law school photographing sports teams and accident scenes (I tagged along to both and “helped” in the darkroom). I love the attention to detail in the arrangement of gloves on the first row and the classically crossed bats—I also learned photography and design from dad, not to mention printing. Also notice how poor the neighborhood was. One of my teammates, Adam (can’t recall his last name), is wearing dress shoes; you can’t see Tibor’s shoes in the back, but they were mostly duct tape. We couldn’t even afford new baseballs, so I’m not sure how dad managed the spiffy uniforms—probably shilling a pizza joint or auto body repair on the back.


EVERYTHING I NEED TO KNOW I LEARNED IN LITTLE LEAGUE*

DAD ON THE GAME
keep your eye on the ball

DAD ON HUSTLE
run, don’t walk

DAD ON BATTING
stay loose, keep your shoulder down & keep your eye on the ball

DAD ON SPORTSMANSHIP
don’t be a bad loser & don’t be a bad winner; shake hands

DAD ON TEAMWORK
there are 8 other players to help you

DAD ON FIELDING
get in front of the ball & keep your eye on it

DAD ON THROWING
overhand, it goes straight

* FROM MY DAD [Mack L. Carpenter]

Who has the lowest Erdos-Bacon-Epstein number?

Lawrence Summers of course has an Epstein number of 1 (the lowest you can have while still being alive), but his Erdos number is a disappointing 6. I don’t know any easy way to calculate his Bacon number, but Summers does have an IMDB page . . . maybe the best connection will be through this documentary, Panic: The Untold Story of the 2008 Financial Crisis, which also includes Epstein friends Steve Bannon and Donald Trump. Bannon produced this documentary about Sarah Palin, featuring Pamela Anderson and Roseanne Barr. And this site gives Anderson a Bacon number of 2. So Summers’s Bacon number is no more than 4, thus his Erdos-Bacon-Epstein is at most 11. That’s stretching it, though, because the definition of Bacon number seems to require that all the people in the chain have acted in the movies. Being filmed as yourself (as with Summers) or being a producer (as with Bannon) doesn’t really count. So I guess Summers has an infinite Erdos-Bacon-Epstein number. Sorry, Larry! No Nobel Prize and no Bacon number. I guess you can forget about the EGOT too.

Here’s a possibility. Sergei Brin has an Erdos-Bacon number of 5, and in the Epstein files there’s this story:

I don’t know that Brin had any emails with the famed financier, but I think it’s fair to guess that his Epstein number is no more than 2, so his Erdos-Bacon-Epstein number is at most 7.

Also . . . it seems that Bill Gates has an Erdos-Bacon number of 6, and he was a known associate of Epstein, so he also has an Erdos-Bacon-Epstein number of 7.

What about me? I have an Erdos number of 3 and, sadly, an Epstein number of 2 (through this guy and this guy). But my Bacon number is infinity, as I’ve never participated in a movie. If they ever make a film of Recursion, maybe. Come to think of it, Kevin Bacon would make a great Bob Dwyer; I could see it working out.

The Erdos-Bacon-Epstein challenge is that you need a connection in academic publication, a connection in the movies, and an email link to Epstein. That last bit is the easiest: anyone can send an email, and I expect that just about everyone online has a fairly low Epstein number. My mom has an Epstein number of 3! Lots and lots of scientists and writers have Epstein numbers of 2 the same way that I do, if they’ve ever worked with or considered working with the notorious book agent John Brockman. I’m locked out regarding Bacon, and lots of other people have infinite Erdos numbers. Peter Thiel, for example, is an Epstein associate and has some IMBD credits but an infinite Erdos number. Similarly, Woody Allen has an Epstein number of 1 (I expect) and a Bacon number of 2 but no Erdos connection.

But here’s a thought: Stephen Hawking! Another Epstein associate–no email from or to him in the recently released files, but I think it’s safe to assign him an Epstein number of 1. His Bacon number is 2 and his Erdos number is a surprisingly high 4–I guess Hawking didn’t actually publish so many papers during his career–so his Erdos-Bacon-Epstein number is 7.

And . . . Noam Chomsky. He has an Erdos number of 4, a Bacon number of 2, and an Epstein number of 1, so a total of 7. And Noam is still active! With some effort maybe he could find the right collaborator and get his Erdos number down to 3 and have an Erdos-Bacon-Epstein number of 6.

But I’d give Noam an asterisk. I got his Bacon number of 2 from wikipedia, where it says he “co-starred with Danny Glover in the 2005 documentary The Peace!, giving him a Bacon number of 2.” But it seems that he was just a talking head in that movie, not acting, so I don’t know if that really counts.

Here’s an amusing bit from Noam’s IMDB page:

“Trivia” . . . that’s about right!

Any other possibilities? Going over to Epstein’s birthday book, we see some famous names with some academic connections, including Nathan “Albedo boy” Myhrvold and Henry “Harvard” Rosovsky. Both are on Google Scholar and no doubt have finite Erdos numbers, but neither seems to have acted in any movies. Myhrvold hosted some kind of cooking show but that doesn’t really count, sorry. Also some prominent-but-not-famous-scientists such as Gerald Edelman, Stephen Kosslyn, and Lee Smolin, but no IMDB acting credits among them. And my namesake Murray Gell-Mann. I hate to see that! But, again, no relevant screen time.

Epstein’s birthday book also has an entry from someone named “Ace Greenberg.” Hey, what is this, a Damon Runyon story?

Really you have to read that birthday book all the way through. There’s a letter from a “Johnny Boy” who says that Epstein is his kid’s role model. How creepy is that? What a horrible parent. I get that some people are seduced by money, sex, and power and thought that Epstein was cool because he had all three, but to bring your kind into that? Yuck! And Myhrvold’s charming collection of animals in sexual positions.

And then there’s Marvin Minsky, who writes that Epstein is the second-quickest intellect he’s ever met. Wha . . .? Either Minsky’s students and colleagues at MIT were a lot slower than I’d have pictured, or Epstein was much more impressive in person than I could possibly imagine based on anything in his emails, or the famous artificial intelligence pioneer was not such a good judge of intellectual quickness. I’m racking my brain here to think of whatever witticisms or quick replies or deep thoughts Epstein had to offer that would lead Minsky to this assessment. Then again, one of the greatest statisticians of the twentieth century said he really enjoyed meeting with Epstein . . . so I guess the man had some charm that just doesn’t come across on paper.

Also featured in the birthday book is Alan Dershowitz. He’s gotta be a contender here, right? An Epstein number of 1–indeed, given all his connections, he practically has an Epstein number of 0–and he has acting credits on IMDB! He’s in this Rob Lowe movie from 2012 with the amusing-in-retrospect tag line, “A political strategist juggling three clients questions whether or not to take the high road as the ugly side of his work begins to haunt him.”

Don’t worry–the Dersh would never take the low road!

Anyway, this movie also features David Harbour, who actually appeared in a movie with the prolific Kevin Bacon. So Dershowitz has an Epstein number of 1, a Bacon number of 2, and an Erdos number of . . . Let’s go to Google Scholar.

Here are the first three links:

In the first one, he says the death penalty should be abolished. In the second, he defends the use of torture. In the third . . . I haven’t read it, but I guess he thinks the death penalty and torture are ok if Israel does it? But this doesn’t get us any closer to Paul Erdos. We need to find some place where Dershowitz has coauthored with a scientist, or someone who would’ve coauthored with a scientist, etc. His papers are mostly solo authored, so it’s tough. Dershowitz was interviewed in the magazine Litigation by Ashish Joshi, who also interviewed judge Jed Rakoff, who wrote an article on eyewitness identification with neuroscientist Thomas Albright, who’s published lots of scientific papers and so surely has had some collaborators who have worked with mathematicians. I don’t know what Albright’s Erdos number is, but if it’s 5, then this would give Dershowitz an Erdos number of no more than 8, thus an Erdos-Bacon-Epstein total of 11. Not bad! Too bad he couldn’t get closer on the Erdos part of the game. It’s kind of like being a potential triathlete but barely being able to swim.

What Dershowitz should do is publish a paper with Steven Pinker! It would be easy. Pinker famously wrote up a linguistics argument in defense of Epstein as a favor for Dershowitz. Pinker knows his linguistics so I’m sure this would be publishable somewhere. Pinker has an Erdos number of 3 (just like me!), so this collaboration would make Dershowitz an Erdos 4, giving him a combined Erdos-Bacon-Epstein number of 7.

What about Pinker himself? Erdos 3, Epstein 1 (or maybe 2), but no IMDB acting credits, just some TV appearances as himself, so no dice.

Again, the hard part is finding people in Epstein’s orbit who have academic publications and acting credits. Some academics, some people in the entertainment industry, but not many with both. Bacon himself, for example, has no academic publications. (Nor does he have any direct connection to Epstein, but he may well have had email exchanges with Kevin Spacey or someone else in the Epstein orbit.) I don’t think Andrew Mountbatten-Windsor has any academic publications either. I guess he was too busy with his research to get around to writing any of it up.

But wait . . . here’s a dark-horse candidate. Looking again at the contributors to Epstein’s birthday book, we see a bunch of businessmen, some politicians and scientists, some girlfriends, and some names that I didn’t recognize at all, including someone named Stuart Pivar. Hmmm . . . according to wikipedia, there’s person with that name, born 1930, who’s a “chemist and art collector known for his unorthodox views about evolution.” That sounds like someone in Epstein’s circle, and, indeed, scroll down the wikipedia page and you’ll see the connection. And it says here that he found a Vincent van Gogh painting from a flea market or something like that! Pivar’s Epstein number is 1 (you get that by contributing to the birthday book) and . . . ummm, yes, he has an IMDB acting credit, having been one of many many people to have played the role of Socrates in the 2010 film, The Death of Socrates (writers are listed as “Plato, Benjamin Jowett, and Natasa Prosenc Stearns“) and featuring Ray Abruzzo, who has a Bacon number of 2. So the somewhat obscure (although not completely obscure, I guess, given that there have been magazine articles about the guy) Pivar is an Epstein 1, Bacon 3. What about his Erdos number? Pivar was a chemist. According to wikipedia, “As an inventor, he made a large fortune in plastics.” On Google scholar, we see this 2016 paper, “Origin of the vertebrate body plan via mechanically biased conservation of regular geometrical patterns in the structure of the blastula,” with David B. Edelman, Mark McMenamin, and Peter Sheesley. At this point, Pivar is considered a bit of a crank, so I doubt these coauthors are serious scientists themselves, but maybe we can follow some links and get to mainstream science, and there to mathematics, and there to Erdos. McMenamin has a Google Scholar page but it all seems pretty narrow . . . hmmm, there’s a paper, “Did surface temperatures constrain microbial evolution?”, with David Schwartzman and Tyler Volk. Schwartzman seems like a bit of a dead end, but Volk, in addition to publishing some cranky-looking things himself (“Gaia’s body: toward a physiology of Earth”) also published a speculative paper in Science with coauthors including earth scientist Klaus Lackner, who I saw speak at Columbia once! Lackner hung out sometimes with Upmanu Lall, who has published a paper with me, and I have an Erdos number of 3. If we suppose that there is a link connecting Lackner to Lall, this would give Pivar an Erdos number of no greater than 9.

But it’s hard to imagine that 9 is the best we can do for Pivar. Another route is through another of his collaborators on that paper, Edelman, who also wrote this article:

Ummmm, I’m skeptical. Evaluating a horserace prediction method based on only 300 races? C’mon. But, hey, all things are possible. Perhaps this Edelman fellow is now rolling in the dough. Maybe he owns a few Arabian thoroughbreds himself!

Edelman (not the Gerald mentioned earlier, unfortunately) also wrote a couple of papers on finance. That seems like a possible route to mathematics, and thus Erdos. There’s a paper with Patrick O’Sullivan on Adaptive Universal Profiles, but his links are all applied finance, no math happening here, also a book, Numerical Methods for Finance, with two coauthors, including a John Appelby who wrote some papers on differential equations . . . whatever. I give up on this one. It’s surprisingly difficult to navigate the publication network. It’s hard for me to believe that we can’t get Stuart Pivar‘s Erdos number below 9, but maybe that’s what it is. I’ll just tag Pivar with an Erdos-Bacon-Epstein number of 9 + 3 + 1 = 13.

Also, I don’t like Pivar. I’ve never met him, but he appears to be a liar. His wikipedia page says, “Pivar was also a well-known friend of the late financier Jeffrey Epstein; however, the two had a falling out prior to Epstein facing charges for sex crimes. Pivar corroborated the account of Maria Farmer, a graduate of the New York Academy of Art in 1995, who stated that she had informed him about her abuse at the hands of Epstein in 1996. According to Pivar, this was when the friendship with Epstein ended.”

But Pivar contributed to Epstein’s 50th birthday book. Birthdays seem to have been a big deal to Epstein; his sycophantic correspondents are always wishing him happy birthday. Anyway, Epstein was born in 1953, so his 50th birthday was in 2003, so unless Pivar wrote that tribute seven years ahead of time, he was lying when he said in 2019 that he’d ended his relationship with Epstein back in 1996.

Also this bizarre bit:

In August 2007, Pivar sued a science blogger named P. Z. Myers and Seed Media Group, which hosted his blog, alleging defamation. Myers had lit into Pivar’s work, calling him “a classic crackpot.” In his complaint, Pivar made a point of mentioning by name two prominent members of SMG’s board: Jeffrey Epstein and Ghislaine Maxwell. The lawsuit was later dropped.

Remember blogging? That used to be a thing.

And . . . the winner!

This is someone you’d never have expected. According to wikipedia, MIT mathematician Daniel Kleitman has an Erdos-Bacon number of 3. Kleitman was at MIT forever, so I bet he has some email exchanges with Chomsky or some other Epstein intimate, in which case his Erdos-Bacon-Epstein number would be 5.

I knew Kleitman! He was my freshman adviser at MIT. There was a group of about five of us, and we met with him in his office a few times. He was a nice guy, very blunt spoken–not in a crude way at all, just the kind of guy who would say something was bullshit. I told Kleitman I was interested in doing research, and he connected me with a graduate student, Susan Assmann, who gave me a project to work on. It took me a year to figure it out. I learned a lot from the experience; the story is here.

From a statistical point of view, the lesson here is that low Erdos and Bacon numbers are rare, so the best way to perform this search is not to start with Epstein associates but rather to take Erdos-Bacon champs and then go to Epstein from there. For example, mathematician Jordan Ellenberg has an Erdos-Bacon number of 5. I’ve emailed with Jordan, so his Epstein number is at most 3, giving him an Erdos-Bacon-Epstein upper bound of 8. But Jordan could well have been contacted by Brockman at some point, in which case he’d have a number of 7, tied with various other people listed above.

Does anyone in the world have an Erdos-Bacon number of 6? I don’t know.

What’s the point?

Why do all this? Why did I spend two precious hours of my time on earth tracking down these links and writing all this? Or, maybe more to the point, why did you read all this. (I’m conditioning here on whatever subset of our blog audience has who’ve read this far down on the post.)

The quick answer is that connections can be interesting. You can learn all sorts of unexpected things from this sort of quasi-stochastic search.

Another answer is that seeing these connections of various elite and not-so-elite people gives us some sense of the social world. It’s a core sample of part of American society.

The other interesting thing about the Epstein files is the content. Not the crude sexism: people will say all sorts of things in private, so this sort of thing is hardly shocking. If a cookbook writer / retired technology executive thought it was cute to talk about sex with one of his rich friends, so be it. The part that was more stunning to me was all these luminaries who seemed so impressed by Epstein. In addition to the aforementioned pioneers of statistics and computer science, you’ve got ultra-successful businessmen such as Gates, artists such as Andres “Piss Christ” Serrano, leading physicists (sorry, no Bacon number here; according to IMDB the closest she came was an uncredited role on a TV show, and I think that only movies count), etc.

I get it that lots of politicians got caught in a net: if you’re a politician, you pretty much can’t avoid getting close to lots of distasteful people. I’m not saying that it’s cool that Trump, Clinton, Richardson, Bannon, Thiel, etc. were friendly with Epstein, but it’s also not so clear what the alternative would be. If you’re in politics, you only have a limited number of times you can piss off powerful and well-connected people. But in academia and in business, you can do what you want most of the time. The idea that these people were choosing to hang out with Jeff, going to the trouble to wish him happy birthday . . . it’s just weird. Again, I think Epstein must have had a real ability to talk with lots of different people, making people as different as Bannon, Chomsky, Minsky, and Summers to all think he agreed with them. And that’s kind of interesting.

Finally, I laugh because otherwise I would cry. I joke about all this because that’s a way to deal with disturbing things. So many horrible things were done here with the complicity of business and academic leaders as well as state and national governments.