A few days ago we discussed some concerns with Fivethirtyeight’s election forecast. This got us thinking again about some concerns with our own forecast for The Economist (see here for more details).
Here are some of our concerns with our forecast:
1. Distribution of the tails of the national vote forecast
2. Uncertainties of state forecast depend only weakly on number of polls in the state
3. Maine and Nebraska
And here are our current thoughts.
1. Distribution of the tails of the national vote forecast
As of this writing, we’re giving Biden over a 99% chance of winning the popular vote and a 95% chance of winning the electoral college.
Are these numbers too close to 100%? Maybe. We’re already on record as saying that our model, based as it is on fundamentals and polls, is a forecast of vote intentions, not of votes as counted. And so if there is massive vote suppression or millions of votes thrown out or not counted at all, that’s not in our forecast.
Beyond that, unusual events happen in politics, and even if this particular possibility was not widely anticipated at the time we were constructing our forecast, it was known that other disrupting events could occur.
Our model estimates latent variables with normally-distributed error terms (on the logit scale). Maybe something like t_4 errors would make more sense. We looked into this when revising our model a few months ago (see the last full paragraph on the left column of page 868 of this article), but switching from normal to t_4 didn’t make much of a difference, either in our 2020 forecasts or our forecasts when backfitting our model to 2008, 2012, 2016. But that’s when we were giving Pr(Biden win) at around 85%. The closer the probability comes to 100%, the more important is the tail behavior. Now that it’s 95%, the rubber meets the road. When we had the choice of normal or t_4 and it didn’t make much difference, we chose to stay with the normal because it seemed simpler. In retrospect, I think we should’ve gone to the t_4 on the theory that we’d prefer it, if it did make a difference.
The funny thing is, we could’ve anticipated this a few months ago! The polls had been stable in support for Biden and we were anticipating further stability, so we could’ve simulated a few months of future data, then fit our model to that, and seen the uncertainty interval for Biden’s vote share gradually narrow until until losing was clearly outside the range.
Currently our 95% interval for Biden’s popular vote share is [51.5%, 57.5%]. A 50-50 tie is approximately 3 standard deviations from 0. Here’s some R:
> pnorm(3.0)
[1] 0.999
> pt(3, df=4)
[1] 0.980
There’s a big difference between 99.9% and 98%, and that’s what happens as you go out into the tail. Now, just to be clear, changing our internal error terms from normal to t_4 would not effect such a big change in our posterior distribution—our model has many moving parts, and the posterior distribution of the national vote share will not have any simple parametric form in any case—but the general point still holds, that choices in modeling that don’t have much effect most of the time can make a difference for events such as extreme tails where the data supply very little direct information.
2. Uncertainties of state forecast depend only weakly on number of polls in the state
Adam Pearce was inspired by our post to make some beautifully clear graphs showing various aspects of the Economist and Fivethirtyeight forecasts. His code is here and here.
Here are the state-by-state forecasts for the Economist (red curves) and Fivethirtyeight (black curves):
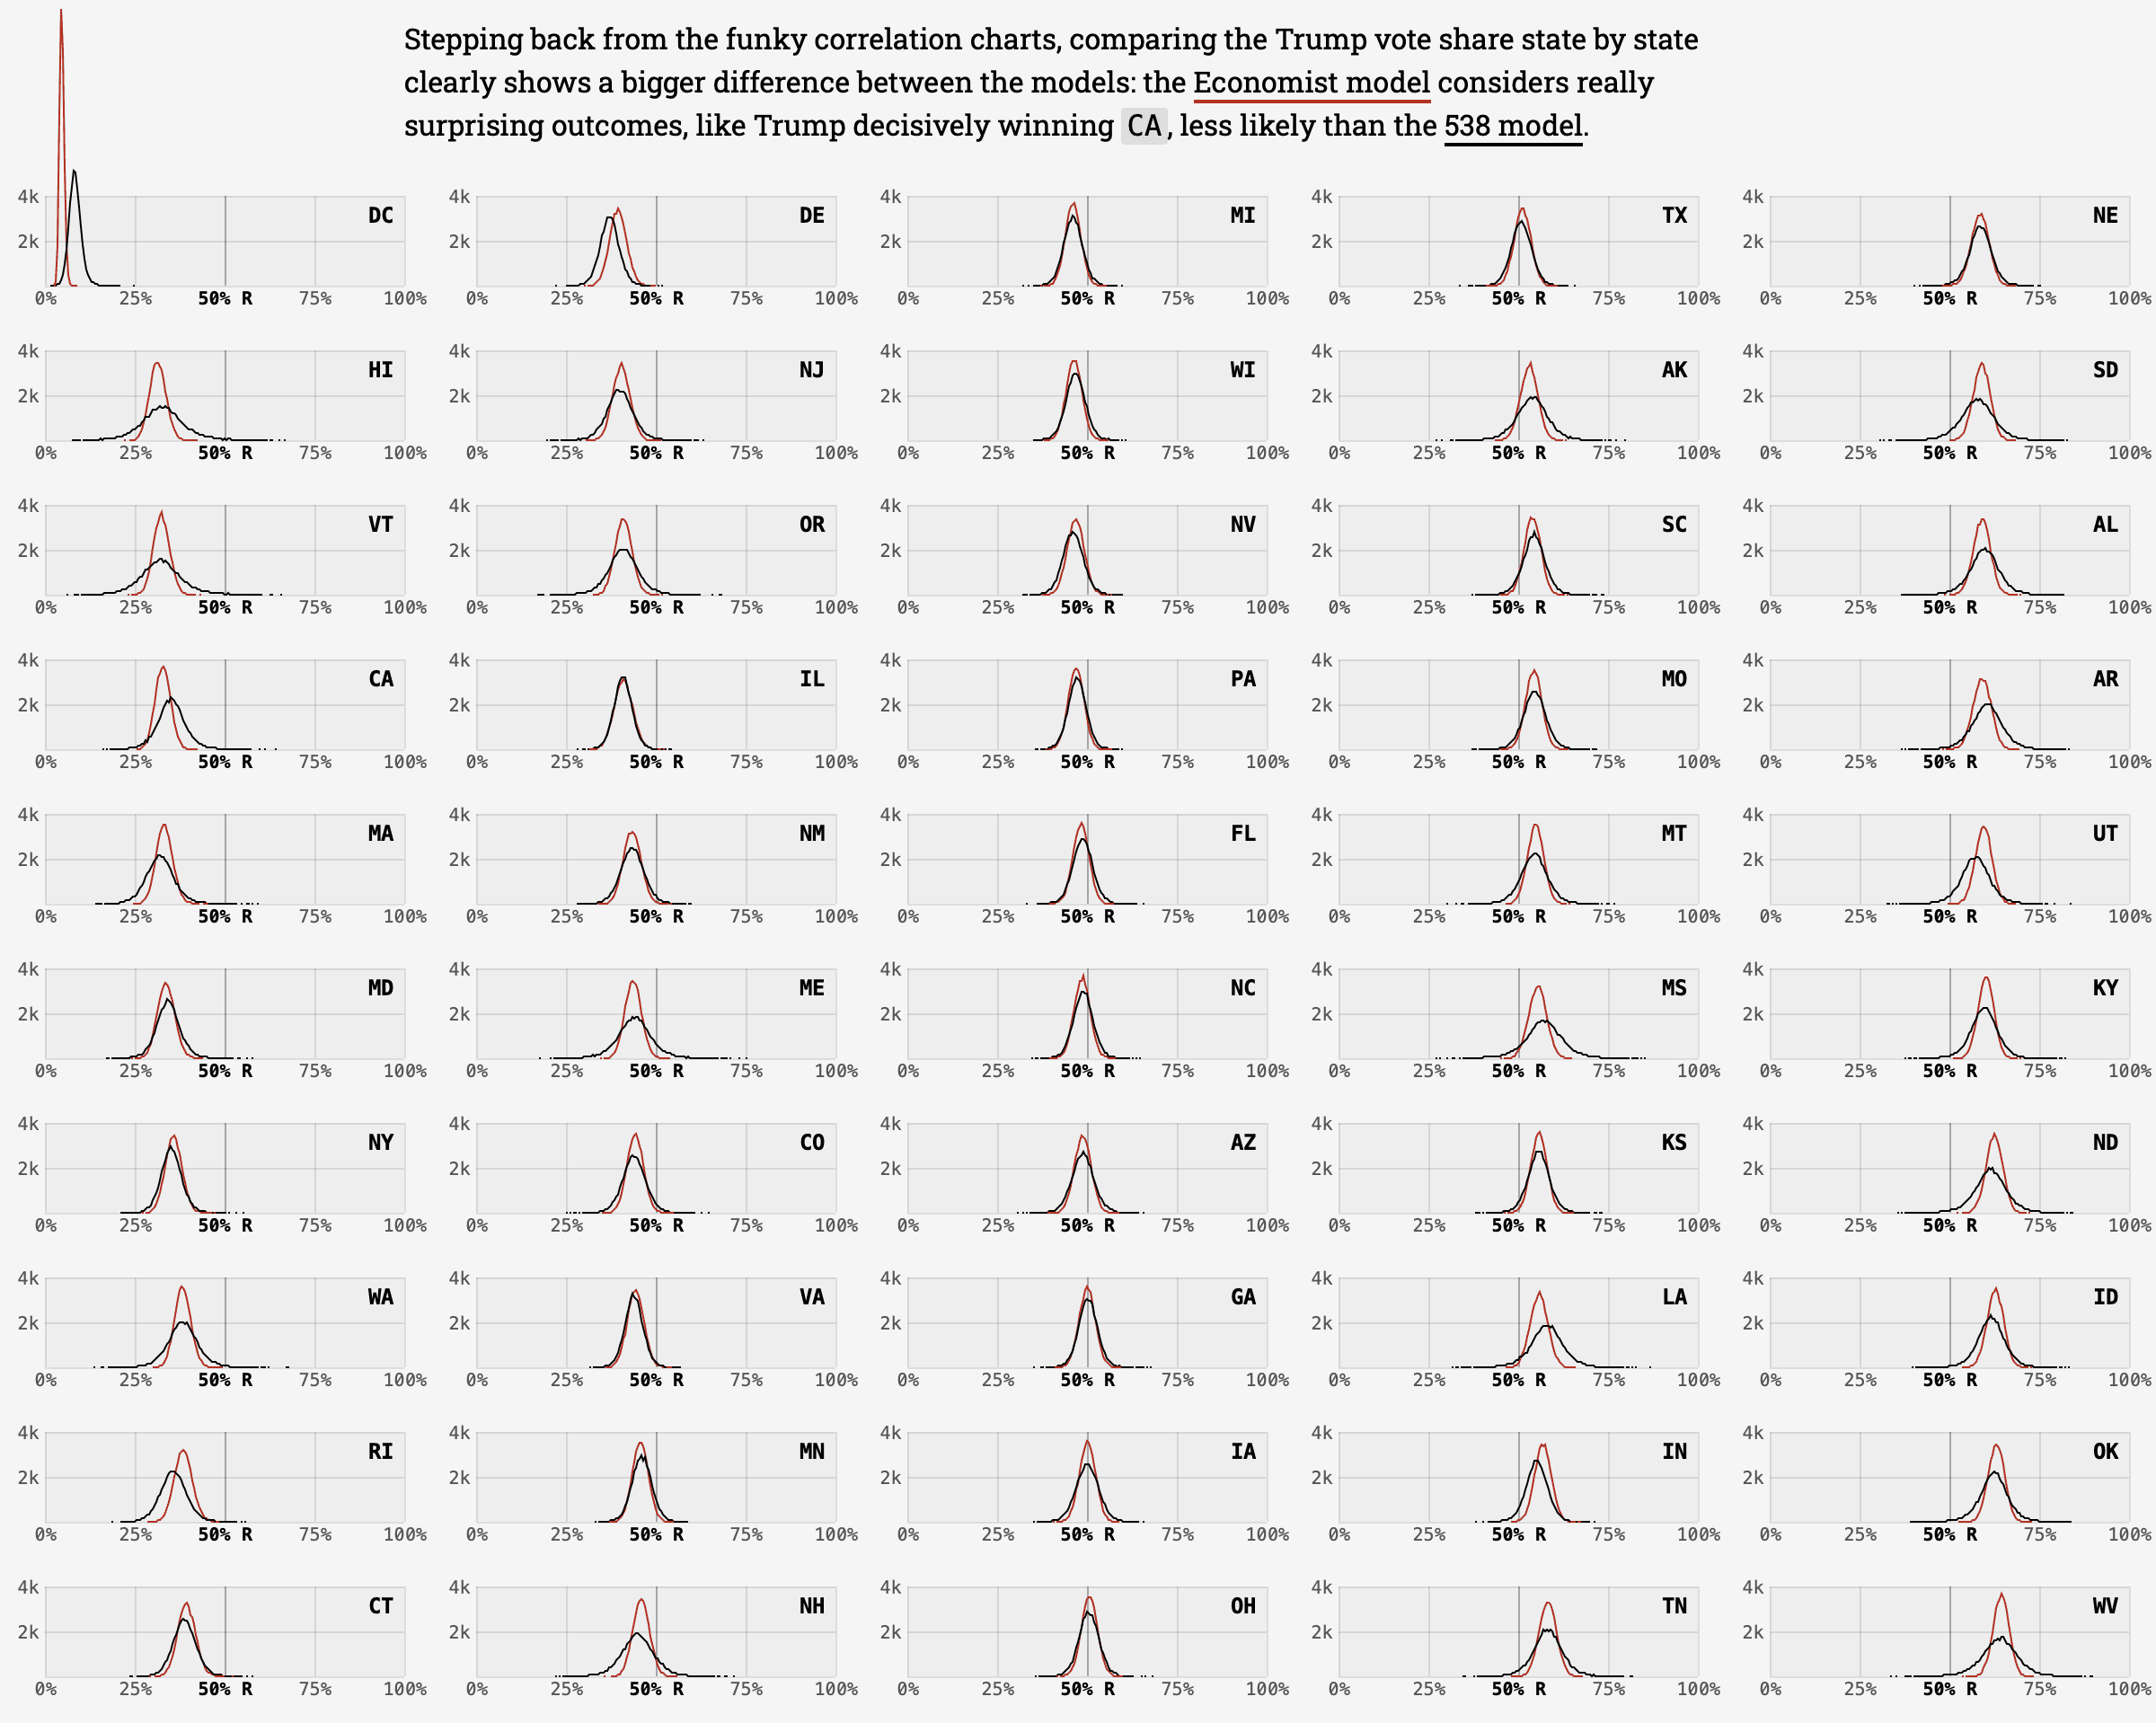

Originally Pearce had the states in alphabetical order but at my request he reordered them by increasing projected Republican vote share. The graphs are ordered by column rather by row, which seemed odd to me, but Adam explained, “column order has the nice effect of putting left leaning states on the left slide of the chart.”
We see a few things here. For some states, there are differences in the point forecasts: Fivethirtyeight gives Trump a much bigger expected vote share in Washington, D.C., we’re giving Trump more in Delaware, and there are noticeable differences in California, Vermont, Louisiana, and a few other states. I don’t know exactly what’s behind these discrepancies, and without looking into them I wouldn’t really want to make a call on which forecast seems better. Maybe, for example, Fivethirtyeight is giving Biden a home-state bump in Delaware and we’re not, or maybe some of these differences have to do with which polls are included in the different forecasts, or even data processing problems. Again, I’m just guessing here, and most of the differences in the point forecasts are small, which makes sense given that we’re basically using the same data.
The next thing I noticed is that the Fivethirtyeight intervals get really wide for some of the states that don’t have a lot of polling: look at, for example, Hawaii, Vermont, and California, all of which Fivethirtyeight show with an outside chance of Trump making it close, or Oklahoma, West Virgina, and Wyoming at the other end.
And look how wide the Fivethirtyeight interval is for South Dakota! They have Biden with a 6% chance of winning this very strongly Republican state. But they have just about no poll data: just one poll from Mason-Dixon and seven polls from Survey Monkey. Seven polls doesn’t seem too bad, but they give Survey Monkey a “D-” rating. In contrast, we give Trump more than a 99% chance of winning the state, even though our inference is based only on . . . one poll, that Mason-Dixon survey from October. We don’t include the Survey Monkey polls at all.
What’s the difference between the two forecasts: We make more use of the national polls, along with the relative positions of the states as observed in previous elections. As Pearce notes, the Fivethirtyeight forecast implicitly allows for the possibility of a major realignment, whereby South Dakota becomes competitive in a way that our model does not allow.
Which forecast is better? I can’t say. I’m no expert on South Dakota and have never even been to the state. The point is that the two models are different. We’re using the previous relative positions of the states as a prior (with national polls and other state polls available to estimate the national average); Fivethirtyeight is mostly trying to learn about each state from its own polls. From our model’s perspective, South Dakota is an essentially certain Trump win; from their model’s perspective, they have very little data so all sorts of unusual things can happen.
The Fivethirtyeight intervals for sparsely-polled states are too wide for my taste. Look at Hawaii and Vermont, for example. I think that by not fully accounting for the relative positions of the states in recent elections, as well as the many national polls, their forecast is leaving valuable information on the table.
On the other hand, it’s suspicious that our distributions for all 50 states have roughly the same width (forget about DC; it’s on the edge which has something to do with the logit transformation, and in any case I don’t know that I’d take our forecast or the Fivethirtyeight forecast for DC seriously). No way that I’d want our intervals for Hawaii, Vermont, and California to be as wide as Fivethirtyeight’s, but is it right that our intervals for those states are approximately as narrow as our intervals for Pennsylvania, Michigan, Florida, and other intensively-polled states? Maybe not.
I was curious, so Elliott graphed standard deviation of the predictive interval for each state—actually, the interval for each state’s Biden vote share minus the national average votes, so we’re directly tracking the relative positions of the state—vs. the number of polls we have for the state. Actually I’d asked for the width of the 95% predictive interval, as I think that’s more interpretable than the sd, but that’s fine, the sd gives the general picture.

States with more polls do get estimated more precisely—but not by much. And really not by much once you add the approximate 0.015 (that is, 1.5 percentage point) predictive standard deviation of the national vote. In R:
> sqrt(1.5^2 + 2.1^2)
[1] 2.6
> sqrt(1.5^2 + 1.2^2)
[1] 1.9
I don’t know what’s going on with the different clusters of states in the graph. I really don’t. Maybe something having to do with our correlation matrix: if Hawaii, New Mexico, Maryland, and Connecticut have high correlations with other sparsely-polled states, while Iowa, Minnesota, and Ohio have high correlations with states with more polls, that could explain some of this patern. But, anyway, setting that aside, maybe it’s ok that our predictive interval widths don’t vary so much by state: we really do get a lot of information from the national polls plus the relative positions of the states in previous elections.
Interlude: Some experiments
This got us wondering: is our model using the state polls at all? What if we had some sort of bug or conceptual error so that we’re locking in the relative positions of the states and not updating with the state polls? That would be a problem!
So we did a quick experiment, taking all the Pennsylvania polls from the 2020 campaign and shifting them by 4 percentage points in the Biden direction (for example, if a poll were Biden with 51% of the two-party vote, we shifted it to 55%). We then re-fit our model and took a look at the Pennsylvania estimates. They were about 3 percentage points higher for Biden.
That made sense to us: Pennsylvania has tons of polls, but we wouldn’t want a full 4 percentage point shift, as there could be a systematic error in all the polls in the state. (Remember Michigan etc. in 2016?) Partially pooling by one-fourth toward the prior mean seems reasonable here.
This in turn got us wondering about the roles of the state and national polls in our analysis. So we decided to do a couple more experiments, first fitting our model with only state polls and then with only national polls.
The question is: how much information are we getting from each data source.
First, here’s our inference using all the data:

The graphs show estimates of Biden support over time nationally and within each of twelve swing states. These are not graphs or how our forecasts changed over time; they’re graphs of our current estimate of the time series of opinion. One thing you can see is that the time trends look somewhat different in different states, which reflects the information from the state polls.
Next, here’s our inference just with state polls:

And now just the national polls:

The inferences from all polls, just state polls, and just national polls are different . . . but not by much!
I’m not quite sure what’s going on here. On one hand, sure, the different polls are all estimating the same damn thing, and the relative positions of the states really haven’t changed much from 2016—but, still, you’d think that including twice as much data would give us some increased precision in our electoral vote forecast. Maybe the issue here is that we allow separate biases for the state and national polls. But I’m not sure. I feel like I won’t fully understand the model until I track this one down.
3. Maine and Nebraska
This is not a big deal, but Maine and Nebraska split their electoral vote, and in our analysis we just treat them like the other states and assign their electoral votes to the winner. This has essentially zero effect on win probabilities of the candidates, but, as someone pointed out to us, it can lead to our forecast electoral vote total being off by 1, which could come up when people are evaluating the model after the election is over.
I don’t regret not including the separate districts within Maine and Nebraska in our forecasting model, as it just adds complication for very little gain—indeed, I’m not so thrilled about including D.C. either, for similar reasons—but we’ve come around to thinking that it would make sense to stick those districts back into our forecast at the end, just using some simple rule like this: For each simulation, take the candidates’ vote share in each state and shift up and down to simulate the district vote shares assuming a uniform swing within each state from the previous election, and then add or subtract an electoral vote for any of the districts end up different from the state. Again, no big deal, but then we’d get more reasonable electoral vote totals.
Summary
There are a few unresolved issues with our forecast.
– Changing to a long-tailed error distribution should help with our extreme probabilities, and maybe we’ll try to get this in before the election, but we have to be careful: as always, any change in the model can unexpectedly affect other things. It’s not a Jenga, exactly, but neither is it a WW2 jeep.
– We’re not sure how bothered we should be about the intervals being not much wider in sparsely-polled Vermont and Idaho then in frequently-polled Florida and North Carolina. Maybe this makes sense, maybe it’s a problem with our model. The miscalibration we saw in our backtesting could be caused by short tails or by intervals in non-swing states being too narrow. The experiments we did reassured us that our model was implicitly weighting state polls in a reasonable way, but we still don’t feel like we have a full understanding of what it’s doing.
– It should be easy enough to hack Nebraska and Maine’s electoral votes, and maybe we can get that in before the election.
I’m sure there are other issues we haven’t thought of. Thinking more generally about workflow, this model really needs a lot more scaffolding for us to fully trust it. The same goes for other forecasting methods: there’s always this interplay between assumptions, data, and the mapping from data to inferences.
Knowing that your model will be wrong (“All models are wrong” is not just a slogan; it’s a phrase to live by) is so liberating. You can release yourself from the perceived need to defend your model and instead work on understanding and improving it.
As they say in AA (or someplace like that), it’s only after you admit you’re a sinner that you can be redeemed. I know I’m a sinner. I make statistical mistakes all the time. It’s unavoidable.
Finally, the above post makes me realize, once again, that we need more tools for statistical understanding. Once the data have been collected and the model has been constructed, fit, and debugged, then the real work begins.
What happens if you run the model on 2016 data. Have you tried that?
Jonatan:
See here for back-testing results in 2008, 2012 and 2016: https://github.com/TheEconomist/us-potus-model
The problem with running it back on the 2016 elections is that there is borderline evidence of fraud on an international entity scale (involving thousands of operatives).
Statisticians are more cautious and overall you cannot see this by significance across the country but there are electoral districts from Pennsylvania for example which should behave in a similar way with dramatically different results and that favoured Trump enough to give him the electoral college.
If I was going to cheat an election I would get the electoral lists for those who have not voted for many years and vote on their behalf. Precisely the type of Trump voter that swung the polls. With a forensic analysis of the vote at the district level with a proper audit trail and the cooperation of the US government you would have been able to demonstrate that there was large-scale fraud. Not Facebook interference but real on the ground and online. But that was never going to happen.
This time the fraud would have to be on a staggering scale. If Trump wins then 100s of samples from multiple companies in multiple locations over 7 months ALL have to be wrong. As only 2 polls since April have shown Trump ahead. That would be a systematic bias outside of reasonable possibilities. The only possibility in that case is criminal activity.
Andrew,
That is an extraordinary claim, luckily it is an easy one to check.
Get the voter rolls from the precincts that showed the biggest 2016 Trump surge and compare to the previous 2 elections, contact the voters who voted in 2016 but not in the years before to ask if they indeed voted in 2016.
A more likely explanation is that due to very very low voter participation rates in the US, there is lots of room for the unexpected surge to drastically change the race, especially when filtered through the electoral college.
My prediction is that if you do the study, you will obtain the same result as usual for US elections overall, below .01 percent rate of fraud.
While your assertion of focused and coordinated electoral fraud is leveled at Trump, it plays exactly into his current narrative that the voting system cannot be trusted.
What is a t_4 error?
t distribution with 4 df
Any idea where the 4 df comes from?
I think it’s just a reasonable choice for pretty fat tails, avoiding infinite variance as df -> 1 or thin tailed approximate-normality when df > 20
A very interesting read, thanks for putting this together.
Andrew wrote:
“‘All models are wrong’ is not just a slogan; it’s a phrase to live by”
I prefer to look at it a different way. No model is ever wrong, it will produce exactly the output it was designed to produce, with perfect fidelity, accuracy, and precision. If it fails to accurately reflect any aspect of reality, well that is the modeler’s fault!
Matt:
Yes, this is the Tukeyesque view that what we think of as a “model” could be better thought of as a mapping from data to inferences.
Or, to put it another way: The model will necessarily not capture many important parts of reality, but in any case the mapping is what it is.
I don’t think there’s actually evidence of a “shy Trump voter.” But…I’m wondering how you have considered the possibility that the phenomenon is real, or alternatively but effectively similarly, perhaps a better way to put it is that there is something like the similar error across many state polls of the sort that existed in 2016 – where it seemed the mistake analysts made was that the error in state polls might all be in the same direction rather than randomly distributed?
Suppose, again (as it seems to me happened last time), there is a block of people who don’t typically vote, and thus won’t show up in “likely voter” polls, who will come out in this election in support of Trump?
I ask that as one of the many who are still suffering PTSD from the last election!
Many people don’t want to tell a pollster they’re voting for Trump because they think antifa will come to their house and threaten them.
It’s pretty obvious.
Joshua:
Stuff like this should be adjusted for by the state polling error correlation structures both Andrew and Nate use in their models, in addition to things the House effect from individual pollsters, and Andrew’s partisan non-response adjustment.
Anoneuoid –
> Many people don’t want to tell a pollster they’re voting for Trump because they think antifa will come to their house and threaten them.
“Many people…” “It’s pretty obvious.”
Totally un-analytical – and useless. I’ve read a fair amount about the “shy Trump voter.” Very little evidence it actually exists – except in the minds of some people for whom it might exist and who very much want it to exist on a wider basis – but who make the mistake of extrapolating from their own views/behaviors and anecdotes. But…what did happen was that there was an aligned error across state polls last time…and I have PTSD, so as much as I think that the “shy Trump voter” is a Just-So story, I worry that it’s real.
Go talk to people instead of reading about it. Assuming they would feel comfortable discussing it with you.
Anoneuiod –
> Go talk to people instead of reading about it.
I don’t know what makes you think that I’ve ONLY read about it.
But reading about it is important. Weird that you’d just dismiss that. I’m not totally dismissing the value of anecdotes, but they should be placed into full perspective. If you think there’s a “shy Trump voter” effect, you could deduce that certain patterns would play out – and they didn’t/haven’t.
And you can just look at the numbers. For example, Trump outperformed the polls in the very areas where you’d expect the least “shy Trump voter” effect, if one existed. Not in the areas where you’d expect people to be intimidated. If it’s juste a matter of a social desirability bias when talking to pollsters – you’d expect to see patterns play out relative to non-personal interaction polling, which didn’t occur.
Say that you talk to people who claim that they’re lying to pollsters for many reasons. First, you have no idea it that’s at all representative. Second, you have no idea if they’re lying to you – ironically because of a social desirability bias, or fooling themselves. I’ve been reading the right wing make all sorts of claims about bias in polling due to sampling bias for years. And they’ve always proven to be wrong.
I live in a pretty rural part of NY State. Lots of gun clubs around. I can hear people shooting regularly. But more generally the area is pretty liberal – of the sort where you’d expect Trump supporters to be “shy.” But in my area, by far it is the Trump supporters who are the most vocal and aggressive about their views on the election.
I doubt many people would bother to lie. They just wont discuss politics with anyone they arent comfortable with or be polled.
These are not people who would normally be vocal and aggressive about politics.
Anoneuiod –
At any rate, your reverse-elitist attitude that you know reality better because you’ve talked to non-elitists aside, my real interest is in knowing how they’ve accounted for the possibility that for whatever reason, “shy Trump voter” or others, there would be a non-random and similar error across state polls – as happened in 2016 – hence explaining why popular support polling was well within the MOE – but a lot of state polls weren’t and pretty much all the errors were in the same direction.
If they are doing an forecast that relies heavily on state polling, I”m wondering how they’ve accounted for that.
If you are convinced of some significant effect from “shy” Trump voters despite no evidence other than your anecdotes – I have no interest in convincing you otherwise.
Its really based on reason, then my experience is consistent with that. I didnt vote for Trump btw, so Im not talking about myself. I just know multiple people that are scared to even mention Trump around their friends/family and there is no way they would tell a stranger.
Anoneuoid –
Sure, it stands to reason there would be some. The question is how many. You are assuming that your experience is representative. There’s every reason to think it wouldn’t be. We could assume that there are people who support Biden but live in areas or interact with family members where stating their support would cause problems. The question is whether we have enough information to think that there would be a significant, and differential signal. I haven’t seen any information to support such a view, and there is a lot of information that indicates otherwise. A lot of people are assuming that the polling errors in 2016 are attributable this explanation – but they thought that this was happening before the polling errors showed up. We know about confirmation bias, and we know that many of the people who are pushing this theory have reasons to want it to be the explanation for the polling errors. And we know that many theories about the skewing of sampling, from the same crowd, have proven false in the past.
>> We could assume that there are people who support Biden but live in areas or interact with family members where stating their support would cause problems.
There seems to be a very significant gender gap in Trump’s support, esp. in suburbs, which makes me wonder how many women who are married to Trump supporters publicly support Trump but will vote for Biden.
I don’t know that there would be a reason to deceive pollsters, but this could mean that Biden will get more support than one would expect in areas with e.g. a bunch of Trump signs.
I’m scared to even mention that name, too; in the wishful, but mistaken fantasy that *it* will not exist if I do not acknowledge it.
For all the (understandable) discuss of the differences between the 538 and Economist models, I think that we are loosing how much they have in common.
Both now have a close to 99% chance of Biden winning the popular vote, with a bit lower for electoral college. Note that this is very different from both the betting markets and the tone of most pundits, so that fact that you agree is significant.
Both have the same basic message about the history of the race. Polls have been steady for months, and thus the likelihood of the candidate who is ahead (Biden) to win has increased as the time left for additional movement has decreased. You had this from mid 80’s to high 90’s, 538 from low 80’s to low 90’s.
You have very similar list and ranking of the swing states and pivot state.
Some of the differences that you talk about above — e.g. the vote share in DC or WY, have virtually no consequences. Biden will win DC, Trump WY, and the popular vote in these are too small to move the national total by much. These predictions are based on very little data, as no one has bothered to survey. Feels like we are getting to angels on a pin territory.
At this point, it seems to me that the biggest uncertainty is about the process of voting — how many can vote early, who might be deterred from voting by COVID scares or long lines, what happens with counting the votes. Neither of you have made any attempt to model these — understandable given that there is no historical data.
Net, I’d say let’s all leave these models be now, and look again when we have the actual vote counts to compare.
Now get out and VOTE.
The models are mappings from data (mostly polls) to inferences. The gap with the betting market (which has access to both models) may consist largely of a predicted error in the polls
https://www.predictit.org/markets/detail/6936/How-closely-will-the-election-results-match-the-polls
While most betters believe there will be a small polling error, some believe there will be a large one. Due to the effect of mail-in ballots, COVID, and other factors, pollster’s distribution of their likely/registered voters and normalization could be off. And perhaps even the ‘shy’ voter phenomena.
The betting markets currently believe Trump has the edge in Florida and Ohio. If you mark both of those in the interactive 538 model, their 65/35 prediction is exactly in line with the betting market. Recent Florida polls have a 2% to 4% edge for Biden, which a small polling error could overcome. Seeing as the average polling error in 538’s A+ pollsters is about 4%, this would hardly be a surprise.
I’m curious why neither 538 nor Economist models are considering correlated, systemic polling errors as part of their models. Or are they and the correlations tend to be small?
Nic:
To answer your last question: I can’t speak for Fivethirtyeight forecast, but our forecast does allow for correlated, systemic polling errors. That’s why we give Biden a 96% chance of winning and not a 99% chance of winning. What we don’t have is an expectation that the correlated, systematic polling errors will favor one party or the other.
Also it’s tricky to talk about polling errors in this context. If someone tells a pollster he plans to vote for candidate X, and then he votes for X, but his vote is never counted because it’s in a pile of mail that is delivered 3 days too late, is that a polling error? It’s a mismatch between the polls and how the votes get counted.
> I can’t speak for Fivethirtyeight forecast, but our forecast does allow for correlated, systemic polling errors.
538 does as well. They talked quite a bit last time about why many of the models were wrong in underestimating the correlation of errors, and said was as a reason why they gave Trump a higher probability of winning than other models. Silver talked in a recent podcast about how they even factor in anti-correlation between errors in certain states.
Andrew wrote
“I’m sure there are other issues we haven’t thought of.”
At this very moment I am listening to an NPR program highlighting armed, self-dubbed patriotic militia who, openly carrying firearms, intend to police/intimidate polling places. The U.S. Supreme Court has just limited counting of votes in Wisconsin which were held up due to postal service cutbacks. President Trump has often indicated that he will lose only if there is massive cheating against him.
Any model which, no matter how statistically detailed and sophisticated, leaves out such important aspects of American life is suspect.
We have been quite explicit in stating that we are only modeling vote intentions. Accounting for events such as those is fraught with uncertainty as it is not even clear where one would start. Elliott and I made adjustments for absentee ballot rejection rates (https://www.economist.com/graphic-detail/2020/10/24/postal-voting-could-put-americas-democrats-at-a-disadvantage) but compared to the local effect on voter intimidation that issue is at least tractable.
Very interesting article.
The models model voting intention. The betting markets “model” the actual winner. The models are at ~90% Biden, the markets at just ~65%. There are multiple possible reasons for this big gap, but a key reason amongst them must be that a lot of people are anticipating voter suppression and other “dirty tricks”. Very sad.
There’s been a lot of chatter and comparison about the Economist-versus-538 model face-off. Seems slightly eyebrow-raising for Economist to be talking about tail-fattening at this late stage.
Splitting Maine and Nebraska just feels like a bug fix though…
I mean yes. We should have thought about this six months ago. Our bad, quite literally. But then again, we won’t change the model before the election so this is half self-flagellation, half hedging to eat only half of a crow if we end up being wrong.
> Biden, the markets at just ~65%…
But as you indicate that’s a kind of modeling also. And there’s no particular reason to trust it over modeling of “intentions.” So saying that the markets “model” the actual winner is a bit of a stretch – especially since the markets adjust on the basis of where the money’s going as much as on how people evaluate the probabilities.
Also, there’s a big difference between “some Trump supporters will try underhanded things” and “these will have enough effect to meaningfully change the probability of a Trump win”.
People have been nervous about mail ballots for like 2 months, I don’t think that the Election Day deadline in WI has much chance of changing things, especially as WI right now does not look to be terribly close.
If this were a 2000 razor-thin-margin election these things could make a difference. But it would take a pretty large polling error to get this one into that territory.
If there were no polling errors Biden would win not only WI/MI/PA, but NE-2, AZ, FL, NC, and possibly places like Iowa and Georgia as well. In that world, no one-state shenanigans would change the outcome.
Why t_4, not t_3 or even t_2? t_1 is properly pathological, I wouldn’t choose that, but if I simulate something that has “realistic” tail behaviour, i.e., producing a few observations that are really off but still with some connection to the center (all subjective of course), I’d mostly choose t_3, and t_2 if I want somewhat more challenging outliers. t_4 still seems rather tame to me.
you could make it a t(x+1) with x having a gamma(3,2) distribution ;-)
Thanks much to Andrew, Elliott, and the rest of the Economist team for continuing to trace down these issues.
Right now, the Economist model gives Trump only a 3% chance of winning the electoral college!! However, in testing on 2008-2016 data, state results assigned 3% tail probability actually occurred 8% of the time. Similarly, the Economist model gives Trump something like a 0.1% chance of winning the popular vote, but in testing on 2008-2016 data, state results assigned 0.1% tail probability actually occurred 3% of the time.*
I’m a skipping record with these points, sorry about that, but I think they are important to understanding differences between stated and actual forecast reliability. Yes, one shouldn’t expect national and state predictions to have exactly same performance, but the degree of calibration problem with state results makes it difficult to consider the national predictions as reliable, especially because there not enough national data to check national calibration itself.
So I hope you do change the model!! The model has so many other excellent attributes, it feels like a shame to have the miscalibration damage good work.
Yes! This may be the most important lesson I learned from experimenting with the Economist model: The difference between predictions of normal- and wide-tailed models gets larger as Trump’s chances diminish. So as Trump’s chances diminished, the issue worsened.
From the experiments I’ve mentioned before, I think 4 is likely too large to correct the miscalibration. Tails are very different for t distributions with 4 vs. 3.5 vs. 3 degrees of freedom, so I suggest also checking values less than 4.
*If you prefer thinking about 6% and 0.2% 2-tailed probabilities, those happened 11% and 3% of the time.
Here are calibration plots to substantiate my above comment:
Calibration plot* — In 2008-2016 backtesting, states are often outside 95% and 99.9% predictive intervals from the Economist model.
https://i.postimg.cc/c4KTB1hB/tail-check-v4.png
Prediction interval calibration plot — In 2008-2016 backtesting, prediction intervals undercover, and the undercoverage gets worse in the far tails, as expected for a model with too-narrow tails. The problem isn’t limited to the far tails, however.
https://i.postimg.cc/prShdHn2/tail-calibration-full-range.png
* This plot matches the Economist’s own calibration plot, except random seed variability and that I include DC.
Also, I’m not sure if I can post R code here using the html pre tag, so here is a test of that. (Please disregard the test.)
testing_testing_123 % bar %<% foo < 1 <= 2 <% bar %<% <>b>
&a
&b&
c&
}
Thanks for this. The directions of these errors are interesting.
Among the 17 outliers, all but one of them was “wrong” by underestimating the margin of victory.
It is related to a pattern of hypothesized shy Trump voters Andrew discussed in his 2016 recap, but it looks like it holds a bit more generally.
Probably a combination of several factors such as 1. these are relatively smaller and less pivotal states that don’t have many high quality polls (none of the states ended up with 45~55% D/R vote) and 2. their vote shares were estimated by relying more heavily on national averages than they should have been (both from the polling process and the model).
Fred –
> It is related to a pattern of hypothesized shy Trump voters Andrew discussed in his 2016 recap…
I did a quick Google and came up with a few possibilities, but I’m hoping you could link to the discussion you were referring to?
I was thinking of the figure 1 and survey nonresponse bias mentioned in ’19 things we learned from the 2016 election.’
Trump did as well as polls indicated in blue states, did better in purple states, and did much better in red states.
Thing is, that would suggest that “shy Trump” *wasn’t* explanatory. With “shy Trump” you’d expect the opposite – that he’d out perform polling in blue polling in states. Also, IIRC, Clinton’s performance relative to polling wasn’t what you’d expect with “shy Trump.”
Also, the root foundation of the “shy Trump” voters – the Bradley Effect – kind of died with Obama outperforming polling (suggesting not wanting to appear racist didn’t lead to inaccuracy in polling)
Any hope for making ‘df’ a hyperparameter and putting a prior over it? Something like gamma(2,0.5)?
That’s a good thought :) I may test it on 2008-2016 data, but it would take a while to run. Also, if I do test your suggestion, I still can’t tell you how it would affect Trump’s 2020 Economist model win probabilities. (Andrew, Elliott, et al. keep the 2020 code proprietary/non-disclosed — what they share is 2008-2016 backtesting code.)
Quick estimates that I’ve tried suggest that adding appropriately heavy tails could double or triple Trump’s 2020 electoral college win probability, but the Economist team hasn’t said how much Trump win’s probability changes with heavy tail models.
===========
Please disregard the below — more tests to see if I can add code without it being truncated:
testing_testing_123 <- function(x) {
foo %>% bar %>% foo < 1 &ge 2 < 3 &le bar
<
<
<
<
&
&
&
	 foo
foo
}
Let us know if you do try! As noted above, since even df = 1 is a bit pathological for T distro, maybe best to do something like df = 1 + gamma(2, 0.5). If you are convinced it needs to be bounded below 4, to ensure fat-tailedness, I guess df = 1 + gamma(2,2) would be good.
Chris:
It can be hard to pick this without doing some simulations to see what the model implies. A long tail is fine, but we don’t want to show Trump with a chance of winning NJ, etc.
Why are the uncertainty intervals narrower when using only state polls vs using all the data?
“Knowing that your model will be wrong (“All models are wrong” is not just a slogan; it’s a phrase to live by) is so liberating. You can release yourself from the perceived need to defend your model and instead work on understanding and improving it.”
Amen!
Out of curiosity, have you thought about betting on the election? For the life of me, I can’t understand how Biden is still only at 66% odds of winning based on betting odds.
Even if the odds of Biden winning are less than 95%, it feels like the odds are clearly much higher than 66%.
Alex:
Yes, I have thought about it! See discussion here and here.
I reckon you’ve got your reasons but it seems nearly inconceivable to me that if one truly thought an event has a 96% chance of occurring, one wouldn’t be betting everything they could, given the odds the betting sites are offering just a day and a half before the election.
Jack:
I don’t quite know how to place these bets—maybe it requires some sort of access from outside the U.S.? Also I feel a bit personally uncomfortable about betting on elections. I don’t mind if other people do it, but it’s not something I’m in the habit of doing myself.
Take the 538 polling averages for the swing states (2-party vote share), and subtract off the observed errors in 2016. What you get is a map that looks like the betting market’s. NC flips, GA and FL become evenly split, and AZ, PA and WI are clinging to the Biden column by a thread. That’s how you get Biden being the favorite, but a small shift to Trump could swing the electoral college his way. The assumption is the pollsters have failed to (fully) correct for the 2016 swing state biases.
The Economist headline says, “Right now, our model thinks Joe Biden is very likely to beat Donald Trump in the electoral college.” The estimates are listed under the headline “Estimated electoral college votes”. Nothing about these being estimates of intent and not taking into account possible voting irregularities.
The Economist may feel it is impolite to say “excluding widespread cheating, skullduggery, fraud and voter suppression”.
Great work, guys!
I’m tellin’ you though, something’s fishy with those random walks. Doesn’t Iowa just look like an attenuated Michigan? It looks to me like the likelihood thinks that states with less polling also have less variance….
> We’re using the previous relative positions of the states as a prior (with national polls and other state polls available to estimate the national average);
This sounds like you’re saying the prior for the election in year X is based on the election outcome in year X-4 (i.e., 2020 is based on 2016). I thought your prior was based on 2008, 2012, and 2016 election outcomes.
Is the model explicitly considering forecasting the (i+1) election based mostly on election (i)? Is it a sliding window where old elections will eventually drop out of training data? Is it a universal model that could be applied to any election past or future?
I realize this is your first forecast and you did some specific backtesting/tuning, but I am more interested in the theoretical basis for the model. It seems kind of like you hard coded the correlation matrix to get reasonable results for recent elections, but I wonder if 538 may have a more flexible framework that relies more heavily on state polling. In theory, a more generic forecast might perform better when backtesting on much older elections, but it might be debatable if that was a good strategy when the goal is only forecasting the next election.
N:
I think we’re using some average of the three previous elections, but I don’t remember exactly. I don’t think changing this will do much to the forecast.
Also, we use state polling too! The right thing to do is to use both national and state polling, as both are relevant.
Andrew:
Thanks for responding. Great post btw!
I think I wasn’t clear in stating my main question. Do you think your model may be somewhat hard coded (e.g., correlation matrix) to fit recent elections while 538’s model may be more flexible (e.g., lower correlations, larger uncertainty when polling is sparse) to fit a broad range of historical elections?
Seems like typically we would want to check model performance on all available data, but in this case trying to achieve good performance on old data may come at the expensive of performance on latest data.
N:
I think both models are hard coded, in different ways. In the above post I wanted to separate the issue of allowing for outliers from the correlation issue. I think that some of the correlations in the Fivethirtyeight forecast don’t make sense and that they’re an artifact of how they threw in the error terms, so in that sense their model is overfitting to something too.
To step back for a moment, what could make sense would be to have a model that integrates longer-term changes over 4, 8, 12, etc. years, with information available during the campaign. Once we have a bunch of campaign polls, the prior of the relative positions of the states doesn’t matter so much, but it’s relevant when considering what will happen in future elections.
I think the charts look good but we need to be careful in saying Nate’s model is the way it is just because it allows for a realignment. That’s obviously not the (only) reason it’s producing some of these behaviors and we can speculate based on what he’s said that it’s not very likely at all. What’s much more likely is Silver is allowing for something like a vaccine being introduced, one candidate getting sick, a major disruption in ballot collection etc.. How you actually model these is a good debate to have but I think too much hay and speculation is being made of too little at times in these debates..
Anon:
I think you’re overthinking this. It’s not that the Fivethirtyeight model explicitly allows for a realignment, or allows for a vaccine or a candidate dropping out or whatever. I think what happened is they put in a bunch of extra error terms, out of a desire to be careful, and the result was they got some predictions (such as that map with Trump winning New Jersey but losing the other 49 states) that didn’t make sense. It’s not that they were planning to allow that; they just lost control of their model. One of my points is that this happens all the time. Multivariate models are complicated and it can be difficult to make them do exactly what you want.
You’re still speculating, which is fine. You’re putting a lot of emphasis on your ability to conjecture based on past experience, which obviously we all respect. I also don’t think I’m overthinking the idea that the longtails and some kind of additional uncertainty (their index) are useful in that they provide one mechanism for modeling all the (many) unknowns of the present moment. Perhaps their uncertainty index and something about how polling error is modeled led to some odd outcomes. (Hey I don’t know either).
But the sweeping conclusions along the way are not that useful.
You say:
> What’s the difference between the two forecasts: We make more use of the national polls, along with the relative positions of the states as observed in previous elections. As Pearce notes, the Fivethirtyeight forecast implicitly allows for the possibility of a major realignment, whereby South Dakota becomes competitive in a way that our model does not allow.
I’m sorry but I think *you* would benefit from thinking about this more because you’re leaving a lot of Nate’s own commentary off the table. I’m not overthinking things here by suggesting that claiming Nate made this all this way because he believes in realignments is laughable. He would not do that.
It’s worth putting more time and effort into unpacking those instead of just sweeping out one theory that’s not well-supported by his posts/writing… But honestly he really should just do a podcast with you all already and stop referring to you as “The Economist Guys” like you’re some kind of halal stand or something.
Anon:
I’m not quite sure what you’re saying. Do you think that it is reasonable to assign Biden a 6% chance of winning South Dakota and give Trump a 2% chance of winning Oregon? I think those numbers are too high. I don’t think Nate or anyone else involved in the Fivethirtyeight forecast made a conscious decision to give these probabilities, or to make that map showing that Trump could win New Jersey while losing the other 49 states. What I think is that they made a complicated model (which is fair enough, elections are complicated so we need complicated models!) which had some unanticipated side effects. One reason I thought it was interesting to explore the correlations of the forecasts is that they gave me some insights into how this could’ve happened: The forecast was constrained by the (reasonable) desire to have a wide enough uncertainty at the national level. If you get that national forecast by averaging state forecasts that are not highly correlated, then you’ll just need to have implausibly wide intervals at the state level. That’s just math.
Regarding whether Nate believes in realignments: I have no idea what he believes in, but, yeah, I don’t think he actually believes in everything in his forecast. If you take his forecast literally, then it does include the possibility of realignments (that New Jersey map and many others that people have pointed out), but, again, I think these are unfortunate byproducts of a complicated forecast with many moving parts. I think Nate believes in his forecast for the national popular vote—and I too think his national popular vote forecast is reasonable, indeed i think it’s basically as reasonable as our forecast!—but it’s hard to build a state-level model and get all the details correct. Again, that’s true of our forecast too. It’s not “laughable” to say this. What is laughable, to me, would be the presumption that any of these forecasts are free of statistical artifacts.
Regarding podcasts: I think maybe my collaborator Elliott Morris has gone on a podcast with Nate Silver? They’re both in the journalism biz and I’m guessing they could both communicate with the public better than I can.
I agree with everything you said.
What I’m saying is: There’s more to what Nate has said in the model than his post lists as reasons for differences. I think those reasons that he’s stated are worth unpacking more when looking for explanations or doing exploratory analysis and thinking through the artifacts. The reasons that I’ve seen you give to explain the differences I think are incomplete. For example, alignment theory, which I doubt Nate takes seriously, should be very low down on the list. And there’s lots more to list. That’s it.
Nate refuses to meet with Elliot on a pod because they had some twitter spats. That sucks.
That should read:
What I’m saying is: There’s more to what Nate has said in the model than this post lists as reasons for differences.
Actually working out how one would apply the 538 methodology for simulating correlated polling error leads to some pretty glaring pitfalls that could lead to artifacts like the negative correlations. To be fair to Anon, here is how I think I would do it. Just as a random number is drawn from an error distribution at the national and state levels, a random number is drawn for each of the demographic variables, representing demographic error at a national level. Then, this demographic error term is scaled according to the each state’s value in this demographic.
For example, let’s say Biden is winning the Urban vote 80-20. In one simulation, Biden overperforms his margin nationally by 10%, such that his actual margin is 85-15. If the United States is 81% urban, this means that his incremental vote share nationally is (85%-80%) x 81% = +4.1%. For a state like WA, which is 84% urban, the increment is going to be similar: (85%-80%) x 84% = +4.2%. With a state like MS, which is more rural (49% urban), the increment is going to be *smaller*: the incremental vote share will be (85%-80%) x 49% = +2.4%. But notice that it will never turn negative. The outcome in the two states will still be positively correlated, even with a particular demographic polling miss, as Andrew has repeatedly tried to explain. The outcome in this particular simulation is 64.1%, 47.4% for WA,MS instead of 60%, 45%. One thing I like about this method is that it is better able to account for polling misses at the extremes (red states redder and blue states bluer than initially thought), which is becoming increasingly more common and can be seen in the miscalibrated tails in the Economist forecast on past elections.
But observe that in order to run this simulation, we need to have a good model for polling error in general.
1. What is a reasonable data model for the distribution of polling error for Urban voters? Is it centred on 0 i.e. equally likely to underestimate Biden and Trump? How large is the variance? My prior is that the larger the demographic, the smaller the expected variance. Is 10% too large a draw?
2. As Joffre and others have observed, some of the variables are not in fact demographic variables but geographical. This becomes really questionable as one needs to answer what is an appropriate shape of the relationship between latitude/longitude and polling error. It really looks as though a linear relationship is implied as the simulations produce extreme outcomes only at the corners of the country (WA,CA,MS,AK,NJ).
3. Again, what is the appropriate size of polling error with increasing latitude/longitude? There is a real opportunity to screw things up here if the units are not properly calibrated. With demographic proportions, the boundaries of the (0,1) interval impose a natural limit on the size of the error term drawn (Biden cannot go beyond 100-0 in overperforming with Urban voters). But with geographical coordinates, the error term is potentially unbounded (a 1% error with every unit increase in longitude can go a very long way).
4. Most importantly, what is the joint distribution of polling error across all of the variables that 538 is trying to account for? We know that pollsters are much more likely to underrepresent non college educated whites and Hispanics (perhaps even simultaneously), but it is unlikely to underrepresent, say, the South while also under-representing Hispanics/Blacks. Polling errors from different demographics are often correlated or wash out. However, from 538’s methodology page, it sounds like the error terms are drawn one demographic per simulation. How many simulations should draw an error term from the race variables as opposed to education, income, geographical coordinates etc, etc? If these only come from inspired guesses, there’s a chance to get their joint distribution completely wrong.
My guess is that you only need the above ingredients to induce negative correlations: 1) error variances not properly bounded in size, especially in relation to geographical variables, 2) not accounting for the joint distribution of polling error across different variables and 3) some methodological choices preferring certain kinds of variables to draw polling error from, and because they are applied independently some improbable interactions may result in the aggregate. My bet is that WA/MS have too many simulations with polling errors in Biden’s favour in the South and Trump’s favour in the West, compounded with polling errors in Biden’s favour with Blacks and Trump’s favour with Whites and they are not being cancelled out.
Thanks, this is getting at my point. I would add that there’s more: the “uncertainty index” Nate notes (we don’t even really know how it works) and plenty of other factors like media-mentions. It’s not just a matter of correlated polling errors.
Hanif:
All of this is one reason why I prefer the Bayesian approach of estimating latent parameters in a generative model, rather than the data-first approach of starting with poll averages and then adding various fixes.
Hanif:
I think your example is helpful, but that one can still get negative correlations by considering suburban votes instead of urban votes. Imagine what happens if polls under-represent suburban voters. In states where suburbs lean Democrat, Biden’s actual state vote share can end up above the mean poll prediction. In states where suburbs lean Republican, Biden’s actual state vote share can end up below the mean poll prediction. In this way, a negative correlation can be induced between the first group of states and the second group of states in simulations from a model that accounts for the possibility that polls could under- or over-represent suburbs.
Besides intermediate population density/suburban representation in polls, other variables may also induce negative correlations.
fogpine:
Your example makes sense but I doubt 538 uses such a sophisticated model with interactions. At least, I don’t get that from the methodology page. They are explicit about using a regression model to predict *vote shares* for each state based on demographic and economic fundamentals, which may involve interactions, but not *polling error*. Maybe I’m mistaken. But I doubt that they could have taken such an approach even if they wanted to because the variables for polling error include a COVID-19 severity index and share of votes expected to be cast by mail. There is no historical data to model the joint distribution of these kinds of variables with polling error. Instead the approach looks to be a simple one of: for each variable, draw a random number from a plausible error distribution and scale it linearly with each state’s value in that variable.
My point was that if you are not modelling the joint distribution, and you are applying the error draw for each variable independently, you can end up with some implausible correlations. Especially, since, my impression is that 538 is trying to account for ‘anything can happen’ scenarios (which is a completely defensible modelling choice in my opinion), they may unintentionally draw from too many contrarian scenarios. A model of the joint distribution of polling error with various factors will likely find a lot of probability mass under the interaction between education x race, such that a lot of the draws will apply to states with high shares of non-college educated whites or Hispanics. But I doubt they have any draws related to urbanisation x partisanship, implying that the negative correlations were intentional (if they did, I’d love to hear about it! It is an uncommon but defensible modelling choice). Rather, the negative correlations could have been an artifact of too many independent draws from geographical variables in contrarian scenarios (imagine Biden overperforming in the South and Trump overperforming in the West), compounded by draws in the more predictable polling error scenarios (Biden overperforming with Black voters and Trump overperforming with White voters).
Andrew:
I believe your model does contain a model for the joint distribution of polling error with certain poll-level variables: states, polling method (IVR vs live caller) and time. I think if this can be extended with certain state-level variables (race x education), it will capture more of the obvious sources of correlated polling error without overextending it like 538 has.
Hanif:
Thanks for your response! I’m trying to make a more limited, but I think important point: You can get negative correlations between state predictions naturally, even without conditioning on popular vote share, state outcomes (like NJ’s), or anything else. All you need is a population subgroup X that poll results could have a systematic tendency to under- or over-represent, and that leans Democrat in some areas and Republican in others. For example, residents of suburbs. Other examples might be persons of intermediate age, of intermediate education, or who speak Spanish at home (e.g., related the Cuban American vote).*
The sword cuts both ways here: It’s being said that 538’s model has problems because negative correlations cannot really occur. But according to the same logic, once it has been shown that negative correlations can arise naturally, then it follows that models disallowing negative correlations have problems. This includes The Economist’s model: to my understanding, they found negative between-state correlations but deleted them (set them to 0) under the assumptions there is no natural mechanism for negative correlations to appear in the predictions.
It looks like you make a lot of great points about 538’s model and its limitations. Your points suggest several other important problems with 538’s work, but I can’t respond much to them because I know little about 538’s model beyond what I read on this blog. My familiarity is mostly with the Economist model.
Predicted *vote shares* and *polling error* may be specified as different terms in a model. However, on the eve of the election, voters are basically done deciding who they will vote for, so predicted vote share and poling error (polls being misrepresentative of who votes) become two views of the same thing, and building an interaction into one effects the other directly, even if they are technically specified as different terms.
* if polls insufficiently adjust/control/rake… for these variables
We’re just debating two different things here:
If you get that national forecast by averaging state forecasts that are not highly correlated, then you’ll just need to have implausibly wide intervals at the state level. That’s just math.
This is fine. Where I differ is in the explanations given, not in the basic math underneath it. Why not just stick to the facts when discussing what we know about where the uncertainty could have come from? This post hasn’t even touched on how he might have added state-level covid errors, fundraising, economic data (the GDP data is crazy right now), suppression etc… My objection again is not that the model isn’t doing what it should; it’s that you all made up some explanations that I think are just unnecessarily tangential.
For example, tou can also read this piece on 538 about realignment theory, where 538 basically throws it out, to get a sense of Nate’s thoughts. Why even include it as some kind of explanation? It discredits you. https://fivethirtyeight.com/features/trump-may-bring-a-republican-recalibration-not-a-realignment/
Anon:
If Biden wins 49 states but loses NJ, or various other possibilities implied by the Fivethirtyeight simulations, that would represent a realignment. I’m not saying that Nate believes there will be realignment, or that he set up his simulations based on a belief in realignment. I’m saying he set up his simulations with a lot of different features, each of which seemed to make sense, but when you put them together they imply these possibilities for realignment. It’s implicit in his model, even if he doesn’t believe it. Again, that’s fine: models are complicated and we all have things implicit in our model that we don’t believe.
One reason I mentioned realignment is that many of the commenters have defended the zero or negative correlations in the Fivethirtyeight simulations by saying that you’d expect that if the Republicans lose a lot of ground in Mississippi, that they’d win a lot in Washington. If that happened in a bunch of states, that would be a realignment. I don’t think such a realignment is going to happen during the campaign—certainly not during the last week of the campaign!—and our model pretty much rules it out. Many of our commenters think that such a realignment is a real possibility, but I think they’re misunderstanding the role of the uncertainties in the forecast. According to you, Nate doesn’t think a realignment will happen either; he’s just stuck with a model that allows it as a reasonable possibility. Your statement is that we should believe what Nate wrote in his prose more than what is implied by his simulations. That’s fine, I guess, but meanwhile the simulations are still sitting there!
So that’s where we differ because I don’t think it it your entailment logic here is firm. Again, I’m accounting for something like: New Jersey has a massive outbreak in covid; or New Jersey’s economy has a massive problem and Trump promises and delivers them an abundance of aid; or many people in New Jersey do not vote or leave the state for whatever reason. We can debate how improbable the errors are for those scenarios to occur but those explanations do not have hard requirement of realignment theory. They’re short-term, unlikely scenarios that don’t point to some kind of broader electorate repositioning. They also trace back to earlier explanations Silver has given, which, yes, for better or worse I’m willing to entertain.
Honestly realignment theory is considered kind of garbage (bless the heart of VO Key all the same) among political scientists? So when I saw it, plus the projection of Nate having injected errors maliciously, I got kind of annoyed because the post is so good otherwise.
I’m still not convinced that negative correlations aren’t baked in no matter how you set it up. I think Hanif is saying the same thing in a more sophisticated way.
The purpose of the 538 model is to plug in “Trump wins Pennsylvania” and see how the national forecast changes. Nate is hoping you won’t plug in “Trump wins NJ” because the model has to work pretty hard to make a national re-assessment off of that, and it will not do it well.
How do you do a national re-assessment on “Trump wins NJ?” You are limited by your original error bars. The 538 model shows Biden at +22% in NJ. When you enter “Trump wins NJ,” that is taken as established fact, while every other number has an error bar.
The interactive model can start by assuming that the sparse polling in NJ could be off by 10%. Now you still have 12% of error to account for. You could pick up a couple percent by assuming the national average is off (gotta be careful here because they are correlated), but now you are done with polling. The only way to account for the rest of the discrepancy is to tweak the fundamentals (I think Hanif and I are on the same page here, not sure). Your only option is to not only assume that the pollsters performed poorly by sampling nonrepresentationally, but that also many of the answers they received were inaccurate. The only moving parts in the model that allow you to assume that the answers given to the pollsters were wrong – as opposed to the pollsters surveying a nonrepresentational group, which is poll error – are the fundamentals, where the poll numbers are artificially bodged to account for things like education.
So the model has to find reasons for 10% more error than it can generate by assuming the polls are hard over at the rail of the error bar favoring Trump. As Hanif, fogpine and others have pointed out, some of the fundamentals can get really wonky between states, and NJ is extreme in some of the demographics.
Andrew wrote:
“According to you, Nate doesn’t think a realignment will happen either; he’s just stuck with a model that allows it as a reasonable possibility.”
It is not that the model “allows it as a possibility.” It is that the model is built to be interactive, and if you plug in “Trump wins NJ,” it is forced to treat that not only as plausible but as fact. The fundamental problem here is how to reconcile the rest of the model with a user-supplied factoid that can be outlandish but that has no error bar.
Anon:
Of course I don’t think Nate or anyone else on his team “injected errors maliciously.” I think they’re doing their best. It’s just a complicated problem, and you can be experienced and do your best but still mess up. I mess up all the time, and so I’m fully accepting of the idea that other people mess up too.
Matt:
You can include error terms that depend on geography and demography without introducing any negative correlations between states. I think Fivethirtyeight did something like that for previous elections, actually. I still think the negative and near-zero correlations and other artifacts of this year’s Fivethirtyeight forecasts are accidents, where they added a bunch of error terms without fully thinking through the implications.
Thanks for the pointer to the graphs by Adam Pearce (n.b. I’m not that Adam).
One of the most interesting results I see on that site is that both you and Fivethirtyeight have very sharp peaks on the DC vote, but that you disagree with each other pretty strongly. You have the median at 95.5%, they have the median at 91.8%. Your 95% confidence interval begins at 94.2%, but only 5.7% of Fivethirtyeight simulations have Biden receiving this large a proportion of the vote!!
This strikes me as a case where we can look at the actual result and most like have a “winner” and “loser” between the two models. Do you have any thoughts on why the difference is so great?
—
Additional question that anyone can answer: I’m very familiar with proper scoring rules as a way of judging forecasts, but in a case like this where each forecast gives a probability distribution over a range of possible vote proportions, we have more information than just looking at binary outcomes. In particular, with DC, there’s no way to distinguish between the two models using the binary outcome, because you both predict a Biden win with ~100% confidence.
So what I’d like to know is what the appropriate equivalent / extension of the proper scoring rule is for judging forecasts that provide a probability distribution for continuous outcomes. One obvious possibility seems to be looking at how likely it is to see a result at least as extreme as the actual one according to each model, but I’m not sure if that extracts all the information available if you just plug that probability into a scoring rule (e.g. take the logarithm of it).
Sorry, this is obviously an amateur question, but it’s something I’ve always been curious about.
Quick follow up on that second question. Looks like the Wikipedia article I was looking at is pretty incomplete, and there’s quite a bit of literature on this. In particular, “Predictive Inference Based on Markov Chain Monte Carlo Output” – Krüger et. al (2020) is extremely helpful. doi:10.1111/insr.12405
In particular, they have a easy to use R package, scoringRules, that can handle samples. I’ve had a little trouble getting it to work with Fivethirtyeight data, but it’s a start.
Adam:
1. I wouldn’t take either of the DC forecasts seriously. I doubt that either of these forecasters was really trying hard to get DC correct.
2. The way to evaluate such forecasts is not to look at the winner of the state but instead to compare the actual vote share to the forecast vote share distribution. See here, for example.
Question of clarification – when you did the state polls only experiment, were you only using polls from within the state itself? Or were you still using the between-state correlations to update the forecast in similar states? For example, letting Wisconsin polling affect the forecast in Michigan.
As you mentioned, it seems that 538 relies mostly on polls within the state, so it would be interesting to go to the extreme and see what happens when you *only* use those polls.
I revisualized Adam’s heatmaps as boxplots in this blog post. You can see the difference in state-state correlations between the two models more clearly. The FiveThirtyEight model, in addition to allowing a lot of negative state-state correlations, also has much larger ranges of correlations across the board. The top six rows of the chart are the most interesting. For example, for DC, the Economist model pretty much assumes independence but the FiveThirtyEight model has DC-stateX correlations that spread out over a wide range, including negative correlations.
I find this election modeling series of threads really fascinating, both from the political point of view and more importantly from the pedagogy of torturing the model for understanding its inner secrets.
I am trying to get a grip on the modeling workflow behind the analysis. I dont work with survey data, but big observational data sets. One takeaway from reading this thread is that one should set up to simulate different data distributions (e.g. shift the polls 3% more in favor) to then understand the resulting changes in the results. These simulations should be both for training data to understand how the model responds, as well as changes in testing data.
Are there other key generic steps to setting up “…release yourself from the perceived need to defend your model and instead work on understanding and improving it.” ?
Assume the 2016 polling errors persist, just for arguments sake. This leaves few states in play. ME-2 is NOT going Biden and NH is NOT going Trump. Modeling states which are even more skewed to one candidate with distributions is just a mistake. Don’t just remove the fat tails…remove the probability distributions altogether. For those that are heavily skewed, say 5% to anyone candidate, they should have skinnier tails. Fat tails should exist only on state with thin margins.
Brant:
This sort of thing has come up before. Even if we are only interested in forecasting the winner, it makes sense to model and predict (with uncertainty) the vote share in all of the states, as election outcomes in non-close states provide information about the outcomes in close states as well.