We’ve been writing a bit about some odd tail behavior in the Fivethirtyeight election forecast, for example that it was giving Joe Biden a 3% chance of winning Alabama (which seemed high), it was displaying Trump winning California as in “the range of scenarios our model thinks is possible” (which didn’t seem right), and it allowed the possibility that Biden could win every state except New Jersey (?), and that, in the scenarios where Trump won California, he only had a 60% chance of winning the election overall (which seems way too low).
My conjecture was that these wacky marginal and conditional probabilities came from the Fivethirtyeight team adding independent wide-tailed errors to the state-level forecasts: this would be consistent with Fivethirtyeight leader Nate Silver’s statement, “We think it’s appropriate to make fairly conservative choices especially when it comes to the tails of your distributions.” The wide tails allow the weird predictions such as Trump winning California. And independence of these extra error terms would yield the conditional probabilities such as the New Jersey and California things above. I’d think that if Trump were to win New Jersey or, even more so, California, that this would most likely happen only as part of a national landslide of the sort envisioned by Scott Adams or whatever. But with independent errors, Trump winning New Jersey or California would just be one of those things, a fluke that provides very little information about a national swing.
You can really only see this behavior in the tails of the forecasts if you go looking there. For example, if you compute the correlation matrix of the state predictors, this is mostly estimated from the mass of the distribution, as the extreme tails only contribute a small amount of the probability. Remember, the correlation depends on where you are in the distribution.
Anyway, that’s where we were until a couple days ago, when commenter Rui pointed to a file on the Fivethirtyeight website with the 40,000 simulations of the vector of forecast vote margins in the 50 states (and also D.C. and the congressional districts of Maine and Nebraska).
Now we’re in business.
I downloaded the file, read it into R, and created the variables that I needed:
library("rjson")
sims_538 <- fromJSON(file="simmed-maps.json")
states <- sims_538$states
n_sims <- length(sims_538$maps)
sims <- array(NA, c(n_sims, 59), dimnames=list(NULL, c("", "Trump", "Biden", states)))
for (i in 1:n_sims){
  sims[i,] <- sims_538$maps[[i]]
}
state_sims <- sims[,4:59]/100
trump_share <- (state_sims + 1)/2
biden_wins <- state_sims < 0
trump_wins <- state_sims > 0
As a quick check, let’s compute Biden’s win probability by state:
> round(apply(biden_wins, 2, mean), 2)
  AK   AL   AR   AZ   CA   CO   CT   DC   DE   FL   GA   HI   IA   ID   IL   IN   KS   KY   LA   M1   M2   MA   MD   ME   MI
0.20 0.02 0.02 0.68 1.00 0.96 1.00 1.00 1.00 0.72 0.50 0.99 0.48 0.01 1.00 0.05 0.05 0.01 0.06 0.98 0.51 1.00 1.00 0.90 0.92
  MN   MO   MS   MT   N1   N2   N3   NC   ND   NE   NH   NJ   NM   NV   NY   OH   OK   OR   PA   RI   SC   SD   TN   TX   UT
0.91 0.08 0.10 0.09 0.05 0.78 0.00 0.67 0.01 0.01 0.87 0.99 0.97 0.90 1.00 0.44 0.01 0.97 0.87 1.00 0.11 0.04 0.03 0.36 0.04
  VA   VT   WA   WI   WV   WY
0.99 0.99 0.99 0.86 0.01 0.00
That looks about right. Not perfect—I don’t think Biden’s chances of winning Alabama are really as high as 2%—but this is what the Fivethirtyeight is giving us, rounded to the nearest percent.
And now for the fun stuff.
What happens if Trump wins New Jersey?
> condition <- trump_wins[,"NJ"]
> round(apply(trump_wins[condition,], 2, mean), 2)
  AK   AL   AR   AZ   CA   CO   CT   DC   DE   FL   GA   HI   IA   ID   IL   IN   KS   KY   LA   M1   M2   MA   MD   ME
0.58 0.87 0.89 0.77 0.05 0.25 0.10 0.00 0.00 0.79 0.75 0.11 0.78 0.97 0.05 0.87 0.89 0.83 0.87 0.13 0.28 0.03 0.03 0.18
  MI   MN   MO   MS   MT   N1   N2   N3   NC   ND   NE   NH   NJ   NM   NV   NY   OH   OK   OR   PA   RI   SC   SD   TN
0.25 0.38 0.84 0.76 0.76 0.90 0.62 1.00 0.42 0.96 0.97 0.40 1.00 0.16 0.47 0.01 0.53 0.94 0.08 0.39 0.08 0.86 0.90 0.85
  TX   UT   VA   VT   WA   WI   WV   WY
0.84 0.91 0.16 0.07 0.07 0.50 0.78 0.97
So, if Trump wins New Jersey, his chance of winning Alaska is . . . 58%??? That’s less than his chance of winning Alaska conditional on losing New Jersey.
Huh?
Let’s check:
> round(mean(trump_wins[,"AK"] [trump_wins[,"NJ"]]), 2)
[1] 0.58
> round(mean(trump_wins[,"AK"] [biden_wins[,"NJ"]]), 2)
[1] 0.80
Yup.
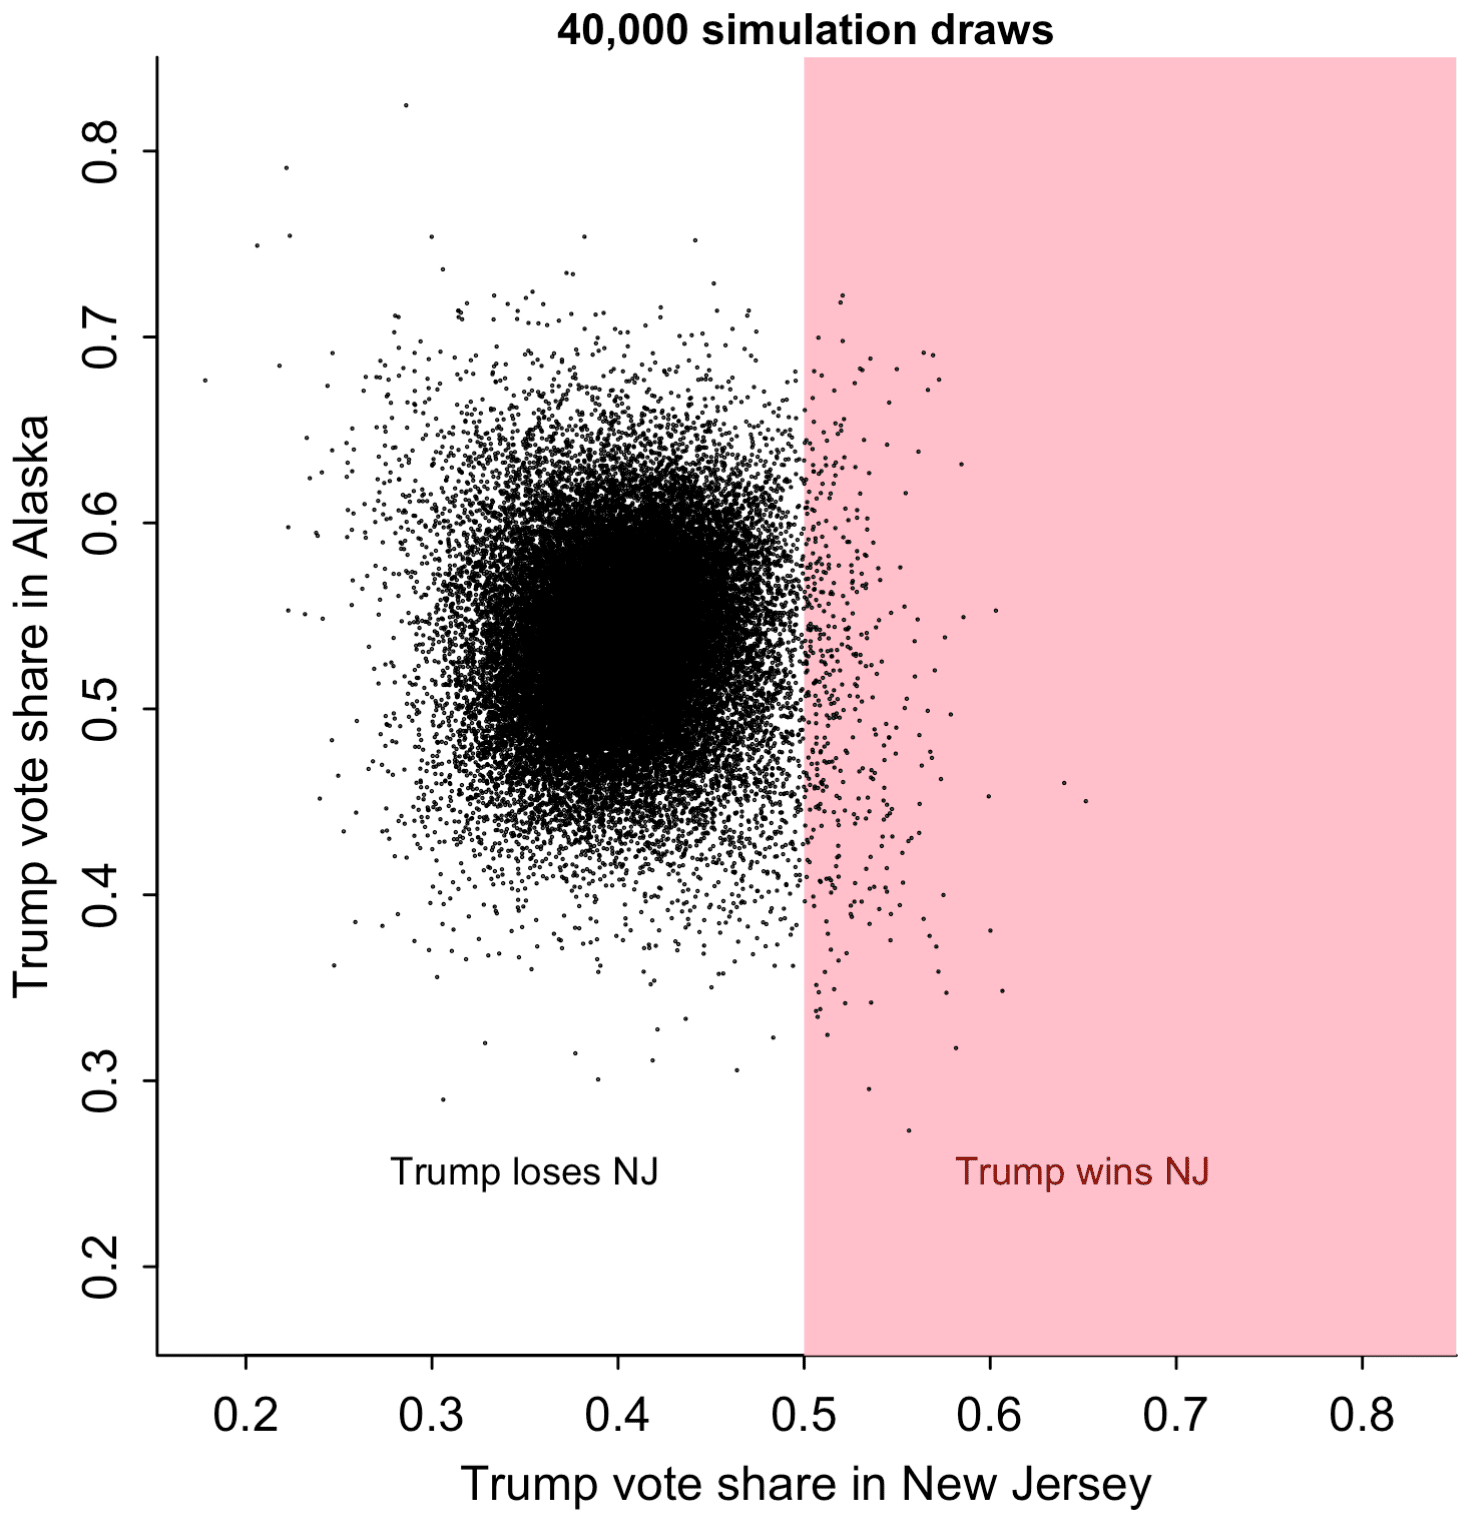
Whassup with that? How could that be? Let’s plot the simulations of Trump’s vote share in the two states:
par(mar=c(3,3,1,1), mgp=c(1.7, .5, 0), tck=-.01)
par(pty="s")
rng <- range(trump_share[,c("NJ", "AK")])
plot(rng, rng, xlab="Trump vote share in New Jersey", ylab="Trump vote share in Alaska", main="40,000 simulation draws", cex.main=0.9, bty="l", type="n")
polygon(c(0.5,0.5,1,1), c(0,1,1,0), border=NA, col="pink")
points(trump_share[,"NJ"], trump_share[,"AK"], pch=20, cex=0.1)
text(0.65, 0.25, "Trump wins NJ", col="darkred", cex=0.8)
text(0.35, 0.25, "Trump loses NJ", col="black", cex=0.8)
The scatterplot is too dense to read at its center, so I'll just pick 1000 of the simulations at random and graph them:
subset <- sample(n_sims, 1000)
rng <- range(trump_share[,c("NJ", "AK")])
plot(rng, rng, xlab="Trump vote share in New Jersey", ylab="Trump vote share in Alaska", main="Only 1000 simulation draws", cex.main=0.9, bty="l", type="n")
polygon(c(0.5,0.5,1,1), c(0,1,1,0), border=NA, col="pink")
points(trump_share[subset,"NJ"], trump_share[subset,"AK"], pch=20, cex=0.1)
text(0.65, 0.25, "Trump wins NJ", col="darkred", cex=0.8)
text(0.35, 0.25, "Trump loses NJ", col="black", cex=0.8)

Here's the correlation:
> round(cor(trump_share[,"AK"], trump_share[,"NJ"]), 2)
[1] 0.03
But from the graph with 40,000 simulations above, it appears that the correlation is negative in the tails. Go figure.
OK, fine. I only happened to look at Alaska because it was first on the list. Let's look at a state right next to New Jersey, a swing state . . . Pennsylvania.
> round(mean(trump_wins[,"PA"] [trump_wins[,"NJ"]]), 2)
[1] 0.39
> round(mean(trump_wins[,"PA"] [biden_wins[,"NJ"]]), 2)
[1] 0.13
OK, so in the (highly unlikely) event that Trump wins in New Jersey, his win probability in Pennsylvania goes up from 13% to 39%. A factor of 3! But . . . it's not enough. Not nearly enough. Currently the Fivethirtyeight model gives Trump a 13% chance to win in PA. Pennsylvania's a swing state. If Trump wins in NJ, then something special's going on, and Pennsylvania should be a slam dunk for the Republicans.
OK, time to look at the scatterplot:

The simulations for Pennsylvania and New Jersey are correlated. Just not enough. At lest, this still doesn't look quite right. I think that if Trump were to do 10 points better than expected in New Jersey, that he'd be the clear favorite in Pennsylvania.
Here's the correlation:
> round(cor(trump_share[,"PA"], trump_share[,"NJ"]), 2)
[1] 0.43
So, sure, if the correlation is only 0.43, it almost kinda makes sense. Shift Trump from 40% to 50% in New Jersey, then the expected shift in Pennsylvania from these simulations would be only 0.43 * 10%, or 4.3%. But Fivethirtyeight is predicting Trump to get 47% in Pennsylvania, so adding 4.3% would take him over the top, at least in expectation. Why, then, is the conditional probability, Pr(Trump wins PA | Trump wins NJ) only 43%, and not over 50%? Again, there's something weird going on in the tails. Look again at the plot just above: in the center of the range, x and y are strongly correlated, but in the tails, the correlation goes away. Some sort of artifact of the model.
What about Pennsylvania and Wisconsin?
> round(mean(trump_wins[,"PA"] [trump_wins[,"WI"]]), 2)
[1] 0.61
> round(mean(trump_wins[,"PA"] [biden_wins[,"WI"]]), 2)
[1] 0.06
These make more sense. The correlation of the simulations between these two states is a healthy 0.81, and here's the scatterplot:

Alabama and Mississippi also have a strong dependence and give similar results.
At this point I graphed the correlation matrix of all 50 states. But that was too much to read, so I picked a few states:
some_states <- c("AK","WA","WI","OH","PA","NJ","VA","GA","FL","AL","MS")
I ordered them roughly from west to east and north to south and then plotted them:
cor_mat <- cor(trump_share[,some_states])
image(cor_mat[,rev(1:nrow(cor_mat))], xaxt="n", yaxt="n")
axis(1, seq(0, 1, length=length(some_states)), some_states, tck=0, cex.axis=0.8)
axis(2, seq(0, 1, length=length(some_states)), rev(some_states), tck=0, cex.axis=0.8, las=1)
And here's what we see:

Correlations are higher for nearby states. That makes sense. New Jersey and Alaska are far away from each other.
But . . . hey, what's up with Washington and Mississippi? If NJ and AK have a correlation that's essentially zero, does that mean that the forecast correlation for Washington and Mississippi is . . . negative?
Indeed:
> round(cor(trump_share[,"WA"], trump_share[,"MS"]), 2)
[1] -0.42
And:
> round(mean(trump_wins[,"MS"] [trump_wins[,"WA"]]), 2)
[1] 0.31
> round(mean(trump_wins[,"MS"] [biden_wins[,"WA"]]), 2)
[1] 0.9
If Trump were to pull off the upset of the century and win Washington, it seems that his prospects in Mississippi wouldn't be so great.
For reals? Let's try the scatterplot:
rng <- range(trump_share[,c("WA", "MS")])
plot(rng, rng, xlab="Trump vote share in Washington", ylab="Trump vote share in Mississippi", main="40,000 simulation draws", cex.main=0.9, bty="l", type="n")
polygon(c(0.5,0.5,1,1), c(0,1,1,0), border=NA, col="pink")
points(trump_share[,"WA"], trump_share[,"MS"], pch=20, cex=0.1)
text(0.65, 0.3, "Trump wins WA", col="darkred", cex=0.8)
text(0.35, 0.3, "Trump loses WA", col="black", cex=0.8)
What the hell???

So . . . what's happening?
My original conjecture was that the Fivethirtyeight team was adding independent long-tailed errors to the states, and the independence was why you could get artifacts such as the claim that Trump could win California but still lose the national election.
But, after looking more carefully, I think that's part of the story---see the NJ/PA graph above---but not the whole thing. Also, lots of the between-state correlations in the simulations are low, even sometimes negative. And these low correlations, in turn, explain why the tails are so wide (leading to high estimates of Biden winning Alabama etc.): If the Fivethirtyeight team was tuning the variance of the state-level simulations to get an uncertainty that seemed reasonable to them at the national level, then they'd need to crank up those state-level uncertainties, as these low correlations would cause them to mostly cancel out in the national averaging. Increase the between-state correlations and you can decrease the variance for each state's forecast and still get what you want at the national level.
But what about those correlations? Why do I say that it's unreasonable to have a correlation of -0.42 between the election outcomes of Mississippi and Washington? It's because the uncertainty doesn't work that way. Sure, Mississippi's nothing like Washington. That's not the point. The point is, where's the uncertainty in the forecast coming from? It's coming from the possibility that the polls might be way off, and the possibility that there could be a big swing during the final weeks of the campaign. We'd expect a positive correlation for each of these, especially if we're talking about big shifts. If we were really told that Trump won Washington, then, no, I don't think that should be a sign that he's in trouble in Mississippi. I wouldn't assign a zero correlation to the vote outcomes in New Jersey and Pennsylvania either.
Thinking about it more . . . I guess the polling errors in the states could be negatively correlated. After all, in 2016 the polling errors were positive in some states and negative in others; see Figure 2 of our "19 things" article. But I'd expect shifts in opinion to be largely national, not statewide, and thus with high correlations across states. And big errors . . . I'd expect them to show some correlation, even between New Jersey and Alaska. Again, I'd think the knowledge that Trump won New Jersey or Washington would come along with a national reassessment, not just some massive screw-up in that state's polls.
In any case, Fivethirtyeight's correlation matrix seems to be full of artifacts. Where did the weird correlations come from? I have no idea. Maybe there was a bug in the code, but more likely they just took a bunch of state-level variables and computed their correlation matrix, without thinking carefully about how this related to the goals of the forecast and without looking too carefully at what was going on. In the past few months, we and others have pointed out various implausibilities in the Fivethirtyeight forecast (such as that notorious map where Trump wins New Jersey but loses all the other states), but I guess that once they had their forecast out there, they didn't want to hear about its problems.
Or maybe I messed up in my data wrangling somehow. My code is above, so feel free to take a look and see.
As I keep saying, these models have lots of moving parts and it's hard to keep track of all of them. Our model isn't perfect either, and even after the election is over it can be difficult to evaluate the different forecasts.
One thing exercise demonstrates is the benefit of putting your granular inferences online. If you're lucky, some blogger might analyze your data for free!
Why go to all this trouble?
Why go to all the above effort rooting around in the bowels of some forecast?
A few reasons:
1. I was curious.
2. It didn't take very long to do the analysis. But it did then take another hour or so to write it up. Sunk cost fallacy and all that. Perhaps next time, before doing this sort of analysis, I should estimate the writing time as well. Kinda like how you shouldn't buy a card on the turn if you're not prepared to stay in if you get the card you want.
3. Teaching. Yes, I know my R code is ugly. But ugly code is still much more understandable than no code. I feel that this sort of post does a service, in that it provides a model for how we can do real-time data analysis, even if in this case the data are just the output from somebody else's black box.
No rivalry
Let me emphasize that we're not competing with Fivethirtyeight. I mean, sure the Economist is competing with Fivethirtyeight, or with its parent company, ABC News---but I'm not competing. So far the Economist has paid me $0. Commercial competition aside, we all have the same aim, which is to assess uncertainty about the future given available data.
I want both organizations to do the best they can do. The Economist has a different look and feel from Fivethirtyeight---just for example, you can probably guess which of these has the lead story, "Who Won The Last Presidential Debate? We partnered with Ipsos to poll voters before and after the candidates took the stage.", and which has a story titled, "Donald Trump and Joe Biden press their mute buttons. But with 49m people having voted already, creditable performances in the final debate probably won’t change much." But, within the constraints of their resources and incentives, there are always possibilities for improvement.
P.S. There's been a lot of discussion in the comments about Mississippi and Washington, which is fine, but the issue is not just with those two states. It's with lots of states with weird behavior in the joint distribution, such as New Jersey and Alaska, which was where we started. According to the Fivethirtyeight model, Trump is expected to lose big in New Jersey and is strong favorite, with a 80% chance of winning, in Alaska. But the model also says that if Trump were to win in New Jersey, that his chance of winning in Alaska would drop to 58%! That can't be right. At least, it doesn't seem right.
And, again, when things don't seem right, we should examine our model carefully. Statistical forecasts are imperfect human products. It's no surprise that they can go wrong. The world is complicated. When a small group of people puts together a complicated model in a hurry, I'd be stunned if it didn't have problems. The models that my collaborators and I build all have problems, and I appreciate when people point these problems out to us. I don't consider it an insult to the Fivethirtyeight team to point out problems in their model. As always: we learn from our mistakes. But only when we're willing to do so.
P.P.S. Someone pointed out this response from Nate Silver:
Our [Fivethirtyeight's] correlations actually are based on microdata. The Economist guys continually make weird assumptions about our model that they might realize were incorrect if they bothered to read the methodology.
I did try to read the methodology but it was hard to follow. That's not Nate's fault; it's just hard to follow any writeup. Lots of people have problems following my writeups too. That's why it's good to share code and results. One reason we had to keep guessing about what they were doing at Fivethirtyeight is that the code is secret and, until recently, I wasn't aware of simulations of the state results. I wrote the above post because once I had those simulations I could explore more.
In that same thread, Nate also writes:
I do think it's important to look at one's edge cases! But the Economist guys tend to bring up stuff that's more debatable than wrong, and which I'm pretty sure is directionally the right approach in terms of our model's takeaways, even if you can quibble with the implementation.
I don't really know what he means by "more debatable than wrong." I just think that (a) some of the predictions from their model don't make sense, and (b) it's not a shock that some of the predictions don't make sense, as that's how modeling goes in the real world.
Also, I don't know what he means by "directionally the right approach in terms of our model's takeaways." His model says that, if Trump wins New Jersey, that he only has a 58% chance of winning Alaska. Now he's saying that this is directionally the right approach. Does that mean that he thinks that, if Trump wins New Jersey, that his chance of winning in Alaska goes down, but maybe not to 58%? Maybe it goes down from 80% to 65%? Or from 80% to 40%? The thing is, I don't think it should go down at all. I think that if things actually happen so that Trump wins in New Jersey, that his chance of winning Alaska should go up.
What seems bizarre to me is that Nate is so sure about this counterintuitive result, that he's so sure it's "directionally the right approach." Again, his model is complicated. Lots of moving parts! Why is it so hard to believe that it might be messing up somewhere? So frustrating.
P.P.P.S. Let me say it again: I see no rivalry here. Nate's doing his best, he has lots of time and resource constraints, he's managing a whole team of people and also needs to be concerned with public communication, media outreach, etc.
My guess is that Nate doesn't really think that, a NJ win for Trump would make it less likely for him to win Alaska; it's just that he's really busy right now and he's rather reassure himself that his forecast is directionally the right approach than worry about where it's wrong. As I well know, it can be really hard to tinker with a model without making it worse. For example, he could increase the between-state correlations by adding a national error term, or by adding national and regional error terms, but then he'd have to decrease the variance within each state to compensate, and then there are lots of things to check, lots of new ways for things to go wrong---not to mention the challenge of explaining to the world that you've changed your forecasting method. Simpler, really, to just firmly shut that Pandora's box and pretend it had never been opened.
I expect that sometime after the election's over, Nate and his team will think about these issues more carefully and fix their model in some way. I really hope they go open source, but even if they keep it secret, as long as they release their predictive simulations we can look at the correlations and try to help out.
Similarly, they can help out with us. If there are any particular predictions from our model that Nate thinks don't make sense, he should feel free to let us know, or post it somewhere that we will find it. A few months ago he commented that our probability of Biden winning the popular vote seemed too high. We looked into it and decided that Nate and other people who'd made that criticism were correct, and we used that criticism to improve our model; see the "Updated August 5th, 2020" section at the bottom of this page. And our model remains improvable.
Let me say this again: the appropriate response to someone pointing out a problem with your forecasts is not to label the criticism as a "quibble" that is "more debatable than wrong" or to say that you're "directionally right," whatever that means. How silly that is! Informed criticism is a blessing! You're lucky when you get it, and use that criticism as an opportunity to learn and to do better.
I have trouble reasoning about these tail probabilities. My intuition is that a uniform swing in vote share can only get you so far. If a candidate wins a massive upset in a particular state, then it seems more likely that it was due to some outlier event in that particular state rather than a huge national swing. A win in a close state may be predictive of a national/regional swing, but I am not sure how predictive a massive upset is if it is outside the range of plausible national/regional swings. If a particular state is so far out of line with expectations, are we still confident in how states will move together? Maybe it depends on prior belief of how much states can shift independent of each other relative to prior belief on how much states can swing together.
N:
Sure, but the issue with the correlations arises with smaller swings as well.
Yes, but the whole point is how big of a swing. If you wake up November 4 and Trump has won California, what happened? In the meaty part of the curve maybe the correlations are strong, but in the tails I’m not so sure…
N:
California’s off the charts, but Fivethirtyeight gives Trump a 1% chance of winning New Jersey. If I wake up in the morning and find that Trump won New Jersey, then I think what happened was a combination of large polling errors and a large swing in voter preferences. In that case, yes, I’d be pretty damn sure that Trump won Alaska too. I certainly don’t think that being told that Trump won New Jersey would lower his chance of winning Alaska.
I tend to agree with Nate Silver that these issues seem more debatable than wrong. There seems to be a lot of comments here where people somewhat agree with your argument, but also raise a lot of issues worthy of discussion.
I also tend to agree with Nate Silver that their approach is directionally right in that they are sampling over demographic variables versus what you described as a “hack” to make a plausible correlation matrix. The sampling over variables seems easy to reason about, but specifying the (average?) correlation matrix seems challenging.
N:
If you were able to learn that Trump won New Jersey, would that lower your estimate of his chance of winning Alaska? This seems directionally wrong to me. Really.
As to “more debatable than wrong”: the outcomes are uncertain, so nothing is flat-out wrong. That said, a model that regularly produces predictions such as Trump winning New Jersey but losing all the other states, or Biden winning every state except Wyoming or Vermont . . . that seems both debatable and wrong. What I think is mistaken is the presumption that, just because something has the Fivethirtyeight label, that there should be some sort of presumption that it is correct. The people who made this forecast are smart professionals, but they’re just people, and statistical modeling is complicated. People fitting statistical models make mistakes. It happens all the time.
I have no problem with Fivethirtyeight using demographic and political information to capture uncertainty. But then once they’ve done it, it’s time to check to see if the results make sense. To put it another way, just cos they’re using demographic and political information, that doesn’t necessarily mean that they’re doing something reasonable.
I don’t know about the numbers (and being from Europe I have a lot of opinion for rather little information) but in general I would be highly suspicious of a model that enforces positive correlations. Voting is a multidimensional problem and in particular making it more likely to be voted for by some voters necessarily makes it more unlikely to be voted for by others. The easiest example is probably the abortion debate, “coming out” either way risks offending a significant portion of the populous. And from my point of view a significant hunk of the “Trump wins New Jersey” scenarios should be due to “something other than polling error”.
Now I do think it is your (probably implicit) assumption, that the majority of the uncertainty comes from statistical sources (polling error, finite sample set and friends, aka correlations of those). But I think what 538, in my opinion rightly, tries to model goes beyond that. On the one hand they absolutely have to model polling errors with all their correlations and stuff, but on the other hand they also model things that change voter preference.
I tend to agree with you that they seem to add something “too far and too uncorrelated” to their model. I.e. their (probably also implicit) bias is a white noise state. And reality just isn’t that way, there are correlations but the case “Biden wins Alaska” contains both “everyone votes Biden” _and_ “Biden turns right” (same for Trump and CA/NJ obviously) and one of those incurs a cost.
Ultimately I think this shows more the unreliable nature of linear correlations than anything else. In this sense I’d agree with Nate’s point of it being more a thing of discussion than of being wrong. Since they are limited to historical data I doubt that you could find sufficient examples to adequately backtest “Trump wins CA” anyways.
PS: I do think it is sad that they do not grant access to their model. In my opinion the value of their work comes out of their knowledge and insights gained, ie their commentary.
It would appear that this NJ/AK “error” is due *not* to the model trying to answer the Q “if *Donald Trump*, *Republican*, wins NJ, what is his odds of winning Alaska?”, but rather “What are the odds of the winner of NJ (whoever it might be) also winning Alaska?”
Or at least, it’s a component of the model, in addition to components that factor in particular elements like *Donald Trump*, *Republican*, Conservative, etc.
I suspect that if you look at presidential elections over the past 60 years, the winner of NJ was less likely to also win AK (and vice versa). So in a sense, that component would be “directionally correct”. (and given the output their model generates, they probably should reduce the weight of this particular component.
First, thanks for all you do. Just discovered your blog and love it.
Second, I see where you are coming from with this: ” I certainly don’t think that being told that Trump won New Jersey would lower his chance of winning Alaska.”, however I feel that if you just replace “Trump” with “Candidate X” it actually makes a ton of sense. I’m from WA, and the things a candidate needs to say, do, and believe in order to win this state are probably largely mutually exclusive with what they would need to say, do, and believe in order to win MS or KY. If you don’t stake out a liberal position on climate change and gun control, you’re DOA in WA. If you do, you’re probably DOA in KY. If I didn’t know which candidate was being talked about (and bringing with me all my understanding of their party and coalition) I would feel pretty confident that the one who won NJ didn’t win AK.
That said, if 538’s model incorporates some info about who is the R and who is the D, then those results seem wrong because it seems more likely (to me personally) that Trump winning NJ would come as a part of a landslide win rather than a party realignment.
You are way more familiar with this stuff than I am, am I off base here?
Trump’s first campaign promised a lot of breaks from Republican orthodoxy, particularly on trade and social security, and on replacing Obamacare with something better. None of that was delivered, and some wasn’t even plausible, but that certainly wasn’t obvious to all voters ahead of the 2016 election. There were reasons (independent of Clinton) for some voters to have Bernie and Trump as first and second choices.
I don’t expect this election to be a re-alignment, particularly if that one wasn’t, but tail distribution means we’re already talking about “something unexpected happened”. Maybe that was a re-alignment. Maybe it was a previously unrecognized demographic split, like education is now presumed to be for whites, where NJ is at one extreme and AK may be at the other. Maybe it was something quirky about NJ, like whatever got them not just a Republican governor, but Chris Christie in particular. Maybe it was even some sort of bribe of NJ that costs him votes everywhere else.
I think it is reasonable for results in the 1% range to carry more than their share of “something we thought we knew just broke” results, which will mechanically reduce the correlations with other states. Reducing to negative might be too strong — but it also might not, or it might just reflect sampling error from the relatively small number of cases within that 1%.
Fantastic breakdown. Appreciate the time you took to write it up too. Having the code in there is great!
[re-posted because it looked like my first try didn’t work]
I just saw this page yesterday, on the same subject of oddnesses in the 538 model –
https://www.thestreet.com/mishtalk/politics/there-are-major-flaws-in-538s-do-it-yourself-election-model
One conclusion –
“The inherent problem is 538 made no distinction between Trump winning by 0.5% or Trump winning by 2.5%.
To the interactive model, a win is a win”
Tom, I think this is a good point. It seems plausible 538 has different metrics to test the model.
Andrew, what metrics do you plan to look at after the election to compare model results between yours and 538s?
(super informative analysis btw)
Hi
For the most part totally agree. But to play devil’s advocate, there are some things that could cause an anticorrelated shift in WA and MS. Suppose Trump had appointed a clearly pro-choice judge to the Supreme Court, endorsed the Green New Deal and appointed AOC secretary of climate? This is an extreme example of a type of policy stance that could cause strongly uncorrelated response, at least in normal elections. (Andrew, have you thought about this year’s election in the context of the no free lunch theorems?)
Back to my general agreement.
In the NJ/PA plot, it seems weird that there are more outliers in the anticorrelated area than along the correlation axis.
To me it seems that small deviations from the center, caused by polling error, sampling, etc. would be less correlated than large deviations that would have to be caused by some sort of national shift in the race. Maybe this is already in the 538 model., but then I would expect more outliers along the diagonal.
Carl:
Yeah, I think something artifactual is going on with the addition of these different t distributions on different linear combinations of the state vote shares.
Super interesting. Thanks for taking the time Andrew!
For those dense scatterplots does transperency help to make them more legible? Just a thought!
I really like the transparency trick. I would have done that before subsampling myself
I think a hex bin would look nice
I’m a proponent of stat_density_2d() in these settings.
ggplot2::geom_hex + viridis::scale_fill_viridis
Nice find. I agree that this seems wrong. I wonder whether he has a sort of ideologue effect in the model, wherein a candidate doing well in a blue state means they must be very liberal, and so will do poorly in a red state, and vice versa. This might make sense if the Democrat is doing really well in a blue state, but as you say if the Republican is doing really well in a blue state, that probably means they’re winning everywhere in a landslide. So I wonder whether he has a plausible ideologue effect in there, but hasn’t interacted it with candidate party in the right way. In any case, very interesting.
Why would he interact it with candidate party?
You can get this effect based solely on demographics. If Trump were to suddenly change his rhetoric to be anti-rural and pro-urban, then he’d probably get a bump in NJ and a slump in AK. The negative correlations between states seems like an attempt to capture late-race policy shifts that could upend the race. Maybe keeping those black-swan scenarios in is a good thing. I can see how a desperate candidate might do a 180 if they’ve got no other choice.
That said, I think Andrew is right in assuming that what I just said it far less likely than systemic polling error. Maybe the state-level correlations could be attenuated by some factor relating to national polarization?
Danny:
Yes, there are many things that could be going on, and some will have negative correlations between states. I just think all the correlations would be positive when all sources of uncertainty are included.
The problem with this interpretation is that it takes a priori the assumption that the model is trying to account for the possibility that a candidate completely reverses his position, and that is an unreasonable premise.
The most likely black swan event in this election would be something coming to light about one of the candidates such that they were rendered truly unelectable. For example, it being revealed that Biden is a child pornographer, or that he was a key co-conspirator of Epstein, etc. It’s a race between two people, after all.
Not determining correlations between states in a coherent way is a problem, but what’s even more bizarre is that there are no hard-stops in 538’s model. Like sure, these are what the numbers say, but numbers don’t know anything about the reality they are being used to describe. We do. Sanity checks are of utmost importance when attempting to model reality because otherwise you get genuine nonsense like the 538 model is putting out at the tails. In physics these checks take the form of ensuring that only positive, non-imaginary results are actually physical, or checking the extreme possibilities because that should be the place where approximations are most accurate. Here, a sanity check would be California never going for Trump, or if it does the entire country does.
These do have to be done by hand, of course, and need to be stated as part of the model, but seeing these kind of results makes me question the overall reliability of 538’s model.
For the scatter plots, it may be helpful to color each of the points by their correlation value and a chosen colormap to investigate how the correlations are structured. If the structure isn’t what it should be (eg Trump winning California better positively correlate with Trump winning all 50 states) then there’s definitely something systematically wrong about the tail modeling, just like you found here.
>>Here, a sanity check would be California never going for Trump, or if it does the entire country does.
I think part of the issue is realignments. The red/blue affiliations of states have changed over time – so I think it might be intentional that, say, CA isn’t hard-coded to be always blue.
True, and that’s what makes this tricky. Still, without this kind of manual modification we get the strange behavior noted in the analysis above. That’s due to there simply being very little information about those outcomes, which simply haven’t happened many times (or at all) so the model is running blind there.
Silver is correct to be very wary of this sort of thing because it’d be easy to nudge the correlation values to satisfy known and unknown programmer biases, but ultimately assumptions have to be made. Ideally, they’d use a stated heuristic to match the model results to what we consider the extreme ends of possibility, then show the differences in these edge cases with and without that heuristic. Example: Each election cycle, they could identify a few states that currently act as extremes and check how interstate correlations are structured. If they are nonsense, the model needs modification.
Realignment can happen, but hopefully polling information is accurate enough to determine whether that is happening. If it’s not then the model will be wholly inadequate anyway since the model relies on good enough polling data. If the data is good enough for the model, we would be able to notice a realignment.
I think Silver is resistant to this primarily because it means they might have to modify the model mid-stream, which he is against on principle. I agree with this (a model shouldn’t be modified because we don’t like the results), but this is a strange enough case that seems to warrant at least an investigative response.
The assumption that certain states will be reliably more Republican (or Democratic) is almost certainly too strong, and I’m betting that Nate Silver is acutely aware of this.
Particularly before 2016, many national pundits were assuming that Michigan (where he grew up) was safely Democratic in all but a landslide. In reality, the Bush, McCain, and Romney campaigns all had Michigan-specific screwups that cost them a lot of normally loyal Republican voters. The US Senate also had candidate effects, but for 20 years Republicans retained pretty solid control of the legislature, courts, statewide executive offices (excepting only Granholm … though 2018 changed things), balance of US House elections … I suspect his change to state partisanship scores (to put 1/4 of the weight on state legislative races, instead of national contests) was partly inspired by this.
Also note that Alaska in particular is known for being both hard to poll and a bad fit for the D/R linear model.
Those negative correlations do not look good. Curious what Nate Silver will say about them.
In case it helps your analysis: in a recent podcast Nate said that he uses a t-distribution for his “thick” trails. (I thought distributions with undefined variance had thick tails, but according to Wikipedia just being thicker than a normal distribution is enough.)
This has to be about demographics, as Danny already suggested. My theory is that this is about modeling errors in poll weighting. Maybe a common kind of error in polls is that the national polls are reasonably accurate, but the state polls are off due to misunderstanding which demographic groups the vote is coming from. That is, if polls are wildly underestimating how well Trump is doing with whatever demographics he’d need to win Washington, then the polls are most likely overestimating how he’s doing with other demographic groups (including the ones he’d need to win Mississippi). Isn’t this the kind of error that happened in 2016? National polls were not off by much, but there were large cancelling errors among demographic subgroups (in particular, Trump doing better than expected in the midwest and with non-college educated whites, and doing worse than expected on the west coast and with college educated whites).
There are very few pollsters willing to find out how the Norwegian counties in Minnesota and Wisconsin are trending, how to segment Arizonans by generation, how many Venezuelans there are now that weren’t around in 2016, how to find “tells” about respondent honesty, how to find voters who are normally ignored because they don’t respond to those they don’t trust. Silver certainly has the resources to do this type of legwork, but he doesn’t. So, he can’t predict with any accuracy.
A poll of the “Norwegian counties in Minnesota and Wisconsin” would be even more expensive than a regular state poll, because it is so much harder to locate valid respondents. It would help calibrate polls of those states, or the Michigan’s UP (which accounts for about 1/3 of a Congressional district), but not much else. Nate has the resources to do it for a few specialized Demographics, but there are hundreds of them out there, if not more. (Also, what it Norwegian towns and Finnish towns feel differently? How much detail would you need to even detect that, when they’re in the same counties, but in different proportions?)
If Trump does what he has to do in order to win Washington, he will naturally destroy his support in Mississippi.
Fivethirtyeight is just silly. There are only four states that really count: Texas, California, New York, and Florida. Only if those four are split two and two, then we start looking at other states. In other words, if Biden wins Florida, it’s game-over. …and/because that includes the principle that what a candidate does in one state, bleeds into neighboring states.
I bet you’ve nailed the problem.
It makes sense that in general, Washington and Mississippi are negatively correlated. If I’m building a model where the only thing I know is that a candidate is popular in Washington, I’ll model that candidate as struggling in Mississippi. But the general rule breaks down for the edge case where the “opposite party” candidate massively outperforms expectations in MS or WA. A world in which Trump just won Washington is a world where Trump is almost running the table. Ditto if Biden wins Mississippi.
It’s not clear to me whether edge case problems in the 538 model this year (this isn’t the only one, as a lot of people have pointed out) are significant enough to matter when it comes to the overall model performance outside of the extreme tails. Their basic forecast seems sensible enough, but the polls are such that every half-decent forecast is reasonably close to every other half-decent forecast.
You are failing to consider that “Biden losing” and “Trump winning” is the same thing.
Trump “doing what he has to do” to win Washington may cause him to lose Mississippi, true.
But Biden “doing what he does” to lose Washington does not imply anything about Mississippi.
“Maybe there was a bug in the code, but more likely they just took a bunch of state-level variables and computed their correlation matrix, without thinking carefully about how this related to the goals of the forecast and without looking too carefully at what was going on.”
I think this is a misread of how the 538 model works. From my understanding, they don’t *have* a correlation matrix, they just draw a bunch of random errors for each run and interact them with demographics and state characteristics. In practice that creates an average correlation matrix, sure, but there’s a lot of flexibility on which states are correlated with which from simulation to simulation.
From 538’s methodology page: “Therefore, to calculate correlated polling error, the model creates random permutations based on different demographic and geographic characteristics. In one simulation, for instance, Trump would do surprisingly well with Hispanic voters and thus overperform in states with large numbers of Hispanics. […] The variables used in the simulations are as follows:
Race (white, Black, Hispanic, Asian), Religion (evangelical Christians, mainline protestants, Catholic, Mormon, other religions, atheist/nonreligious),
A state’s partisan lean index in 2016 and in 2012, Latitude and longitude, Region (North, South, Midwest, West), Urbanization, Median household income, Median age, Gender, Education (the share of the population with a bachelor’s degree or higher), Immigration (the share of a state that is part of its voting-eligible population), the COVID-19 severity index, The share of a state’s vote that is expected to be cast by mail”.
I think thinking about the “latitude and longitude” terms there might help with the NJ/AK and WA/MS examples. A lot of the “Trump wins NJ” simulations will be associated with a high pro-Trump draw on the longitude coefficient. If longitude is normalised to the geographical centre of the country (or of the mainland 48 states), then that would translate to a negative shock on the Trump vote share in Alaska. Same with WA and MS: if Biden is doing well in MS, that might be because of the latitude and longitude terms. In that case, he’d underperform north and west.
I’m not sure how reasonable the latitude and longitude assumption is, but I think that’s part of what’s going on here.
Joffré:
Interesting. But I still don’t quite see where the zero and negative correlations are coming from. If you add a bunch of random terms for different groups, this will induce positive correlations for groups that are prevalent in multiple states, but it would not by itself induce negative correlations.
But . . . ok, yeah, I see what you’re saying: of all the variables listed above, the ones that could create problems are those continuous state-level variables, as you could imagine them swinging like a seesaw, going up on one end and down on the other.
Such seesaw-like prediction errors are of course possible, but I don’t buy it, at least not for this election. Again, if you started with where we are now with the election and then asked me to give a prediction for Mississippi, and then you said, Hey, Biden did 5 percentage points better in Washington State than was predicted, then I don’t think it would be right for me to say that now I think Biden will do 2 points worse than predicted in Mississippi. I’d just thnikthat the possibility of national polling errors and national swings would overwhelm any such seesaw predictions.
The Fivethirtyeight team is of course free to argue otherwise, but I guess I’d like to see that argument. My guess is that, as you say, the correlation matrix just ended up the way it ended up, and nobody happened to check that it made sense.
It doesn’t seem surprising to me that there would be demographic groups which are negatively correlated. For example, black voters and southern white evangelicals, or college women and no-college men. The former especially means MS is quite unusual. But outside of a few specific demographic groups it does seem surprising.
Latitude/longitude look like dangerous variables to include for a lot of reasons, especially longitude. You just wouldn’t ever expect to see anything in the US depend linearly on longitude. Absolute value of longitude minus 100 would be more plausible. (Or replace longitude with total precipitation, and latitude with snowfall.)
Noah:
Some negative correlations could make sense, as part of a larger model. My problem is when the aggregate correlation is negative. See my reply to Ed’s comment here.
Is it possible that their samples are first stratified by national polling error, then all other errors are constrained by that number? I could imagine that causes an excess of anti-correlation.
I think that “if you started with where we are now with the election” is critical. I also don’t think it is part of the 538 goal. If anything, he is probably making extra attempts to start with a clean slate and not assume things will be as expected unless/until the numbers confirm it, because he felt pretty bad about underestimating Trump’s chances in the primary in 2016, and believed the error was due to too much reliance on what seemed sane, as opposed to what the numbers showed.
In summary, Nate Silver has been and continues to be a fraud. that is what I take away.
Wargeek:
I don’t think Nate is a fraud! He has a business where he’s making all sorts of probabilistic predictions. Each one of these is a difficult problem, and if you look at just about any complex prediction you will find problems. Ball’s in his court now: by making some of his predictions public, he’s allowing people like me to find problems for free, and then he can do better next time.
Great article.
I could find the correlations from the close states from 2016, and none were negative:
https://fivethirtyeight.com/features/election-update-north-carolina-is-becoming-a-backstop-for-clinton/
So its seems to be a new thing. The lowest correlation posted was .37 at Georgia/Maine, but these were only 15 states.
How many other negative correlations could you find? I would be more alarmed in any “battle ground” states were negative correlated with each other this year.
538 loads assumptions like loading coal into a train – it looks like a mess full of indeterminable assumptions. Even simulating by states is fraught with errors. Illinois is so overloaded by Chicago politics (and historic cheating) how can the various suppositions for entire states?
I anticipate another trainwreck for 538 and pollsters in 2020. Hopefully this discredits pollsters enough that they go back to polling more ‘important’ stuff like paint color preferences on cars or new uniform designs for baseball teams.
Thomas:
Pollsters already put most of their effort into asking about stuff like paint color preferences on cars or new uniform designs for baseball teams. The election poll questions are loss leaders that pollsters include so they can get some publicity for their surveys. The polling world you wish for is already happening.
Interesting. I could find these published correlations used in 2016 for 15 of the closer state:
https://fivethirtyeight.com/features/election-update-north-carolina-is-becoming-a-backstop-for-clinton/
None of them were negative. The lowest correlation was Maine/Georgia at .37. The correlations overall look reasonable.
Could you find any other correlations that were negative. It would be a considerably more alarming if any of the “battle ground” states were negatively correlated with each other.
It feels like Nate’s model is producing random possibilities (the odds of any particular event happening) rather than limiting those possibilities to a linear string (a California win for trump would have to follow another specific group of possibilities to be considered viable). The outcomes of the election are not random like power ball numbers. The chances of Trump to lose every state BUT one solidly blue state is not a possibility or shouldn’t be.
It just seems too much effort is being made to avoid the embarrassment of predicting a Biden victory when the Trump has SOME chance of pulling off the win like 2016. Sure Trump has a chance. But the scenarios that provide that chance are finite and lower the closer we get to election day.
Andrew:
Do you have any more reaction to the tail miscalibration issue with the Economist model?
As a refresher, the issue is that the Economist model’s tail probabilities are miscalibrated. Though the Economist model gives Trump a 7% electoral college win probability and a less than 1% popular vote win probability, events it rated as having 7% and 1% tail probability actually occurred 14% and 7% of the time in testing on the available data.*
Here’s a figure showing the calibration problem and how it worsens for higher prediction intervals, which is symptomatic of using normal/narrow tails when heavy tails are needed.
https://i.postimg.cc/tC5QN2GR/tail-calibration-after-bug-fix.png
As I’ve mentioned before, my best guess is that fully correcting the tail miscalibration would increase Trump’s electoral college win probability by 50% to 150% of its current value. However, you do not make the 2020 scripts available for the Economist model, so no one other than yourselves can check this.
If you intend to analyze miscalibration for yourselves, then before you do so, please note that I believe I found another bug in the Economist model code. Though the bug is an easy kind to make, it greatly affects the results of Economist model fits so likely needs to be corrected before analyses. The bug is reported here:
https://github.com/TheEconomist/us-potus-model/issues/21
*To be more precise, the numbers are percentages of 2008-2016 state results falling outside 93% and 99% model prediction intervals. If you prefer 86% and 98% intervals for the comparison, 18% and 7% of results fall outside them.
It’s not a tail issue!
I’ve been doing some simulations of the model using counterfactual polling frequencies. The tail issue disappears if polling is unrelated to the likeliness of a particular candidate winning.
I’m still not sure what’s causing this (though my previous belief is still in play), but there’s no reason to believe that correcting this issue would increase Trump’s probability. The simulations (and intuition) suggest that the posterior variance is too wide for frequently polled states. The overall effect is ambiguous, but it’s probably Biden who stands to benefit from correcting this issue.
Could you explain why you think it isn’t a tail miscalibration problem? As seen in the figure I link to above, the prediction intervals undercover in the tails.
I’m sorry but I don’t understand you here.
The mean predicted vote share of each state is driven by the central (non-tail) probabilities, which shouldn’t change much by adding heavy tails. But if the mean predicted votes shares of the states don’t change, then then the consequence of adding heavy tails will generally be to increase the win probability of the candidate who is the underdog/behind.
Hm, I think you might (?) be overestimating how much information is added by frequent vs. infrequent polling. If polling estimates share bias (which they do), then the information added by increasing the number of polls can be far less than intuitions based on simple random sampling might suggest.
Yes, the prediction intervals tend to undercover in the tails of the vote-share distribution. But the *cause* of the poor coverage has nothing to do with the vote share–that relationship is spurious. The poor coverage appears to be *caused* by the left tail of the polling distribution. It appears to be an issue with the vote share distribution because cov(vote share, polling) != 0.
Here’s how I’m simulating: start with the actual election results, then simulate the backward random walk for each state. Then generate polling for each state, based on simulated latent propensities and the observed bias/distribution of the polls. This allows you to artificially manipulate the number of polls in each state. If choose the number of polls randomly (setting cov(polls, vote share)=0), then the posterior intervals have similar coverage throughout the vote share distribution. Hence, it’s not an issue with the tails of the vote share distribution.
Now, the simulations take FOREVER and I have a job, but preliminary results indicate that the problem is that the posterior intervals are attenuated with respect to polling frequency. The coverage is too narrow for infrequently polled states, and too wide for frequently polled states. If you fix this problem, you’ll get wider intervals for higher-margin states, but smaller intervals for competitive states. The effect on the model is therefore ambiguous.
MJ:
The too-narrow-tails problem still occurs when the Economist model is fit to 2008-2016 with no state polls data at all.* This means that the too-narrow-tails problem can’t be an artifact of differences between the number of polls in different states.
Now, maybe the Economist model also has a problem accounting for the different number of polls in different states. I don’t know — I haven’t checked that, and it sounds like you have a creative way of investigating the topic! But tails are too narrow without between state polling frequency differences.
Yeah I know how you feel. It’s great that much of the Economist presidential forecast code is made available, but that ultimately relies on unpaid work to find errors.
*ie, it is fit using national poll data only and the state priors, but no state poll data. I know how the model fits without state polls as a result of the bug I mention in my previous comment.
I’m looking at the “scripts/model/final_2016.R” model, which calls “scripts/model/poll_model_2020.stan”. Those generate the figures that Andrew posted a few days ago, and those scripts are definitely using the state polling data from 2016, aren’t they? Line 98 of the stan script calls the poll results, right?
Which script are you using?
Ug, I’ve already spent wayyyy too much time trying to figure out what’s going on in these files! It’s starting to crowd out my actual research that I get paid to do…
Run final_2016.R through the section where the data list is defined. That’s lines 470-514 or so, under the heading “# put the data in a list to export to Stan”. It should only take a few seconds or less to reach that point of the script on your computer.
Then use command str(data) to check what is actually in the data list that gets passed to stan. All the state poll entries are 0 or empty!! No state polling data is being expored to stan!!
This traces back to a bug on lines 135-6, where state_abb_list is mistakenly assumed to be a character vector when it is actually a factor. It’s a factor as a consequence of the pesky R choice that read.csv defaults to stringsAsFactors=TRUE.
fogpine:
I’m definitely seeing the state polling data in the “data” list that’s passed to stan. I’m thinking we’re working off different commits. But if you’re seeing the same behavior despite no state polling data, then this just raises more questions for me!
As if all of this wasn’t confusing enough already…
That’s …odd. I’m working from the most recent commit. For me, str(data) tells me N_state_polls is int 0, state is num(0), poll_state is num(0), poll_mode_state is num(0), poll_pop_state is num(0), unadjusted_state is num(0), n_democrat_state is num(0), and n_two_share_state is num(0).
What does class(state_abb_list) return for you?
Do you have some option set that redefines stringsAsFactors to default to FALSE in read.table and read.csv? Is this an RStudio feature or something I’m not aware of? I’m bewildered!
fogpine: Are you running the same version of R? Beginning with R 4.0.0 stringsasfactors defaults to FALSE.
I only pulled the repo once, about a week ago, but…
https://imgur.com/qkQAifV
Maybe this is why we should be using the tidyverse’s readr::read_csv()…
anon e mouse: Ahhhhh crud. Thanks very much, that’s exactly the problem. I use an older version for work compatibility.
MJ, thanks also for the image and help.
fogpine and Andrew et al:
Here’s my current best guess as to what’s going on here: the sampler appears to be assigning a higher variance of the random walk process to infrequently polled states. You can see this by plotting the estimated random walk variance for each state against the number of polls for each state. There’s a good chance I’m misinterpreting these variables, though. I don’t know if html tags work in these comments, but here’s what I ran at the end of final_2016.R:
mu <- rstan::extract(out, pars="mu_b")[[1]]
state_var <- sapply(1:51, function(i) var(mu[n_sampling+n_warmup, i, ]))
polls %
group_by(state) %>%
summarize(n = n())
plot(t[-1], polls$n[-1])
I think what’s happening is that on a date when a state has polling, the sampler allows for a larger variance in the innovation of the latent sentiment variable because the variance of the polling error (not bias!) is also being drawn on that day. The sampler will allow for a large increase in sentiment as long as it’s balanced by a large negative polling error. States without polls don’t get the advantage of the polling error, so all of the variance is captured by the random walk variance. Or something like that.
I think you could solve this by explicitly modeling potential polls for each state on each day. If you think of states without polls as simply missing polling data for that day, you could simply have the sampler draw the “missing” polling data each day. That would work, right?
Mj:
What we have in our model is a vector of length 50 for each day with Biden’s share of the two-party vote in each state in that day. National and state polls are data; they inform these latent parameters. We don’t need to model potential polls for each state on each day; this is already in our model for every day, whether or not there happens to be a state or national poll on each day.
Also, rather than thinking of the sampler as “drawing” anything, I think it’s better just to think about the joint distribution of all these latent parameters.
That’s definitely how it *should* work, but I don’t think that’s how it’s *actually* working.
If what you’re saying is true, then the state-specific random walk variance should be independent of the polling frequency, right? Why does the 2016 model say that ND has a large random walk variance compared to Florida? The model assigns them (approximately) the same variance, right?
Mj:
I don’t think the prior variances on the 50 states are not identical, but I don’t remember quite how we assigned them, except that it was a hack, plain and simple. It actually does seem reasonable for larger states and swing states to be more stable than smaller or less swing states. First, larger states are more diverse (in various ways, not just ethnically) so I think it would take more to swing them. Second, swing states receive more campaigning, and I’d expect that this would bring out the voters on both sides, leading to a more predictable outcome.
But in any case the posterior variances should be lower for states with more polls.
Andrew:
The variance I’m talking about here is the variance of the random walk process, not the posterior prediction intervals. Unless I’m mistaken, that covariance matrix is 100% exogenous. The model isn’t estimating the random walk variances, and ergo the random walk variances shouldn’t depend on the data. But that’s exactly what’s happening if you look at the posterior draws of the latent sentiment (mu_b). And intuitively, polling should be independent of sentiment variance.
From what I can tell, mu_b should be evolving according to the state_covariance_0 matrix. But the diagonal of that matrix is much different than the predicted posterior variation in mu_b. The “sampler” thinks this is fine because we of course shouldn’t expect the sampled variance to be identical to the population variance, but the way in which the sampled variance is systematically different from the population variance (specified by diag(state_covariance_0)) is cause for concern.
Mj:
That’s right, we’re specifying that covariance matrix externally (and, as I wrote elsewhere in the thread, it’s put together in a hacky way). Beyond that, I’m not sure about the details of what you’re saying, but I think we’ll look at it more carefully in a few months when we’re not so time-constrained. I do think this covariance is a weak point in our model as well as in Fivethirtyeight’s model. Indeed, our struggle with these covariances is one reason why I can appreciate how difficult it will also be for the Fivethirtyeight team to implement this part of the model and how easy it can be to get things wrong.
Andrew:
I don’t think the problem is the covariance matrix, I just think you’re getting unexpected behavior from the sampler. I think the code I posted says everything (just copy/paste that to the end of final_2016.R). The sampler is “overriding” the exogenous covariance matrix because the likelihood isn’t accounting for the differences in polling. Again though, I think this is an extremely minor issue, and is only affecting the second moment of the posterior intervals. I only bring it up in the context of the “tail problem.” It’s definitely NOT something that I think needs to be addressed immediately. The model is good.
Also, I want to commend your magnanimity toward Nate Silver here. His referring to you as the “Economist guys” is clearly an attempt to bring you down to his level, as if he weren’t a journalist and as if you weren’t Andrew fucking Gelman. I generally like Nate’s contributions, but this isn’t a great look for him.
Mj:
Thanks, but to be fair, I may be better at being Andrew F. Gelman than Nate Silver is, but Nate’s better at being Nate F. Silver than I am. I admire Nate’s ability, not just to communicate with the public, but to supply high-quality, thoughtful, and rapid analyses on all sorts of data-based problems, from politics to sports. I’m an academic, and the way that academics work is that we develop certain ideas and apply them over and over again. If we’re lucky, these ideas are useful. Nate’s a . . . well, he’s a “fox”: he grabs what methods he can to solve problems, and I think he’s done a better job on many of his analyses than I could’ve done, also doing these analyses on deadline. For example, he had some sort of estimate of the effect of the “Comey letter” in the 2016 election. I didn’t look at his analysis carefully, and I’m sure it’s not perfect, but I’m pretty sure even without looking at it that it’s reasonable. Just as his election forecast is reasonable. It has some real problems, but that I understand, given the problems we have handling all this time-series uncertainty in one place.
So, while I appreciate your kind words, I don’t think it’s right to say I’m being “magnanimous” to Nate. I respect what he does and I’d like to help him do better.
MJ: I don’t think your R code formatted right. Is this what you mean or something else? (fingers crossed my code posts ok)
mu = rstan::extract(out, pars=”mu_b”)[[1]]
# Variance of draw r for each state i
r = n_sampling + n_warmup
state_var = data.frame(
mu.var = sapply(1:51, function(i) var(mu[n_sampling+n_warmup, i, ])),
state = state_abb_list
)
# Polls per state
all_polls$n.polls = 1
n_polls = aggregate(n.polls ~ state, as.data.frame(all_polls), sum)
# Join
data = merge(state_var, n_polls, by = “state”)
# Plot
plot(data$n.polls, data$mu.var, col = NA)
text(data$n.polls, data$mu.var, labels = data$state)
I’ve avoided greater than and less than signs to try to avoid post formatting errors.
Also, let’s test slashes and ellipses:
Testing testing 1 2 3, | || |||, \ \\ \\\, / // ///, {{}} {{}, {{}}}, {{}, {{}}, {{}, {{}}}}
Are the demographics of trump voters in Mississippi and Washington really that different? Also if we condition on an unlikely scenario are there any states which DONT approach coin-flip probability according to their model…
Weston:
I would not be surprised if they were differences. In my experience people are social animals, inclined to go along to get along, so people who lack strong opinions on a matter may just go with the local majority opinion.
That’s why the USA has a secret ballot.
Since FiveThirtyEight published their scenario explorer (https://projects.fivethirtyeight.com/trump-biden-election-map/?cid=abcnews), I noticed another strange result:
-If you assign Minnesota to Trump, Trump has a 90% chance of winning Mississippi. If you assign Minnesota to Biden, Trump has a 90% chance of winning Mississippi.
-If you assign Georgia to Trump, Trump has a 99% chance of winning Mississippi. If you assign Georgia to Biden, Trump has an 81% chance of winning Mississippi.
-If you assign Georgia to Biden and Minnesota to Trump, Trump only has a 61% chance of winning Mississippi (vs. 81% with Biden winning Georgia).
-If you assign Georgia to Trump and Minnesota to Trump, Trump only has a 97% chance of winning Mississippi (vs. 99% with Trump winning Georgia).
I am wondering if this is just an issue of the correlation matrix they specified, or if it is a sampling/conditioning issue as well. If FiveThirtyEight is over/undersampling specific parts of their distribution at one step of their simulation to allow for more “uncertainty” but not actually adjust the values of all of the different model parameters conditional to a rarer outcome, then it could produce results where conditional on Georgia and Minnesota, Minnesota adversely affects Mississippi, but standalone, Minnesota does not affect Mississippi.
These are good questions to get Nate on the record, but meanwhile, my assumptions would be that
(1) There is no explicit modelled correlation between states. There is an implicit correlation composed of correlations on various factors, such as demographics or location.
(2) It is quite plausible that Minnesota and Mississippi are essentially uncorrelated, because of some positive factors balancing out some negative factors.
(3) It is likely that the positively correlated factors are also shared with Georgia, and that taking them out leaves Minnesota and Mississippi negatively correlated.
(4) But I wouldn’t rule out “by the time you specify that, there aren’t enough simulations left to provide a good sample.” Even if the raw numbers are large enough to suggest they represent a valid sample, I’m not confident that they were pulled randomly from the “elections where that happened”. (By analogy, studies of non-citizen voters in the US run into a problem that it is so rare, you have to account for all sorts of measurement errors that you could ignore for larger subsamples.)
Andrew – why would you provide a forecast to The Economist for $0? Scratching my head because they’re clearly monetizing your work.
Anon:
Just to be clear: I didn’t provide a forecast to the Economist. They did the forecast. I just provided them with help.
Nate Cohn comments that the negative correlation seems kind of right (I have no idea either way, just stumbled across it):
https://twitter.com/Nate_Cohn/status/1320042092694065153
That’s not really what he’s said. He’s just providing an odd and largely irrelevant justification.
I have nothing really to add on the simulations, but plenty to offer on state correlations based on historical trends. Basically, if Trump wins California in a nail biter, he wins every state with a near 100% certainty except for Vermont, New York, Maryland, Hawaii, New York, Delaware (special case for the 2020 election), and Massachusetts.
If he wins New Jersey in a nailbiter, then he only loses the states above plus, perhaps Illinois, Connecticut, and Maine.
Of course, all this is navel gazing- Trump isn’t going to win California, and Biden ain’t going to win Alabama unless there is open civil war in the streets and armed suppression of voting.
armed suppression of voting is exactly the sort of thing that would vary by state (and already has), and might well reshape the “order” of states’ partisanship. So we should expect the tails to look strange.
“But it did then take another hour or so to write it up. Sunk cost fallacy and all that. ”
Writing it up is when you learn what you learned.
Your previous article about exploratory data analysis was interesting but really no matter how you do it you can’t learn much from glancing at a few graphs. Until you do a systematic analysis and write it up, it’s not that useful.
Jim:
Yes. To have ideas is to gather flowers. To think is to weave them into garlands. I saw that once on an inspirational-thought-per-day calendar,
Nice. I like it.
Some thoughts on why the 538 model might have defensible choices/outcomes in these scenarios.
On negative correlations: Qualitatively it does not seem out of the realm of possibilities that there is significant negative correlation between MS and WA given the coalitional nature of American politics based on identity groups. For example, you could imagine a generic R strategy that focused on getting suburban college-educated multi-ethnic support from the tech industry pushing white non-college educated voters back towards the Democratic party or depressing their turnout; indeed deciding on messaging tradeoffs among various constituencies that induce negative correlation are part of the every day work of campaigns (e.g. “transition from oil” vs “not banning fracking”). Given that from what I understand of the 538 model one of its more determinative inputs across states are performance in particular demographic groups and it does not seem to be a stretch to imagine that there are negative correlations in that input to the model.
On tail probabilities: I also think that 538’s “idiosyncratic per-state” fatter tail probabilities are significantly justified by the insanity surrounding the 2020 election and all the impossible variations of mail-in balloting, court decisions, etc. For example, is there is a serious chance of a Biden +15 FL result if coronavirus depresses R turnout on election day due to the mechanics and partisan breakdown of early voting right now? Probably – and that is one of the realizations on my click in the 538 FL page. My understanding is that the 538 model has somewhat increased its tail probabilities this year based on a “finger in the wind” guess that there is significant uncertainty surrounding those aspects of the election, which is a modeling choice that seems defensible if difficult to perform; after all the goal is to predict the 2020 election, not “what this election would be if it were like every other election.”
Ed:
Sure, but think of it in terms of information and conditional probability. Suppose you tell me that Biden does 5 percentage points better than expected in Mississippi. Would this really lead you to predict that he’d do 2 percentage points worse in Washington? I don’t see it. And one reason I don’t see it is that, if Biden does 5 percentage points better than expected in Mississippi, that’s likely to be part of a national swing. The same reasoning in reverse is why I think it’s ridiculous to have a scenario in which Trump wins New Jersey but loses the other 49 states.
Thanks for taking the time to write this up and to reply!
Totally qualitatively and subjectively my feeling is yes? Maybe this is the wrong way to look at it but sitting in a Seattle suburb right now one way I approach the interpretation of the realizations is “Given the hardened partisan state of current polls with low undecideds, what could Biden do in the next 10 days that would increase his vote by 5 points in Mississippi, and what would that do to his vote share in WA?”
Maybe it’s reversing his oil message and going on a tour of oil platforms and refineries in the Gulf in a play for TX and the FL Panhandle and angering my neighbors who see climate change as an existential issue. Maybe it’s just concentrating his media budget and campaign time in the South or in demographic cohorts with relatively lower WA representation. The net is that the negative correlation actually “feels right.”
From a broader perspective, as political polarization along identity and geographical lines in the country has hardened over the past couple decades it does not seem impossible that national swing effects are outweighed by assortative effects with negative correlations in particular places that are particularly diametric. I admittedly do no work in this area though so I have no data to back up this assertion – maybe I just don’t realize how much I have in common with the average Mississippian.
Ed:
In political science they use the jargon “valence issues” for information that roughly moves the whole country uniformly. Examples of valence issues in the current election are economic growth, coronavirus, and various political scandals. For example, sure, some Republicans think Trump has handled the pandemic just fine, but it’s not like the pandemic makes them more supportive of him. The quick way to think about it is that polarization is here, it’s real, it’s huge, and it’s already expressed in the national voting map. Washington being more liberal than Mississippi is already baked into the forecast.
At this point, I think what would benefit Biden is some combination of more bad news about the economy, the pandemic, etc., more bad news about Trump, more prominent Republicans endorsing Biden etc., and also systematic errors that have favored Trump in the polls. And the reverse for Trump. I could see the polling biases going in various weird ways, but for the economy etc. I’d expect something roughly like national swing. As for campaigning: I could see that if Biden campaigns more in the south it could help him more there, but I don’t think that campaigning in the south would appreciably hurt him in the west.
I had to look it up on Wikipedia, but the opposite of “valence issues” is “position issues”. I can imagine that position issues are very important during the phase 4-18 months before the election, when different (normal) candidates are articulating policy proposals, being sorted out in primaries, and identifying running mates . By the time you get within 2 months of the election, there aren’t any new positions to take. The valence issues are the only issues left that can cause voters to switch, and the only remaining role of position issues is in driving turnout.
In that sense, I agree with Andrew that negative correlations are implausible at this point. But they would have been plausible a year ago. And if your model doesn’t deal with that sort of time dependence…
Coming at this from the perspective of the recent British general elections, I’m not sure why the idea that different bits of the country may unexpectedly move in opposite directions politically in an election is the sort of stumbling block the post seems to assume? There’s been a lot of changing political geography in the UK, with support for different parties going up sharply in some areas while going down sharply in others. In some ways the reason for popularity in some areas has also been a reason for unpopularity in others (e.g. a party being seen as very Remain – so if it’s doing better in Remain areas because its Remain message is cutting through that can go along with also therefore doing worse in Leave areas.) So if a bit before a British general election someone had done a forecast that included provision for the chances of further political development that would see, say, vote shares in seats in Lancashire move differently from seats in London, that would not have seemed odd at all. Transferring that to the US, given how much more variety there is within the US compared to the UK, allowing for similar patterns seems reasonable?
Mark:
Different states may move in opposite directions (or have polling errors in opposite directions): definitely, I have no disagreement about that. My disagreement is about these negative correlations being expected. Again, if Biden does 5 percentage points better than expected in Mississippi, I agree that it’s possible that he could do 2 percentage points worse than expected in Washington State, but it wouldn’t be my expectation.
There’s a third percentage point issue that’s relevant here too, I think – the national vote share? i.e. if Biden does 5% better than expected in Mississippi, then either he also has to do worse than expected in at least one other place, or his national vote share has to be higher than expected. Is it more reasonable to expect the national shares to be wrong in this case or to expect another, most likely relatively lightly polled state, to be wrong? The latter seems to me a pretty plausible option to pick, though this is purely a qualitative argument – I’ve not looked at whether the numbers in the model stack up this way.
I gotta say no, I would not expect the national vote shares to balance out if Biden meaningfully overperforms in a very red state by him underperforming somewhere else. It’s possible, but given how polarizing Trump is, I think it is even more likely than usual for any substantial late swings to be positively correlated across multiple states and possibly nationwide.
I think I agree here but dependent on where in the election cycle we are. Someone posted earlier on “valence” vs “positional” issues. A valence issue (like a scandal) will move things uniformly; a positional issue (Green New Deal) will not. Earlier in the campaign cycle, it might be reasonable to expect that national vote share -largely- balances out, especially since we know that elections in the modern day are so polarized that it’s extremely unlikely a candidate wins by > 10 points. So early on, we may expect that if Biden surges in Mississippi, it’s because he modified a positional stance which then hurts him with opposite demographics. In this case, Washington. But this late in the game, we shouldn’t expect positional changes (and I doubt that polling shows it). So if Biden surges in MS, it seems more likely to be due to a valence swing.
Its interesting to revisit this from a British perspective (I’m also a Brit).
This is very close to what has just happened in the general election: Labour missed their national vote share polling by about 6% (34% compared to 40% ish polling), but did well in the marginals that gave them a landslide.
And indeed these could have a priori been reasonably modelled as negatively correlated: the positions that Labour took that were either inoffensive/attractive in marginals were pretty toxic in their urban safe seats.
The negative correlation between Trump vote shares in WA and MS is surprising, especially because negative correlations aren’t limited to these states: About 9% of all between-state correlations are negative in 538’s model. Many of the between-state correlations are substantially negative too: about 6% of between-state correlations are less than -0.1 and about 3% are less than -0.2.
I’m not sure of the explanation for all those negative correlations — possibly it involves some trade off between the model’s expectations about national and state polling errors, but that’s nothing more than a guess on my part.
The correlation in the Economist model is actually quite similar (0.456) so I don’t think this criticism of 538 is fully valid. However, the other aspects of 538’s model that are mentioned in the post surprise me too.
Note: all my correlation calculations are Pearson’s correlations between Trump vote shares
I wonder if one contributing factor is unrealistically high uncertainty for states without much state-level polling. Looking at the ranges of points in the NJ/PA and PA/WI plots, it looks as though NJ has a higher probability of really wild outcomes. As political observers, we have enough outside information to know that it’s basically impossible for Trump to do much better in NJ than in PA, but the model appears to be saying, “NJ has almost never been polled, so despite the our best guess about the state of the race from national polls and polls of other states, we don’t *really* know what’s going on there.” This is related to what you’ve been saying about the correlations between two states being too low in the tails, but I think it’s slightly different: the model may be learning too slowly about rarely polled states. I wonder what would happen if you threw a few simulated recent polls into the model for rarely polled states.
This actually might make sense, in a sort of weird way. The sample of elections is not that large, and lots of states have changed from blue to red at least once in the last 20 presidential elections. So perhaps the idea is that with little polling, there’s little evidence to counter a hypothetical several-percent possibility that the state’s blue/red tendency has shifted?
I’m sympathetic to this idea, although see Andrew’s response to Daniel Walt below for the counterargument in this particular case.
For comparison, I wonder what exactly happened in Indiana ’08, which saw a big shift toward Obama relative to the rest of the country (and I believe relative to the polls there, but I’m not sure). Is it feasible that a relative shift that large in Obama’s direction could have happened there without him also having a large win nationally?
All that said, the magnitudes of the possible Trump wins in NJ in these simulations seem absurd, especially outside of the context of a Trump landslide nationally.
>>All that said, the magnitudes of the possible Trump wins in NJ in these simulations seem absurd, especially outside of the context of a Trump landslide nationally.
In general I agree – the effect seems too big – but I do think there’s an argument to have the model *not* rely on “everybody knows New Jersey is very blue”.
I think it’s not to do with a national Trump landslide, though, but the hypothetical possibility of NJ realigning toward being a red state.But I agree it doesn’t fit well for New Jersey itself, as it ought to be strongly correlated with New York and to some degree with the rest of the Northeast.
Confused:
The relevant information is not “everybody knows New Jersey is very blue.” It’s the voting pattern of New Jersey in previous elections along with the few, but not zero, state polls of New Jersey. Put that together with the national polling information and it’s hard to see how there’s any reasonable possibility that NJ goes for Trump in 2020. Yes, Fivethirtyeight gives Trump a 1% chance of winning the state, but, as discussed in the above post and elsewhere, I think that 1% is an byproduct of some unfortunate modeling choices where they had to add huge errors at the state level to get the uncertainty they wanted at the national level.
Sure — but I think there’s the possibility (or at least historical precedent for) a state shifting between elections, relative to other states.
But yeah, not New Jersey, since that’s basically the same metro area as NY and CT.
Maybe I am missing something, but if the model is certain about the country-wide result (from national polls), then the sum of all states has to be basically constant. This would mean that states pretty much have to be negatively correlated with some states when they are positively correlated with others.
(I am not claiming that this is what’s going on. But to me it at least seems like a plausible mechanism to “push” correlations towards negative values.)
This post got me to look at comparing some of the results from your model and the Fivethirtyeight one. Here’s a possibly stupid (in that I might just be making a trivial mistake) question that resulted:
In your model, there’s currently an enormous spike at Biden = 374 EV. 2328 simulations out of 40000, using the CSV I grabbed sometime in the last 48 hours. You have 375 EV as comparatively extremely unlikely: only 68 simulations. Fivethirtyeight, going by their histogram CSV, has almost the opposite: 906 sims at 375, but only 345 at 374.
So I did some further digging with simmed-maps.json. The most common route to 375 looks extremely reasonable to me: https://www.270towin.com/maps/xmxPN.png (Fivethirtyeight currently have Biden as a favorite to win Maine district 2, which would probably go up even further in a near landslide election.)
It occurred to me that one explanation would be if you’re not simulating the results independently for the Maine and Nebraska districts. That would turn (nearly) every 375 map into a 374 map, because it would give Trump all five EV in Nebraska – hence a huge peak on 374, and almost nothing on 375!
Can you say:
1. Whether this is accurate? And if so, doesn’t it mean the EV histograms on the Economist site are rather misleading, because they ignore the effects of the districts? (Including them might have the effect of “blurring” the strong peaks.)
2. And if so, how often does the Economist model incorrectly call an election, based on incorrectly apportioning votes in the states with districted EV distribution? (Obviously, this can only matter in cases where the candidates win 267-273 votes each, but in cases where it matters, it might matter a lot!)
Adam:
That’s right—we don’t model those individual electoral districts, so I would not expect out exact electoral vote totals to be correct. We talked about including those districts in the model but we decided not to bother. In retrospect, it perhaps would’ve been better to include them in some hacky way than what we do now, which is just to pretend that Maine and Nebraska allocate all their electoral votes based on the statewide total.
I don’t think this will matter much in the 267-273 electoral votes range, but I can’t say that I’ve checked!
Thanks for the quick response! One reason it might be important in some contexts is highlighted by a recent discussion with Nate Cohn about modal outcomes, specifically about 413 being the modal outcome for Fivethirtyeight: https://twitter.com/Nate_Cohn/status/1318325188480634882
It strikes me that it’s difficult to have a conversation about modal outcomes when you’re ignoring the district results, and not just because 374 is really 375. If the likelihood of winning a district varies a lot with Biden’s overall EV success, then that could mean there’s more or less “blurring” at different EV values, shifting the modal outcome from one to another.
Adam:
Yes, I agree that it would’ve made sense for us to include those districts in some way, even if just in a hacky way.
Let’s get back to basics here! If you or I or anyone asserts he has a probabilistic evidence base on the basis of which (through the device of some model, whether it be simple or complicated) he claims to estimate the probability of an exceedingly rare event, he’s going to have to have a (correspondingly) exceedingly large amount of such evidence — if the estimate is to have any credibility at all. The rarer the event, the more evidence required, to maintain some asserted level of credence.
Rm:
We recommend estimating the probability of rare events using a combination of empirics to estimate the probability of precursor events and modeling to get you to the rare event in question. In this case, you can look at intermediate events such as the probability that Trump gets at least 45% of the vote in New Jersey, the probability that Trump gets at least 48% in New Jersey, etc.
Andrew —
Suppose I have accurate (i.e. validated empirically with respect to relevant sets of evidence) estimates of probabilities p1,p2,p3 for events e1,e2,e3. Say the rare event is E = “e1 and e2 and e3”. Suppose the event is so rare that, for the sake of argument, “nothing like it” has ever been witnessed: there are no historical exemplars for it. The difficulty then seems to me to be that while my model may be able to produce accurate estimates for p1, p2, p3, in the sense that these predictions can be checked empirically in some reference class of future (or past) events; the prediction for p(E) cannot be.
To make the matter less abstract, consider an example. Fix our attention upon a particular intersection in the city, and the event that certain vehicles appear simultaneous in this intersection at 12:00 Noon. First, Let e1 be a dairy-truck, let e2 be a plumber’s van, and let e3 be a truck towing a cage containing a lion. How rare is the event that all three appear together at the same hour in the same place? Well, I can construct any model I please, but how on earth do I rate the credibility of the “prediction”?
Rm:
Yes, your inference in this example will be model dependent. But that’s ok. What if I want to compute the probability of the following sequence of coin flips:
HHTHTHTHHHTHTHTHTTHTHTTTHHHTHTHTHHHHHHTHTTHHHHTT
Such a sequence has probably never happened in the history of the universe, but we can still compute the probability, given our model. I can’t directly rate the credibility of this prediction, but I can evaluate the model in other ways (for example by gathering data and testing for serial correlation).
Andrew —
What I was groping around for, half-forgetting, which you have now reminded me of, was the problem of “extrapolation”.
Models are fitted, and good models are latter vetted, on data to which nature grants us access. A good model can be used to extrapolate “to the tails” yes. But they cannot so easily be “vetted” there; or not until a good deal of time has passed. The difficulty is: there may be many “good” models which agree well with each other on the fitted/vetted data; but which disagree with each other “on the (yet-to-be observed) tails”.
Simply put: it’s easy to see where an interpolator goes wrong (you tend to interpolate in a regime where data are already available — since that is where the model was fitted in the first place); but you cannot say the same about an extrapolator, not until some data have been collected in the new regime. If a model predicts the *probability* of some event within a class, it’s even harder; since the “datum” with which one must compare the prediction, in this context, is not a single event, but is a subset of events contained within some superset (all yet to be observed at the time of the prediction).
> Well, I can construct any model I please, but how on earth do I rate the credibility of the “prediction”?
You rate the credibility of the model at predicting the individual events, or related events (say a truck towing animals in general). You then use the model to calculate the probabilities of the rare events.
People *think* that probabilities are things in the world they’re measuring… because they’re confused. Probabilities are entirely made up, they’re fictions used for inference. They can’t be measured.
If a model makes predictions of the sort “such and such an event occurs with probability p”, and that prediction is meant to be the basis for rational action (or rational inference) then that prediction must be susceptible to empirical validation. Otherwise what is the point of making the prediction at all? Let me put it another way, what *am* I doing if I throw a die 10000 times and create a histogram for the observed counts of each face? Am I not estimating an internal parameter in a (simple) model; with the intent — I presume — of using that estimate for subsequent inference?
Presumably you are attempting to estimate some frequencies, and each frequency is a parameter, each parameter value has a probability associated to it.
The frequency may well be a stable and in theory measurable quantity, but the probability associated to a particular frequency is NOT
If some model says “such and such event should occur with probability p”, what procedure should we follow to decide whether the model is decent or not? Better: if two models disagree, one says the probability is p and the other says it is q, what procedure do we follow to decide which model is — conditional on whatever set of evidence you please — the better one?
I believe a good method for model selection is to select the model with the minimum posterior averaged surprisal for the observed data. Other methods could be used if there are meaningful utility functions available… you might prefer a model that never fails to predict catastrophic events even if it does less good on everyday events for example.
Let’s put it another way, how can you interpret the statement: “there is a 0.97 probability that the frequency with which this 6 sided die rolls a 1 under these rolling conditions is less than 0.1”
How could you possibly do experiments to measure this probability (the .97, as opposed to the 0.1)
As Jaynes said “It is therefore illogical to speak of “verifying” (3–8) by performing experiments with the urn;that would be like trying to verify a boy’s love for his dog by performing experiments on the dog.”
https://bayes.wustl.edu/etj/prob/book.pdf
If a model is a guide to action, to decision, then it must have testable consequences. Otherwise we should be indifferent to the choice of model. Clearly we are not indifferent. If some assertion is made like the sentence in your example, then either the claim is subject to experimental confirmation or refutation; if it is not, then the assertion is useless as a guide to action or decision.
The statement is a statement about our state of knowledge… that we are nearly certain that the frequency is less than 0.1
since it’s a statement about our state of knowledge we can only test it by asking questions to elucidate whether it really is our state of knowledge… these are the kinds of questions we see Andrew asking about his election model for example… does he really think that Trump could win CA but lose the election? if not then any model which assigns reasonable probabilities to such outcomes doesn’t represent a good expression of his real state of knowledge.
If a boy loves his dog we can’t find this out by measuring the blood chemistry of the dog, we have to observe the BOY
Why do we build Bayesian models? At least part of it is that even some fairly simple concepts, when combined with data, lead to some fairly unintuitive logical consequences.
The model is an aid to calculation, it tells us what the logical consequences of some assumptions are. Sometimes these logical consequences are absurd. this tells us that our model is wrong, and we should go back and check which assumptions are causing the problem. other times the consequences are unintuitive but not absurd… this helps us figure out what might happen under unusual circumstances.
I respond here to the comment below (which seems closed to comments).
Our state of knowledge in respect to some phenomenon is a record, a summary of a sort, of our experience of the world, in situations where that phenomenon has made its appearance known to us. If I have no prior experience at all with the phenomenon or its likenesses then I might as well say that my state of knowledge in respect to it is nil.
But if I do know something, anything at all about the phenomenon — or at least believe I do — then what I know (or believe I know) is a reflection of my experience(s) of it. If those experiences are plural, then I have in my memories, however I may choose to summarize them, to draw upon them for reference, I have implicitly some reference class, of events, in which the phenomenon in question participates. And so I have a reckoning — of the rarity or frequency of the phenomenon within that class.
As I see it, one’s state of knowledge is (or ought to be) grounded in one’s experience of the world; and so one’s state of knowledge about the propensity of a die to fall this way or that is grounded in such experience first or second or third-hand; no more or less than is one’s state of knowledge about the propensity of a dog to bark or bite.
I don’t disagree with you about the importance of our knowledge of the world as a record of all the stuff we’ve observed and deduced in the past… in the Bayesian formalism this is often symbolized directly in the probability symbols as K
p(A | B,K)
for example… just to emphasize that K is some database of facts and theories that gave rise to the probability model p. In Bayes, ALL probabilities are conditional probabilities when you include K.
But that doesn’t mean our probabilities are built on *frequencies*.
What is the probability that the asian murder hornet when introduced into the pacific northwest will become established and lead to the collapse of a natural pollinator that leads to the extinction of the Rainier cherry despite commercial efforts to prevent it?
Whatever our knowledge of this scenario, it can’t be from historical observation of what happened the last 10000 times this occurred. Instead we have a model, one that has to include all sorts of moving parts:
1) how does the climate in the pacific northwest affect the asian hornet?
2) how will the government respond and how much economic resources will it spend on an eradication effort?
3) How important is the prey species in question for the pollination of the trees?
etc etc
That we have no direct experience of the scenario in question can’t be a reason why we don’t have a legitimate probability state, or science would be pointless, we’d need to observe things so much that we’d never be able to make even the simplest prediction, like should I aim directly at, or to the right or left of the hole when golfing in a breeze.
I guess where I differ from your statement is when you say:
“what I know (or believe I know) [about a phenomenon] is a reflection of my experience(s) of it.”
to which I respond that we constantly have experience of new phenomena with no direct experience of that phenomenon, and yet, by putting together the logical consequences of predictions of other related phenomenon into a model, we can predict outcomes without any direct experience.
I’ve never stood on the moon and dropped a hammer and a feather together. Not even close. I’ve never been off-earth never worn a spacesuit, never been exposed to unshielded solar radiation, never experienced whatever magnetic or static electric fields there might be on the surface, but I know approximately what will happen anyway.
https://www.youtube.com/watch?v=KDp1tiUsZw8
(again must respond here above, because comments seem closed off below this level).
You haven’t stood on the moon and dropped a feather. But you know something about it. How can this be?
That is because you know something about many things, which are interlinked by a web of relationship.
You can call it a web of “epistemic dependence”. Many links between you and the feather on the moon are indirect. But the same can be said for your knowledge of the inner workings of a piston-engine: you may never have actually assembled or disassembled one.
Our knowledge is not just of “things” directly, but of relationships which obtain between things and more generally of events.
You can rank your credence in an element of that network (e.g. the feather on the moon) by considering your credence in the links in the web between you and it. But your credence in any link at all is in proportion to the times your belief did not let you down. If tomorrow stones cease to drop to the floor when I release them, I begin to re-evaluate the credence I give to the phenomenon of gravity.
If I say “it is probable that Caesar was in Gaul” what do I mean? I mean that to an extent which is generally not subject to exacting quantitative analysis (but *could* in principle be) “reliable” chronicles are in “largely” in agreement on that point.
I think we’re in agreement. From some facts which we have based on experience, and some logic about the interconnectedness of things, we can start from a position of knowledge, and through probability extend ourselves to having mathematically quantified positions about things where we have less direct knowledge.
I know that gravity works, and I know approximately the density of materials used to make bowling balls, so I know approximately how much a given bowling ball weighs, and from that I know even more approximately whether a given child can lift that ball, and then again even more approximately how many pins will fall if that child rolls the bowling ball. When there are a multiplicity of possible outcomes, then the probability dilutes itself more and more as we take further steps down the path.
The purpose then of a probabilistic reasoning framework is to work from relatively strong knowledge of one set of things towards whatever that implies about another set of things… and repeated experience stands as one type of knowledge, whereas logical connectedness (a model) stands as another kind.
Going back to the original topic way up thread:
“[when a person] claims to estimate the probability of an exceedingly rare event, he’s going to have to have a (correspondingly) exceedingly large amount of such evidence — if the estimate is to have any credibility at all. The rarer the event, the more evidence required, to maintain some asserted level of credence.”
When we say there is say 0.00012 probability that Trump wins CA but loses the election, we don’t require enormous quantities of repeated frequency data in order to have some credibility in making this claim. We need only to specify the things which we are assuming and why, and then calculate the probability which is a logical consequence of those assumptions.
To the extent that another person “buys into” the assumptions we made, then they must agree with the probability, which is just a mathematical consequence, like if x = 1 and x+1 = y then y = 2
Where we can argue is over whether the assumptions are sufficiently realistic. One way we can argue an assumption is unrealistic is to show that it implies a too-high probability for a thing that we really don’t “buy into”…. So if the probability of Trump to win CA and lose the election is 0.007 and we think this is insane, then we must go back to the assumptions and show which of them is problematic. perhaps we can test the model by seeing if it produces bad probabilities for other events, such as “actual results from the CA election are more than 27% points different from the polling data” or such like that.
Daniel (still must respond up here, as the ‘thread’ below seems closed to comment):
I think we are in agreement.
If someone claims the probability of some (rare) event e = e1 and e2 and e3 is, for example, p(e) = p1(e1)*p2(e2)*p3(e3), then the evidence for the claim must include evidence of the independence of the events; or to put another way, evidence for the validity of the simple multiplicative “model”.
If the evidence for the model is good, then using it to “extrapolate to the tails” may be the “best one can do”. But the caveat is, the extrapolation to some claim about an exceedingly rare event is still only that — an extrapolation based on a model; a model well-supported within the domain of experience.
Andrew, a few thoughts and questions after spending more time with the 538 outputs. I’m not a professional in the field so apologies if some of these are too basic.
1. I calculated (excess) kurtosis for each state and it’s fairly well correlated with whether it’s swing state. That is, states with a vote margin close to zero (GA, FL, PA, etc) have kurtosis close to 3, and their distributions are close to normals. Solid blue/red states have kurtosis around 4.5. Can you think of a reason why that correlation makes sense? Is it true of your model as well?
2. Your scatter plots seem to show the break down of correlation in the tails indeed. How would you quantitatively measure that? I tried to do it by filtering conditional on one of the two variables falling within a certain percentile range, but that seems to muddy up the correlation. Ie even if my percentile range is say [45-55] percentile, right in the middle, correlations come out low
3. If one were trying to reverse engineer the 538 model with a PCA (totally hypothetical), what’s the right way do account for the fact that some states don’t really matter because they have few electoral collage votes or because they’re solid blue/red? Should I weight each state’s vote margin by something like “state electoral votes * sqrt(prob trump wins * prob biden wins)”? I’m seeing if I can strip out 95% of the assumptions 538 (and your model) make and still come out close enough.
Rui:
Interesting. Unfortunately the code for the Fivethirtyeight forecast is not available, but based on the above discussion I can make a guess, and my guess is that, in addition to various other error terms being added to their forecast simulations, they’re adding a long-tailed error that’s correlated with previous vote share for the two parties, or expected vote share, or something like that, and this causes the seesaw pattern, where if the long-tailed error is large, it shows up as a big + for the strongly Democratic states and a big – for the strongly Republican states, or vice-versa.
That is, all the state simulations are a mixture of short-tailed and long-tailed distributions, but the long-tailed distributions have a lower weight for the swing states so the pattern is not so clear. This isn’t the whole story—look at the correlations for Georgia in the above post—but that’s part of the story.
Another part of the story is that I think the forecast distributions are too wide even for swing states—we talked about this a few months when the Fivethirtyeight forecast was giving Trump a chance to get 58% of the two-party vote in Florida. I think that too-wide uncertainty is a byproduct of (a) the Fivethirtyeight team wanting a wide uncertainty for the national vote, and (b) the low correlations in the forecast implying that to get such a wide uncertainty in the national vote, they needed super-wide uncertainties in the individual state votes to get that to work. This is a general issue in statistical analysis, that a mistake in one part of the model can have repercussions elsewhere.
Second principal axis seems to be heavily at opposite side on direction 28 (MS). If not intentional, maybe scaling issue in the driving noise: summing up originally positively correlated factors (in the random permutations) with different scale may cause negative correlations in the final result.
I don’t remember where but Nate has mentioned several times that primarily state polling affects his national popular vote forecast “X” but also that national polling also affects his state forecast “Y”. So, to the extent we were solely relying on Y (which of course is absurd and not what Nate does), in the scenarios where Trump wins California, if we are assuming the national polls are correct, wouldn’t we have to adjust Trump’s numbers in the other 49 states downwards not upwards?
Now even though Nate says he primarily relies on X, it appears possible that he still relies too much on Y because when I checked last, he gave Trump a 42% chance of winning the electoral college if he wins California. This is preposterous-it appears there may be too much emphasis on Y.
Someone above posted that he checked the data for 2016 and this issue didn’t exist then. It’s possible that Nate made an adjustment to his model he felt necessary given the lack of quality polls in the last week or so in PA, WI, and MI to create a Y relationship.
Erik:
If you do it right, your national forecast is just the aggregation of your state forecasts, and these forecasts are influenced both by national and state polls. If the Fivethirtyeight forecast gives Trump a 42% chance of winning the electoral college if he wins California, I think the problem is not so much which polls he’s using—although that could be some of the problem—but rather an artifact from some error terms they threw into the model, as discussed in the above post.
I’m not sure that negative correlations are such an issue in principle. I’m not talking about this model specifically, but in general.
If the model is a mixture of models, negative correlations may appear naturally even if each model in the mixture shows positive correlation. Think of Simpson’s paradox.
For example, we could have one “base” model where, without much uncertainty, Trump gets a large majority in some red state and loses by a large margin in some blue state and one “wtf” model where uncertainty is larger and the point estimates are also less extreme. The correlation between the states could be positive in both models and be negative when you use the mixture to make a prediction.
Trump winning where he wasn’t expected to win at all may suggest that the “base” model is wrong and as a result we may be less confident about the predictions of the model elsewhere. There would be a “return to the mean”, increasing the predicted vote share where it was low and decreasing it where it was high.
Carlos:
Indeed, that sort of thing could happen mathematically, and I agree that there are settings where such a model could make sense. I just don’t see it as appropriate in this case. If Trump wins New Jersey, then sure, all bets are off, as it were. But I don’t think this then says it’s likely that Biden wins Alaska. Finding out that Trump wins New Jersey (or, more generally, that he does much better than expected in the state) is not just “the model is wrong” information. It also represents directional information that the Republicans are doing much better than expected.
Could a reasoning for the weaker than expected correlations be that we have so much polling data right now in states like Pennsylvania that an unexpected result in New Jersey (which is rarely ever polled) doesn’t really provide much new information on the race, especially this close to the election? It seems like most of the uncertainty in forecasting 9 days out from the election will be in the form of polling error rather than a seismic shift in national opinion.
This is probably relevant in the negative correlations as well. Considering I think Biden is now a 96% chance to win the popular vote on 538, there really isn’t much consideration in the model for huge shifts in either direction, and most “odd” results are more localised errors.
Daniel:
What you’re saying is what could be happening in the Fivethirtyeight forecast, but I don’t think it reflects reality. That is, I think Trump doing 10% better than expected in New Jersey really would imply a national landslide in his favor. Also, I can’t be sure because I was only able to get these simulations a couple days ago, but I’m guessing that these negative correlations in the Fivethirtyeight forecast have been happening for months. I say this because of that notorious map they released suggesting that Trump winning NJ but losing the other 49 states was a possibility. Sure, there’s very little polling in NJ, but (a) there’s some polling, also (b) we have info on NJ other than from state polls.
What’s going on with these maps?
In 1 of 22 example maps, Biden wins every state except for Wyoming and … Vermont?
In another, he wins Mississippi but not Ohio?
David:
It’s what happens when you build a big complicated model and don’t fully check its implications. Also when you start out with an overwhelming belief that your method is correct and no evidence can convince you otherwise.
uh oh, Nate Silver as return of the Subjectivist Bayesians! :)
(Here are the maps I was referring to, in case it’s not obvious that the link was in my name: https://pbs.twimg.com/media/ElLimXhUYAA9N9d?format=jpg&name=4096×4096)
The Mississippi-but-not-Ohio map is on the edge of plausible — looking at the rest of the map, we see an obvious assumption that black Southern voting surge has been just tremendous in that scenario. I’m in the South with enough black friends reporting on their normally-apolitical families that I wouldn’t rule that one entirely out. It’s very unlikely, but I won’t criticize the model for treating it as a possibility.
The Biden-wins-everything-but-Wyoming-and-Vermont one, though, is bonkers. This whole post and discussion have been fascinating, and I’ve noticed that the people arguing for negative correlations have had decent points to make. But this is the sort of edge case that proves the need for more tinkering.
Agreed on both points. The Mississippi (+ South Carolina) but not Ohio map would be pretty damn surprising, but there is a semi-believable demographic story, as you point out. It would be surprising to get an outcome like that in only 22 samples, if those samples were representative, but if it were just that, I wouldn’t complain.
But yeah, it’s really very hard to justify that 48 state map even if it were one outcome among 40,000, never mind one outcome in 22.
I deeply agree with this:
> Let me say this again: the appropriate response to someone pointing out a problem with your forecasts is not to label the criticism as a “quibble” that is “more debatable than wrong” or to say that you’re “directionally right,” whatever that means. How silly that is! Informed criticism is a blessing! You’re lucky when you get it, and use that criticism as an opportunity to learn and to do better.
Give Nate some time to stew on the feedback. His compulsion to drive towards higher quality prediction will motivate him to incorporate this kind of feedback eventually. It’s just VERY late in the modeling game in this election round to incorporate it.
BTW, cities that sit on the border of more than one State are excellent “exceptions” that prove the very rule you are suggesting has weight. I am deeply grateful for your investigation and feedback of and to FiveThirtyEight. Regardless of FiveThirtyEight’s and Nate’s reactions/responses, keep on producing high-quality analysis and feedback. The “competitors” of fivethirtyeight will be motivated to use it which will further motivate FiveThirtyEight to more deeply consider it. You are definitely on the right track here.
Hey, a possible explanation:
When you take 40,000 simulations and you restrict it to some small probability prior (NJ winning) you’re reducing the sample size drastically. In situations like that, you’re going to get weird random sampling biases.
Is that a possible explanation?
Aakil:
The results are weird, all right, but it’s not due to the finite number of simulation draws. I’m pretty sure that if we redid this with a million simulations you’d find the same result. It’s just a byproduct of a bunch of different error terms being added together. Also, I think this is nothing special with that day’s simulation, given that oddities such as that map with Trump winning only New Jersey had been noticed earlier.
Fivethirtyeight has millions of readers . . . that’s such a great opportunity to share code and simulations and engage the hivemind to uncover problems. But then when people (not just me) do uncover problems, Nate and the Fivethirtyeight team just brush it aside. What a wasted opportunity.
“Fivethirtyeight has millions of readers”: Has anyone considered what the effect of such forecasts is on the eventual voting behavior at large? To what extent do these much-publicized forecasts influence election outcomes?
Rm:
This has come up on the blog! See discussion here.
I played around with the conditional predictions a bit, and it seems like Silver’s team are responding to this blog article:
https://projects.fivethirtyeight.com/trump-biden-election-map/
I am unable to choose Trump as winner in New Jersey! The other states I sampled allowed me to toggle between 3 states, Model prediction, Biden and Trump as winner.
Someone [1] created something similar for the economist model: https://statmodeling.stat.columbia.edu/2020/09/17/election-scenario-explorer-using-economist-election-model/
I noticed at the time that one can also find strange conditional probabilities using that tool. But they seemed to be due to sampling artifacts so I didn’t look deeper [2].
Right now, for example, Mississippi is 99% R / 1% D. Assigning a Democratic victory to the state decreases the probability of a Democratic victory in multiple states from very low to zero (they go from bright red to dark, unchangable, red).
[1] Dan Fernholz and Ric Fernholz
[2] Regarding sampling artifacts, I really dislike the ondulations in the “Modelled popular vote on each day” chart for the period between now and the election. Hopefully they don’t really mean that they forecast higher vote share for Biden on October 29 than on the day before or the day after. There is no reason not to smooth those curves.
(Bias warning: I expect that Biden wins the election. (0 nines))
Hi! While reading the comment threads, I noticed that folks have some incomplete case analysis. I wonder if this can help. I agree with what’s stated: If we assume that Trump wins NJ by a squeaker, then there surely is a landslide elsewhere. However, even from 538’s own model, this has only a 1% chance; I’ll assume it doesn’t happen (2 nines) but bring up similarly-unlikely issues which could happen but probably won’t.
First, how would Trump win NJ? He can’t actually do it via popular vote, so there needs to be a systematic voting error which isn’t correlated to polling results; that is, via corruption or fraud, the NJ election would have to be stolen. Under that scenario, the effort to steal each state is largely independent (stealing NJ only helps steal AK if they’re stealing a lot of states, which is increasingly unlikely) and so we should expect our conditionalization to be a no-op. Of course, 538 doesn’t predict the odds that the President will engage in criminal activity, I think, nor maintain a per-state corruption index. (Somebody ought to.) However, the fact that voter suppression and ballot destruction is already happening nationwide makes me unable to rule out this case.
There’s another possibility, of course. From the history books, the election of President Grant involved a candidate dying right before the Electoral College convened. Suppose that Trump dies from a stroke/etc., and Pence, McConnell, and Biden all die from COVID-19. (This is at least what, 8 nines likely to *not* happen?) In panic, it might come out that the Republicans agree to vote for some particular beloved neoliberal technocrat from near/across the aisle, and the Democrats agree to vote for literally Bernie Sanders. The resulting tent re-alignment might well entirely flip the voting patterns of areas where population density is the main correlate.
This is all speculative bullshit, of course, because the tails are so tiny that they’re basically unexplored. 538 only runs around 50k simulations per total forecast, I think, which is barely enough to probe 3-4 nines of power IMO.
I’m not sure that a negative correlation is that non-sensical.
If you have a candidate A, of unknown political valence, and a deep red state and a deep blue state of equal partisan-swing. I’d expect that candidates probability of winning into those two states to be negatively correlated. Wouldn’t you? If you told me that the candidate had a 50-50 shot in the deep red-state, then I’d guess they’d have a similar chance in the deep-blue state. But if you told me the candidate had a 95% chance of winning the deep-red state, I think they’d have only a 5% chance of winning the deep-blue state.
What would it take for Trump to win New Jersey? Probably exactly those things that would make it impossible to win in Alaska. Trump would have to attack Biden from the left.
Noonebut:
I understand where you’re coming from, but I don’t think your reasoning is correct, given that the voters and candidates have already sorted. See my comments here and here. What it would take for Trump to do better than expected in New Jersey, or Mississippi, or wherever, is some mix of polling errors, opinion swings, and differential turnout—and I’d expect all these to be positively correlated across states. We’re already conditioning on where we are now, which includes the candidates’ issue positions and campaign pitches.
Thank you for taking the time to reply to my comment.
All in favor of adopting the Gelman precedent deeming Scott Adams a “what” rather than a “who”?
Motion carries.
> Also, I don’t know what he means by “directionally the right approach in terms of our model’s takeaways.” His model says that, if Trump wins New Jersey, that he only has a 58% chance of winning Alaska. Now he’s saying that this is directionally the right approach. Does that mean that he thinks that, if Trump wins New Jersey, that his chance of winning in Alaska goes down, but maybe not to 58%? Maybe it goes down from 80% to 65%? Or from 80% to 40%? The thing is, I don’t think it should go down at all. I think that if things actually happen so that Trump wins in New Jersey, that his chance of winning Alaska should go up.
Here is a semi-plausible rationale that I’m going to pull out of…somewhere.
Both models predict NJ as very, very blue (≥99% in both cases). So, _if_ Trump wins NJ, there are two possiblities:
a) a ≤1 in 100 chance event is happening
b) the model is wildly wrong
Basically, a Trump win in NJ should make you way less confident in all of the other parameters in your model, and maybe even the structure of it. It might just mean “the polls were super wrong” but there’s a decent (?) chance something totally different is happening.
Ugh I don’t know how that posted prematurely and the formatting is entirely screwed up anyway. Preview button would have been nice. :/
I don’t know what happened but the post got properly formatted somehow. Gremlins?
Andrew,
First, thanks for performing and sharing this very interesting analysis which has triggered an engaging discussion. My two cents: I find it quite possible (and probably likely) that polling errors could be negatively correlated between certain pairs of states. Indeed, some underlying causes of polling errors could very well be certain deficiencies in polling methodologies that manifest themselves in different (e.g., in negatively correlated) ways in different states depending on their demographic makeup or other characteristics. Let me back this up with some real historical examples, from the 2016 election itself!
Following are some pre-election polling averages, the actual results, and the resulting polling errors, seen in the 2016 election —
=======
Some 2016 states where Trump *over*-performed/Clinton *under*-performed their polls (using a ‘+’ sign for the polling error here):
AK — Pre-Election Polls: Trump +7.4%; Actual Result: Trump +17.3% (Polling Error: +9.9%)
MS — Pre-Election Polls: Trump +13.1%; Actual Result: Trump +18.6% (Polling Error: +5.5%)
ID — Pre-Election Polls: Trump +19.6%; Actual Result: Trump +36.2% (Polling Error: +16.6%)
TN — Pre-Election Polls: Trump +12%; Actual Result: Trump +27.3% (Polling Error: +15.3%)
Some 2016 states where Trump *under*-performed/Clinton *over*-performed their polls (using a ‘-‘ sign for the polling error here):
NJ — Pre-Election Polls: Clinton +11.5%; Actual Result: Clinton +13.3% (Polling Error: -1.8%)
WA — Pre-Election Polls: Clinton +13.3%; Actual Result: Clinton +19.9% (Polling Error: -6.6%)
HI — Pre-Election Polls: Clinton +23.7%; Actual Result: Clinton +34.9% (Polling Error: -11.2%)
CA — Pre-Election Polls: Clinton +22.9%; Actual Result: Clinton +29.7% (Polling Error: -6.8%)
=======
My decision to include AK and MS in the top block (+ve polling error/Trump overperformed) and NJ and WA in the bottom block (-ve polling error/Clinton overperformed) is not a coincidence! These are the pairs of states you have used as examples in your analysis advocating that somehow these negative correlations in polling errors are ‘wrong’. Yet, you have to look no further back than the 2016 election itself to see these very pairs of states had polling errors going in opposite directions. And, the 2016 map includes many such examples.
In fact, a full map of states where Trump overperformed his polls and Clinton overperformed her polls is given here:
https://metrocosm.com/vote-vs-forecasts/
I believe one of your main arguments above is that swings (polling errors) in Trump’s (or Biden’s) favor in one state should be, on average, reflected in all other states, because such errors should be more often than not be indicative of a ‘national swing’. Yet, the 2016 map presents many examples where the swings (polling errors) occurred in opposite directions.
I’d be curious to see what thoughts you might have here. Perhaps I am misunderstanding your main point?
Raj:
See my comment here. Regarding your particular numbers, I have a couple points. First, you’re looking at the difference between the candidates’s support; I’m looking at a candidate’s share of the 2-party vote. When I ask what will happen if Trump does 10% better than predicted in New Jersey, that would be an error of +20% in your formulation. Second, yes, conditional on a zero national error (which is pretty much what happened in 2016), we’ll see lots of negative correlations between states; indeed, those negative correlations will help you get the cancellation to get the near-zero national error—but in this analysis we should not assume a near-zero national error, as the big concern with these forecasts is that they can be off in the country as a whole. Finally, the mathematical reason why Fivethirtyeight gives these implausible state-level forecasts (the implausibly high chances of Trump winning NJ or Biden winning AL, or that forecast interval a few months ago that gave Trump a chance of winning 58% of the vote in Florida, or that map showing Biden winning every state except Wyoming and Vermont (!)), is that they needed to crank up the variance within each state really high to get their desired wide national interval.
All the pieces fit together: negative correlations between states only make sense conditional on a near-zero national uncertainty, but the Fivethirtyeight model has high variances within each state so as to ensure that the national uncertainty is large.
Do you think these variance ‘fudge factors’ get constrained by data in any way or are they just manually tuning them so the probability looks right to them? The latter seems likely, but also if true, reinforces that their model is more about entertainment or PR than scientific learning…
Chris:
I think Nate and the Fivethirtyeight team are doing their best. I don’t know that there’s a bright line separating estimation from hand-tuning. I’m guessing they do a little bit of each. We have several hyperparameters in our model that we set at what seemed to be reasonable values in the sense of giving sensible predictions when applied to data from 2008, 2012, and 2016. We did not set these hyperparameters using a formal estimation process but they are informed by data.
I would be less harsh if they would be willing to publish their model, and walk through the process of model checking, inference, etc. As you say, tuning hyperparameters is fine, but making clear what those are and where they is key for *scientific learning*. What frustrates me about this is how unclear it is why their forecasts differ from yours, if it’s mostly different data conditioned on, or just hand tuned parameters, or both. Of course, they do not claim to be doing ‘political science’, but rather are a for-profit mashup of forecasting and color commentary, so they are of course under no obligation to care what I or anyone else here thinks :)
I look at how an election compares to the previous election, not to pre-election polls. Your actual results for those states are wrong. They don’t match 270towin or Wikipedia. I already stated the Alaska and New Jersey moved in the same direction from 2012 to 2016. Of the ten closest states in 2016, Trump did better than Romney in nine of them, with Arizona as the exception.
What a great post. Polling models (and stats generally) are very important yet opaque. I’m mathematically literate (engineering background), but I’m not a statistician and I can’t figure this stuff out for myself. Really fantastic to have a look under the hood. Thanks!
Could the issue be related to turnout? One way to the result of Trump doing much better in WA and worse in MS is if voters are lazy in states where the results are perceived as predetermined. If Trump voters stay home in MS because obviously he is going to win, and Biden voters stay home in WA for the same reason, then you would get that negative correlation. If the polling is off because they aren’t correctly identifying the people who will actually show up and vote, it seems like that would create a lot of odd effects in actual results vs expected results.
I think there’s a way 538’s negative between-state correlations could be quite reasonable. I was surprised by the negative correlations at first, but then I started thinking about the specific ways polls can be in error. In short, if 538’s model allows for the possibility that polls may overrepresent or underrepresent suburban voters, then this could induce substantial negative correlations between state result predictions.
In detail, the argument is below:
It’s simplest to consider state polls performed right before the election, since in this case any difference between the poll and the actual state election results reflect some poll error. The key question is, “Where does the poll error come from?”
If the error is more than expected from sampling error alone, and if we can assume poll responders are generally honest, then the error has to come from some differences in characteristics between the population who responded to the poll and the population who voted. Further, the different characteristics can’t include any of the variables that the polls already do a good job of blocking on or adjusting for. For example, prominent 2016 state poll errors happened because of higher average education levels among poll responders than among voters — and that the 2016 state polls did not sufficiently block on or adjust for education level.
If we assume that 2020 polls adequately account for education level, basic demographics, and party affiliation, what other variables are there that could still cause large poll errors? Population density is a strong contender because it is one of the strongest correlates of vote choice in the US. Cities heavily vote Democrat and rural areas heavily vote Republican. So polls that overrepresent city dwellers will overestimate Biden’s chances and polls that overrepresent rural dwellers will underestimate Biden’s chances.
But what about people in the suburbs? About half the US lives in suburbs. What happens if polls are overrepresenting or underrepresenting suburbs?!? In some states, suburb-dwellers are majority inclined to vote Democrat, while in other states they are majority-inclined to vote Republican. So if polls overrepresent (or underrepresent) the suburbs, they will overestimate Biden’s chances in some states and underestimate his chances in other states. Allowing for polls to over- or under-represent areas of intermediate population density can therefore induce a substantial negative correlation in model predictions.
My argument here is definitely not quantitative enough, and maybe too intricate for the negative correlations observed in the 538 results. However, it matches well with the idea that 538 is using microdata to determine correlations, and how important the suburban vote is, and how 538 has a lot of experience thinking about the causes of polling error.
Also relevant is Raj’s instructive comment earlier in this thread. Raj’s comment shows polling errors going in opposite directions for many pairs of states (such as MS and WA) in previous elections.
“Allowing for polls to over- or under-represent areas of intermediate population density”
I think your reasoning is right but I was looking at it a bit differently. Suppose you run the 538 model with the assumption that New Jersey goes Republican, and New Jersey is considered by the model to have one of the highest population densities. In order to reconcile the “fundamental” of population density with the result, the model nudges “high population density” from leaning Democrat to slightly leaning Republican based upon the New Jersey result. Next the model attempts to reconcile the tweaked variable “population density” with the national poll average. This step could require that “low population density” shifts to slightly leaning Democrat to make all the numbers reasonable. Then when it calculates Alaska, where almost everyone lives in the sticks, the other factors – polls and other fundamentals – get swamped by the effects of having a 98% rural population. So now even though Trump won New Jersey the model shows him less likely to win Alaska because the New Jersey results flipped the population density correlation.
I’m not sure how you would prevent this sort of thing without making the model insensitive to changes, which would in turn defeat the purpose of having a plug-and-play model.
Yeah, I agree your suggestion could explain a number of the results posted above too!
A lot of people’s comments assume there is no realistic way for *unconditional* between-state correlations to be negative. But their assumption is incorrect! For me, that is the main point of my argument that polls may over- or under-represent suburbs, and that models accounting for this over- or under-representation can show *unconditional* negative correlations between state results.
Now, maybe the unconditional negative correlations in 538’s results are too large to be explained by the model considering over- or under-representation of suburbs in polls. I don’t know and don’t see how I could check. Maybe someone who knows more about polling that I do could say more. But this is at least a mechanism that can realistically cause unconditional negative between-state correlations in model predictions.
>>Alaska, where almost everyone lives in the sticks, the other factors – polls and other fundamentals – get swamped by the effects of having a 98% rural population.
I actually don’t think that’s correct — Anchorage metro area is more than half the state’s population. Now, Census Bureau definitions of metro areas can be very wide & include quite rural areas – but even the city-limits population is almost 40% of the state’s.
It was a thought experiment, I did not look up anything, you can substitute in Wyoming if you want.
I think my proposed explanation is quite simple and can account for the negative correlations. It is also testable, although I personally lack the chops to write the code.
I’m responding to Divalent’s reply on October 25 at 3:32 P.M. It is true that normally the Democrat wins New Jersey and the Republican wins Alaska. However, that doesn’t mean the states move in opposite directions from one election to the next. From 2004 to 2008, 2008 to 2012, and 2012 to 2016, Alaska and New Jersey moved in the same direction. Obama in 2008 did better than Kerry in 2004, Obama did better in 2012 than 2008, and Trump did better than Romney. Trump winning New Jersey and Biden winning Alaska are each extremely unlikely. When candidates have surprise wins in states, they normally win. Examples are Bush winning New Hampshire in 2000; Obama winning Virginia, North Carolina, and Indiana in 2008; and Trump winning Pennsylvania, Michigan, and Wisconsin in 2016. If you knew the morning of Election Day in 2016 that Trump would win Pennsylvania, Michigan, and Wisconsin, you would have expected him to win the Electoral College. I don’t think anyone who knew those three results would have predicted that Clinton would win North Carolina or Georgia to win the Electoral College without states that normally vote for the Democrat.
There are 50C2 = 1,225 pairs of states. Even if a model is great, if you look at every pair of states you will find some that don’t make sense.
Could this be caused by the different weighting of polls? 538 apparently has different poll vs. factors weightings for the different states. As of writing this comment, NJ says it is 71% polls. AK is 63%. Other examples: PA = 87%, WI = 82%, MS = 60%, WA = 66%.
e.g., in the “Which polls are influencing the forecast..” box:
https://projects.fivethirtyeight.com/2020-election-forecast/new-jersey/
https://projects.fivethirtyeight.com/2020-election-forecast/alaska/
Another observation, the data is supporting their interactive state selector map here: https://projects.fivethirtyeight.com/trump-biden-election-map/
It says, “Candidates can’t be selected if they start off with less than a 1.5% chance of winning that state.” – a criteria which NJ and WA meet. You can’t even select those states going from Trump when playing around with the map. Could this be a source of a blindspot in their testing? If people can’t select them, then maybe they didn’t bother testing those scenarios as robustly as say what happens if PA or WI flips one way or the other.
If a candidate is appealing to Washington, they would most likely NOT be appealing to Alabama. You are assuming that if Trump won Washington there must be a REALLY big conservative swing in the country which means that he would appeal to Alabama for sure. Rather, if Trump were to win California he would have had to change his profile to a degree that would turn off Alaska/Mississippi. The negative correlation is because you cannot appeal to both at the same time. I think he probably has the correlation factor based on the DATA, which shows a negative correlation. The causation is that candidates who appeal to Washington simply do not appeal to Alabama.
Stephanie:
You’re right that the states are very different, but the differences between the states has already been baked into their relative positions in previous elections as well as any current poll information. See my discussion of “valence issues” here.
Are such negative correlations that unreasonable? it’s worth considering what such extreme outcomes mean. Taking the case of Trump winning Washington, this would imply we seriously misunderstood voter leanings. Presumably in a way that could be negatively correlated with other states.
For example if black voters overwhelmingly turned out for Trump, I would expect white supremacists to overwhelmingly turn out for Biden.
I guess the point is, for Trump to win Washington something has to go seriously wrong – and that thing could imply that maybe we got Mississippi really wrong the other way. It could be an artifact, but maybe it’s a reasonable one?
Shahar,
I think you are making the same point I made farther up the thread in response to Fogpine. You wrote:
“For example if black voters overwhelmingly turned out for Trump, I would expect white supremacists to overwhelmingly turn out for Biden.”
I wouldn’t, but the model has to in order to reconcile with the national vote count. So the negative correlations occur spontaneously. This is clearly the most parsimonious explanation.
Matt:
I think it’s simpler than that. The negative correlations arose because the Fivethirtyeight team accidentally included an error term with a negative correlation. Had they only included error terms with positive correlations, their forecast still could’ve accounted for demographic and regional shifts, and we would’t be having this conversation. I think they just messed up and now lots of people are trying to retroactively have it make sense.
Hi Andrew! Thanks for your cool blog post. I regularly follow your blog as well as FiveThirtyEight (though their site mainly for their sports predictions, for leisure).
I feel that there is a possibility of negative correlations between states that is intentional and accurately reflecting the real world. Suppose we have a variable that measures “voter polarization” in each state. Being able to predict an “increase in polarization” would mean different things in different states; it may mean simultaneously increased support for Trump in one state and decreased support for Trump in another state. Hence, observing increased support for Trump in the former state could lead one to predict post-forma a higher probability that an “increase in polarization” occured (or a higher expected increase in polarization), and thereby a lower conditional probability of Trump winning the latter state. Of course I have no idea how strong this effect could be, or whether it applies to the example states New Jersey and Alaska.
I could see an argument for it. We have many national polls. So there’s a lot of evidence we know just how popular Trump and Biden are nationally. There are also a lot of polls of the swing states. But, how many polls have there been of WA or MS? We’re just making assumptions that the people there haven’t changed their minds in four years. However, that’s a weak prior. We know there have been some very big swings in other states in only two years.
So, we just told the model we have absolute proof that Trump is a lot more popular in WA than we thought. But we think we know his national approval rating! Ergo, he’s less popular in some other states than we thought. Which states? Probably not any of the ones we have a lot of polls of, because we think we know about them. Probably not any of the states that are demographically similar to WA, like OR or VT. It’s very likely states that are nothing like WA, and that we’ve just been making assumptions about too.
Sorry if someone else brought this up in a comment I haven’t gotten to yet.
Lorehead:
No, it doesn’t work that way. The simulations are not conditional on the national support for the candidates. In real life if Trump does much better than expected in Alabama, I think this will be an indication that he’s doing much better than expected in Washington and other states.
If you’re searching a space of 50K data points for points where two independent events both happened with p=0.01, you’d expect to find n=5. Maybe those samples are just so small, they have a lot of sampling error in this dataset?
Lorehead:
That could happen but it’s not happening here; if you look at the above scatterplots there are enough points in the tails to draw conclusions without worrying about simulation variability. I’m pretty sure that if you took a million simulations from the same model you’d get pretty much the same results.
Are polls like grades? As I understand the current thinking, grades in school are a good indicator of future grades, but a less good indicator of future success. Are polls the same in that they’re good predictors of future polls, but less good indicators of elections? When it boils down to it, the poll itself is attempting to get at voter intent (or the actual vote income) through survey questions with associated demographics. There’s also past election data that includes outcomes at the electoral college level.
I’ve been thinking about model evaluation more after the workflow paper, and it dawned on me that all of our checks have to be data based when we don’t know the truth. This point is always driven home to me when I present the Lotka-Volterra predator/prey model based on the Hudson Bay Co. pelt data. We don’t know the populations of hares and lynxes, so we have to assume the number of pelts collected is linearly related to the population sizes. What we really model is predicted pelt collection, because that’s our data.
In contrast to story time, as Andrew calls it, we recommend evaluating models on these three quantitative grounds.
Instead of this methodology, what I see is an evaluation by gut feel or comparison to betting markets of the marginal predictions for the whole election, states, or pairs/triples, etc. of states. Here’s the paper’s comment in section 5, “Calibration, Uncertainty, and What Is Forecast” (the paper’s cited and linked at the bottom).
On the flip side, if we have sharp (low entropy), well-calibrated predictions for future polls, maybe we don’t want to change the poll component of the model, but rather consider it as an input to some other kind of model. If we don’t have calibration for the polls themselves or if the predictions aren’t very sharp, we should investigate to see where the model is failing to capture patterns in the data (either in-sample or held out). It seems very roundabout to examine marginal predictions in Pennsylvania by gut feeling rather than measuring our cross-validation behavior on the polls themselves.
Also, I was curious about noisy measurement models. Does anyone build in noisy measurement to account for respondents not accurately reporting their demographics or intentions? In addition to outright lying, this can arise from misunderstanding the questions or clerical errors. Section 2.4 of the paper, despite being headed “Measurement error”, isn’t a data measurement error model.
P.S. What was the motivation for redacting the hyperparameters?
Will they be made available later in the interest of reproducibility after the election? As of now (1.30 EST pm election day), they’re also redacted in the GitHub repo. I suppose I could auction off my old copy of the Stan source code to the highest bidder—nobody asked me to sign an NDA.
Reference
Bob:
I think the reason for redacting the hyperparameters was that the Economist people didn’t want some third party to be able to run our code and duplicate the entire forecast in real time. This came up a few months ago when we were putting together the forecast. I suggested right away that we make all the data and code freely shared, and they said just some of it, not all. At that time I accepted this reasoning, and what the Economist does with its code is up to them in any case, but in retrospect I’m not sure why they did this. Even if some other group were to duplicate our forecast and post it elsewhere, who cares? It’s not like people would go there rather than see the real thing at the Economist site, right? So I don’t really understand the rationale for not sharing everything.
Regarding the polls: vote-intention questions have the unusual aspect that, unlike most other opinion questions, there is a ground truth that they can be compared to. That’s how we did that empirical analysis of state polling errors a few years ago. The 2020 election has this new feature that many ballots are being challenged, or threatened to be challenged, even after they are being cast, on a much larger scale than in past recent elections.
In your comment, you mention prior predictive checks, posterior predictive checks, and hold-out evaluation or cross validation. We did all three of these things in developing our model! I didn’t talk much about these because we’ve already done them, and in the blog I’m typically more interested in working through the things I’m currently struggling with, rather than talking about what we’ve already done.
Regarding the gut-check statement that 96% seems like too high a Biden win probability: (a) this is in addition to, not a replacement for, data-based checks mentioned in the previous paragraph; and (b) I don’t just leave the gut check hanging. I map it back to specific assumptions in the model. I don’t know if we fully explained this “trail of bread crumbs” thing in our Bayesian Workflow paper, but it’s one of the things I was thinking of when writing about “model understanding” as one of the key steps in the workflow.
Finally, regarding the specific issues with the Fivethirtyeight forecast: Here the key is to detach from the default assumption that the forecast is correct until proven otherwise. A better way of thinking about this is that the forecast is a complicated human product with flaws that are waiting to be discovered. I sincerely doubt that the builders of the Fivethirtyeight forecast thought that it was sensible to think that learning that Trump won NJ would imply that PA is a tossup. To put it another way, that is a very strong assumption that came into the model implicitly. This problem might not occur within the range of the observable data, but it’s an opening into a better understanding of what the model is doing and where it can and can’t be trusted. Cross-validating on poll data is fine, but again recall that due to the multilevel structure of the problem, we’re really just at N=15 or N=4 or something like that. Ultimately our model has to be guided by prior assumptions (as indeed is the Fivethirtyeight model: they used their prior understanding to set up their error terms; they just didn’t fully work through the mathematical implications of their model, leading to silly predictions).