“Statistics is widely understood to provide a body of techniques for ‘modeling data.'”

John “Bayesian Data Analysis” Carlin writes

Recent developments in the methodology of epidemiological research have emphasized the importance of achieving clarity of purpose by classifying research questions into one of three types: descriptive, predictive, and causal. . . .

I [Carlin] do not believe that studies aiming to “identify” independent predictors or “prognostic factors” are addressing well-defined research questions. Indeed, beyond the issues already raised, there is a broader question of the extent to which it is ever sensible to frame a research question as if it could be answered dichotomously, as in “is this an (independent) prognostic factor?” Prediction questions, which include prognosis, are those that involve the development of a model or algorithm to provide predictions of outcomes using available variables that are potential predictors.

This all makes sense. I kinda think that descriptive, predictive, and causal are all the same thing–or, more precisely, that “descriptive” and “causal” are special cases of “predictive,” under different conditions. But if you want to divide them into three tasks, sure, go for it. Personally, I’d rather divide statistics into the goals of exploration, estimation, and discrimination, but I think that’s because I’m thinking in a more general “data science” perspective, whereas John is focusing more on the more traditional problem of inference.

But, yes, I agree with him 100% on avoiding dichotomization, a topic that Sander Greenland, I, and others have been screaming about for a long time–indeed, John and I contributed to the anti-dichotomization theme in our book Bayesian Data Analysis, in that we focused on model building and inference within a model, rather than on the then-fashionable problem of choosing among or comparing models using Bayes factors. So, yes on that.

John continues:

Some variables may have greater predictive value than others, but this should be assessed by comparing the predictive value of the model or algorithm with and without the use of that variable, not by examining its “independent effect” in a multivariable regression model.

I’m confused on this point. I mean, sure, I agree that you shouldn’t label a regression coefficient as an “independent effect”; indeed, I always use the terms “predictors” and “outcome” rather than “independent and dependent variables.” Beyond this, I’m not quite sure what John is suggesting. Suppose you have a predictor of interest, x3, and you’ve fit the model y ~ x1 + x2 + x3 (for convenience using standard R notation). I guess John is saying, don’t just look at the coefficient for x3 in that model; also compare it to the model y ~ x1 + x2. Maybe this is a good idea–it’s not something I’ve thought about for a while. Is this the same as what used to be called “partial regression coefficients”? I remember from the statistical literature in the 1960s and 1970s that there was a lot of work on methods for understanding what happens in linear regression when you add one variable at a time. Perhaps it would be good to revisit some of those ideas, and maybe it’s a mistake that we don’t cover them in Regression and Other Stories.

I also want to plug my paper with Guido Imbens (also included as Section 21.5 in Regression and Other Stories), Why ask why? Forward causal inference and reverse causal questions. Our point there is that it can be a good idea to search for prognostic factors in observational data, not with the idea this will identify causal effects but rather as a way of understanding what’s missing from our existing models.

Finally, John writes:

More broadly, debates on whether to “adjust” or not for certain variables in a regression model can only be answered by situating the analysis within a sharply defined research question and a sharply defined rationale for specifying a regression model in the first place.

I don’t get this at all. First I don’t get why “adjust” is in scare quotes; second, ummm, yeah, it’s always good to have a sharply defined research question, but in the meantime people are always making comparisons, and so let’s do what adjusting as we can. For example, in an epidemiology study it should pretty much always be a good idea to adjust for age and smoking history. Or maybe John would say that the rationale for adjusting for age and smoking history is sharply defined, in which case maybe we’re in agreement.

To put it another way, it’s often a good idea to have a sharply defined research question–but that applies in general, not just for statistical adjustments. I think it’s also true that it’s better to have a sharply defined research question when performing a randomized clinical trial. A randomized clinical trial gives identification for the sample average treatment effect in any case–but without a sharply defined research question, it’s not clear what can be done with such an estimate.

So I’m wary of John singling out adjustment in his criticisms, as I fear his article will be taken as implying that, if you don’t try to adjust, that everything will be ok.

I sent the above comments to John, and he replied:

– I [John] don’t think it helps to say everything is actually prediction — it kinda goes against the idea of sharp specification of purpose! I’m not sure if my interest is “the traditional problem of inference” (not sure what you mean by that). I see it being about drawing conclusions that will be relevant to policies, decisions and practices in medicine and health. In this area, the question is usually causal (people want to say something about the effect of an intervention or exposure) but could be descriptive (“burden of disease” etc) or prediction (we want an algorithm for advising patients etc). The desired answer to the question (if causal or descriptive), and therefore the embodiment of the “sharp” question, should be a well-defined population parameter — as Don Rubin used to say, what would the number be if you had the whole population of interest (and could measure potential outcomes under both conditions for a causal question)…

– You write: “Suppose you have a predictor of interest, x3, and you’ve fit the model y ~ x1 + x2 + x3…” I can’t make sense of this unless you tell me why you’ve specified this model and what you hope to learn (re question of interest) from it. See all the stuff about “true model myth” in our papers.

– Re “it should pretty much always be a good idea to adjust for age and smoking history”, no!!! This is the whole point of a lot of discussion in modern epidemiology/ causal inference, that you should consider very carefully what you “adjust for” and why. The “scare” quotes are actually real quotes, reflecting that people use this terminology (of adjustment) with a whole range of ill-defined intentions, so the term “adjust for” is not well defined. There are some brief examples in the short paper that you’re commenting on that try to highlight why “adjusting” is often poorly understood and not serving a well-defined purpose. There’s a lot of writing in the epi causal inference literature about the dangers of over- or under-adjusting, and methods (usually using DAGs and always requiring substantive non-statistical assumptions) to figure out what should be adjusted for (in causal questions).

In response to John’s response, let me just say:

– The problems that he refers to, of causal inference, decision making, and description, can all be characterized as predictions conditional on some inputs. I agree 100% with John that it’s important to consider your applied goals. My statement, “‘descriptive’ and ‘causal’ are special cases of ‘predictive,’ under different conditions,” is not at all meant to deny the relevance of applied goals. The key question is what to predict, and “prediction” does not just mean prediction for new data that look just like your observed data, or for some specified test set, or whatever.

– I can change my example with x1, x2, and x3 to a real-world example from political science, for example a model of elections of legislative elections from our 1990 paper where y = Republican share of the two party vote in a district, x1 = Republican vote share in the previous election, x2 = incumbency status in the current election, x3 = incumbent party indicator. I don’t actually think that linear regression is the best model here (see our update from 2008). Anyway, in this model our goal was to estimate the incumbency advantage, defined as the expected difference in vote share for a party if an incumbent was running, compared to if it were an open seat. Our reason for including multiple predictors in our regression is not because we think any of our models are approximating a true data generating process or because we think that adjustment is sufficient to control for all confounding bias. We’re just doing the best we can here, keeping our applied goals in mind.

– Regarding age and smoking history: Sure, it depends on the goals. I was imagining a study of some medical intervention with treatment and control groups, where the patients have a mix of ages, and the outcome of interest is survival. For that sort of problem you’ll want to adjust for age and pre-treatment smoking history: even in a randomized trial there will typically be some imbalance on these important predictors, and in an observational study the imbalance can be large. And, relevant to John’s point, how you do this adjustment can be important. For example, simply including age as a linear predictor or an indicator for age > 65 might not do a good job. It also can be important for the model to the treatment effect to vary by age and smoking history, and I wouldn’t want to imply that any particular adjustment will solve all problems here. What is a reasonable adjustment procedure will depend on context, and problem-specific knowledge will help.

John also reminded me that a couple years ago we posted on John and Margarita Moreno-Betancur’s preprint, “On the Uses and Abuses of Regression Models: A Call for Reform of Statistical Practice and Teaching.” In the discussion thread, John wrote:

The idea that the method or technique is central is the fundamental problem that we identify, and we propose that this can only be addressed by turning the initial focus of teaching to the purpose or research question. This needs to be done very seriously, i.e. there should be no “general theory” of regression models, or of how to fit them “well” . . .

There has been a longstanding tendency to identify the role of the biostatistician with models and estimation techniques, undervaluing the essential role of statistical thinking in framing well-specified research questions. In contrast, our key assertion is that the three types of question need to be taken seriously, at the beginning of every analytic investigation. Identifying the type of question requires considerable reflection and discussion between statistician and collaborator. Once identified though, very briefly, if you have a prediction question, you might then think about tools A and B for developing prediction algorithms (multivariable regression being a great one if done well)… If you have a descriptive question, the first thoughts for analysis might be simple descriptive statistics, but there might be complicating issues to attend to (re sampling bias, perhaps, for which some regression technology might help). If you have a causal question, then you need to get serious about defining the question precisely, in terms of a target parameter or estimand, before thinking about the potential role for models to assist in estimating that quantity. Rather rarely, we suggest, will this target parameter be naturally defined by a coefficient in a regression model, although under carefully considered assumptions a regression coefficient might be relevant.

I think I agree with everything John is saying here–as long as you’ll accept my interpretation! When John writes, “there should be no ‘general theory’ of regression models, or of how to fit them ‘well'” . . . ummmm, my colleagues and I wrote this book, Regression and Other Stories, so obviously we do think there’s general advice we can give for regression models, and of course there’s mathematical theory (least squares, etc.). Is there a “general theory”? I guess it depends what is meant by that. In our book we recommend starting simple and then building up from there as needed based on the applied goals. This is some sort of principle, but it’s not a “general theory,” if by that John means a particular algorithm such as stepwise regression or lasso or horseshoe or whatever.

Then again, for regression there can never be a general theory, in that the most important part of a regression is typically the choice of what predictors to include. Indeed, I’ve been loudly (and, I think, correctly) critical of regression discontinuity analyses that don’t include enough predictors to account for pre-treatment differences between treatment and control. (An extreme example of this was a regression predicting remaining years of life which did not include current age as a predictor.)

The year after that discussion, John and Margarita’s paper was published;
here’s the final version. The journal also published some discussions and a rejoinder.

I read these two articles in full, and I pretty much agree with everything that John and Margarita are saying. I agree, for example, with their statement that “it is not logically possible for a single multivariable regression model,” and I think the points they make in their article are consistent with the approaches recommended in our books, Bayesian Data Analysis, Data Analysis Using Regression and Multilevel/Hierarchical Models, Regression and Other Stories, and the forthcoming Bayesian Workflow. Indeed, their recommendations also jibe with the statistical analyses performed in our book, Red State, Blue State, Rich State, Poor State.

Given all this, perhaps the question is, what is the role of default statistical procedures and generic statistical advice? We wrote Regression and Other Stories based on the knowledge that researchers will be making comparisons with various predictive and conditionally predictive goals, including causal inference, and they will be applying linear and logistic regressions to this task. With that in mind, I think it’s valuable to teach people how to understand the meaning of the expression, y = a + bx + error, along with more complicated expressions, how to interpret standard errors, how to graph data and fitted regression lines, how to avoid common pitfalls in understanding, and so forth.

It’s kinda like . . . math is used for all sorts of purposes. You can’t “do calculus” in an applied sense without having some sense of your real-world goals. Even so, general-purpose math textbooks can be useful. There are general techniques for differentiation and integration, general ways of understanding concepts such as the slope of a line and the area under a curve, etc.

To get back to statistics and regression modeling, here’s the beginning of Section 1.1 of Regression and Other Stories:

I guess we take it as a given that the only reason people are doing this is that they have some applied goals. We continue right away in that chapter with several examples.

That said, I get it when John and Margarita lament that “statistics is widely understood to provide a body of techniques for ‘modeling data.'” This is a concern. In our books we always try to start with the applied question before getting to the data, but sometimes we take the application for granted and don’t spell out the goals. Also, just as mathematical methods exist in an abstract sense without any application (2*2=4, hey!), various statistical methods and principles exist independently of examples, and indeed these are the kind of things that are worth teaching in a statistics course. So it’s complicated. I don’t think there are any easy answers. Maybe there should be a short new book explaining the ideas in John and Margarita’s article, but I don’t think this would take the place of books like Regression and Other Stories and Bayesian Workflow, which are focused on techniques for building models, fitting them, and understanding them once they’ve been fit, nor will it take the place of more mathematical books that derive the methods that we use.
“Harvard dean made $150,000 as witness in Tylenol suits”

I came across the above-titled article in the newspaper today:

The dean of the Harvard T. H. Chan School of Public Health, who consulted with top Trump health officials ahead of Monday’s warning about Tylenol and autism, was paid at least $150,000 to serve as an expert witness on behalf of plaintiffs in lawsuits against the maker of Tylenol.

Dr. Andrea Baccarelli, a leading epidemiologist, disclosed the figure in a court deposition he gave in the summer of 2023 that is publicly available in federal court filings and was reviewed by The New York Times. He had previously disclosed that he had served as an expert witness in the case but not how much money he had made.

A federal judge dismissed the suits for lack of reliable scientific evidence. . . .

In the decision to dismiss the lawsuits, the judge, Denise Cote, agreed with lawyers for the defendants that Dr. Baccarelli had “cherry-picked and misrepresented study results” in his testimony and was therefore “unreliable.”

”I work for more than 200 hours, so it’s about $150,000,” Dr. Baccarelli said in the deposition.

Hmmm . . . $150,000/200 = $750/hour. That’s pretty close to my consulting rate of $800/hour.

I’ll tell ya this: if you want me to cherry pick and misrepresent study results, you’re gonna have to pay me a lot more than $750 an hour, bud.

(That was just a joke. I will never cherry pick and misrepresent study results. That’s not what I do as a consultant.)

It’s funny how the whole Harvard thing gets slung around. A government official is quoted as saying:

“But, to quote the dean of the Harvard School of Public Health: ‘There is a causal relationship between prenatal acetaminophen use and neurodevelopmental disorders of A.D.H.D. and autism spectrum disorder.’”

Harvard . . . isn’t that where that Surgisphere guy worked? Harvard’s the place that promoted the Gospel of Jesus’s wife? And Harvard’s the place where they did the bad research on mind-body healing, and the place where they said “the replication rate in psychology is quite high—indeed, it is statistically indistinguishable from 100%”. And where the preening disgraced primatologist used to work? The home of the law school plagiarist with a penchant for bowling metaphors. I even heard a rumor that there was a Harvard statistics professor who made 2 million dollars consulting for cigarette companies.

All right, then.

Seeking feedback from clinicians on AI as diagnostic decision support

This is Jessica. My collaborators and I have been exploring decision-theoretic approaches to fine-tuning language model agents to support expert decision-making, and we’re now seeking clinicians or other medical professionals for a brief (~30 min) session to get feedback. We are particularly interested in talking to clinicians with some experience in diagnosing cardiac dysfunction. We’ll share a small number of cases and preview what our method does to get your thoughts on how it aligns (or doesn’t align) with your domain knowledge and how you think it would affect the diagnostic process.

If you are available or would like more information, please contact me or Ph.D. student Ziyang Guo, who is leading this work ([email protected]). We’ll provide gift cards in appreciation of your time.

FDA guidance on Bayesian clinical trials

This is Witold.

The Food & Drug Administration just released a guidance for industry document on “Use of Bayesian Methodology in Clinical Trials of Drug and Biological Products”:

This draft guidance provides guidance to sponsors and applicants submitting investigational new drug applications (INDs), new drug applications (NDAs), biologics licensing applications (BLAs), or supplemental applications on the appropriate use of Bayesian methods in clinical trials. Bayesian methods can be used in various ways in clinical trials. For example, Bayesian calculations can be used to govern the timing and adaptation rules for an interim analysis in an adaptive design, to inform design elements (e.g., dose selection) for subsequent clinical trials, or to support primary inference in a trial. The primary focus of this guidance is on the use of Bayesian methods to support primary inference in clinical trials intended to support the effectiveness and safety of drugs.

Find it here. It’s not a very long read, about 20 pages of pretty accessible text.

I saw several people on Twitter talking it up, with someone claiming that “FDA is Bayesian now!”. Well, apparently that level of analysis is the entry bar for punditry, so that instantly made me feel qualified.

More seriously though, I bet some of the readers will have interesting takes on this, so I thought it’s good to post it and have a discussion in comments. From my side, I will try to give a short understanding of what such a document is and a few impressions.


First of all, what is a guidance document? The FDA issues and updates dozens of such documents every year. First time you encounter one, it is a bit entertaining, because it opens up with a Big Disclaimer stating not only that this sets out FDA’s “thinking” and is not binding, but even all the way down to explaining the meaning of word “should”. Why? Well, as a gov’t agency the FDA sensibly doesn’t want to give an impression of creating a law. More broadly, however, it wants to keep their options open in what they approve and what they don’t.

But then why issue guidance at all? In some sense it is pharma companies that want to have their hands tied. Drug developers are very risk averse—and for a good reason. Given the scale of investment involved in clinical trials, high uncertainty, and timelines that can stretch into decades, producers just crave predictability. So instead of taking time to interact with the FDA to vet every trial decision, it’s good to have a set of rules.

By the way, each FDA division can have its own guidance. This new one deals with drugs and vaccines. FDA released a guidance for Bayesian stats in medical device clinical trials back in 2010. This makes sense, these trials are quite different from drug or vaccine trials and people have used Bayesian techniques there for a long time, or so I’m told—I have not read that 2010 guidance (although I can report that the actual header for the doc says “baysian statistics”, sic).

Is this related to the current US gov’t and recent changes at the FDA? That’s very unlikely. (Sorry to disappoint another Twitter commenter who concluded that “Trump admin is Bayesian”.) When I blogged about this three years ago, the guidance was already scheduled to come out in 2025. Documents like this do take a long while to create.


Onto the document. As I said, I will just share a few impressions and hope that others will have more interesting comments. (Or I may also just write a second blog post on this.) Here is what jumps out scrolling through the doc:

(1) There are some basic definitions to start with, but I don’t think this matters much. It’s interesting, however, to see what type of uses the guidance lists in the second section. That probably covers the type of trials that drug and vaccine developers want to run—or that the FDA would like to see more of.

(2) The list of use cases has six categories, five of which are roughly about “borrowing”: across clinical trial phases, across subpopulations of patients, across age groups (especially extrapolating to children), or across diseases. It’s very nice that this general idea is broken down across several practical categories and given actual real-life examples in each. Lastly, there is a slightly different category of a problem, which is dose-finding, especially in cancer drugs, where you try to balance toxicity with drug’s effect.

(3) What about “fancier” adaptive types of trials? For example, trials where you add/remove treatment/dosages arms dynamically and seamlessly move across clinical trial phases. They are already covered elsewhere and the FDA is working on a separate broader guidance on “complex innovative designs”. So I don’t think there is too much about them here, although they are covered in discussion of priors.

(4) Then there are sections on success criteria and operating characteristics, which set out how to design the trials. The first proposed approach to design is… “Calibration to Type I Error Rate”. That does not sound encouraging! Frank Harrel had a great short blog post that gave a practical example of a trial where mixing Bayesian and frequentist reasoning can lead to a mess. So at first glance this is a bit disappointing…

(5) …but right next the document talks about cases where sponsor and the FDA agree to not calibrate to Type I error. There is guidance on doing things more “Bayesianly”: for example, there is even “Success Criteria Based on Benefit-Risk Assessment or Decision-Theoretic Approaches”. “A decision-theoretic approach might include assessment of the potential negative consequences of approving an ineffective drug or of not approving an effective drug.” That’s very nice! However, at the same time it’s also highly generic—the bit I just listed is limited to a single paragraph. It’s hard for me to imagine someone just reading this and confidently concluding that they can build a trial around it.

OK, I am skimming at this point, as I think this is 1,000 words already. This will probably be a follow-up blog.

(6) Then there is a long section on priors. There are many reassuring bits, because examples seem quite specific. There is a discussion of what should be considered in construction of priors. There is a discussion of “dynamic discounting”. Pretty complex and detailed. But then in talking about borrowing, the guidance says: “Areas where informative priors have been most often proposed include pediatrics and rare diseases. Additional areas can be considered on a case-by-case basis, and FDA advises early discussion of such proposals with the Agency.” Again, if this is on “case-by-case” basis, apart from two areas where we already are Bayesian, then a guidance does not seem very helpful.


So… is the FDA Bayesian now? Well, the real question should be, does a guidance document give trial designers enough confidence to run Bayesian clinical trials in situations where there is a rationale to run a Bayesian trial? Time will tell, for now there is probably a great “the guidance is directionally correct, but is it significant?” joke in there somewhere.

Horseshoe theory meets cost-benefit analysis. Horseshoe wins.

Here’s the news:

For decades, the Environmental Protection Agency has calculated the health benefits of reducing air pollution, using the cost estimates of avoided asthma attacks and premature deaths to justify clean-air rules.

Not anymore.

Under President Trump, the E.P.A. plans to stop tallying gains from the health benefits caused by curbing two of the most widespread deadly air pollutants, fine particulate matter and ozone . . .

It’s a seismic shift that runs counter to the E.P.A.’s mission statement, which says the agency’s core responsibility is to protect human health and the environment, environmental law experts said. . .

Now to the specifics:

Under the Biden administration, the E.P.A. tightened the amount of PM2.5 that could be emitted by industrial facilities. It estimated that the rule would prevent up to 4,500 premature deaths and 290,000 lost workdays in 2032 alone. For every $1 spent on reducing PM2.5, the agency said, there could be as much as $77 in health benefits.

But the Trump administration contends that these estimates are doubtful and said the E.P.A. would no longer take health effects into account in the cost-benefit analyses necessary for clean-air regulations, according to the documents. Instead, the agency would estimate only the costs to businesses of complying with the rules.

And some background:

Over the past four decades, different administrations have used different estimates of the monetary value of a human life in cost-benefit analyses. But until now, no administration has counted it as zero.

But they’re not ignoring health outcomes; they’re just not including them in the cost-benefit calculation:

Carolyn Holran, an E.P.A. spokeswoman, said in an email that the agency was still weighing the health effects of PM2.5 and ozone, but wouldn’t be assigning them a dollar value in cost-benefit analyses. “E.P.A., like the agency always has, is still considering the impacts that PM2.5 and ozone emissions have on human health,” Ms. Holran said. “Not monetizing does not equal not considering or not valuing the human health impact.”

In a Dec. 11 email reviewed by The Times, an E.P.A. supervisor wrote to his employees that political appointees in the Office of Air and Radiation planned to insert language about the “uncertain” benefits of reducing PM2.5 and ozone in all new clean-air rules.

The language states that “historically, the E.P.A.’s analytical practices often provided the public with false precision and confidence regarding the monetized impacts of fine particulate matter (PM2.5) and ozone.” It says that “to rectify this error, the E.P.A. is no longer monetizing benefits from PM2.5 and ozone.”

It’s possible that this won’t make it through the courts, though:

James Goodwin, the interim co-executive director and policy director at the Center for Progressive Reform, an advocacy group, said the move appeared to ignore the 2015 Supreme Court case Michigan v. E.P.A. In the majority opinion, Justice Antonin Scalia wrote that if an agency considers the benefits of a regulation, it must also consider the costs, and vice versa.

“Scalia was making the point that you can’t judge a regulation’s reasonableness just by looking at one side of the ledger,” Mr. Goodwin said.

Cost-benefit analysis, putting dollars and lives on a common scale

As a political scientist, what’s most interesting to me about this to me is the government’s objection to putting dollars and lives on a common scale.

This sort of cost-benefit analysis is something I’ve read a lot about and thought a lot about (as in this paper with Phil on decision making for home radon risks and remediation), and I associate criticisms of cost-benefit analysis as coming from the left.

The usual argument, as I’ve seen it, goes as follows. An environmental regulation is being considered. From the right or the technocratic center, the position is that the potential benefits of the regulation (typically health improvements, although in some settings there can be economic benefits as well relating to tourism or property values or whatever) should be weight against the costs of compliance. On the left, the position is sometimes taken that exposure thresholds should be set at zero and that no dollar value can be placed on a human life. In this setting, cost-benefit analysis is being used to calibrate, and possibly reject, environmental regulations.

For reasons discussed amply in the literature on decision analysis and in our own above-linked paper, I think it does make sense to put dollars and lives on a common scale, not because dollars and lives are equivalent but because this is a way to formalize the tradeoffs that must always be made when considering risks. I won’t get into all that here except to say that I think our position in that paper is, roughly speaking, the center-right position, as compared to the position on the left that such a tradeoff is inherently problematic.

This is not to say that I disagree with all leftist critiques of cost-benefit analyses. Indeed, one of the earliest posts on this blog, back in 2004, discussed the research of left-leaning economist Peter Dorman explaining what was wrong with the work on compensating wage differentials for workplace risk. I found Dorman’s arguments entirely convincing. To link this to my paragraph immediately above, my objection in that setting is not to putting dollars and lives on the same scale; rather, it’s an objection to the statistical method (regression without adjusting for enough pre-treatment variables), to the workflow involved (fitting lots of regressions and stopping when the resulting estimate has the right sign and seems to have a reasonable magnitude), and to the disconnect between the model of decision making and evidence from real-world decision making, as Dorman explains in detail in his book.

I’m not claiming that linear dollars-per-life analysis is how people think or how they make decisions; rather, I think it’s a useful normative baseline for resource allocation, which is why we applied it in our radon analysis. The workplace risk scenario is different because people were using empirical data on wages and risk to estimate, or attempting to estimate, or claiming to estimate, the dollar value of risks–and that won’t work because that’s not how people are making their decisions. So it’s complicated. It’s not that cost-benefit analysis is always correct or always incorrect; it’s that it’s a good idea to set up decisions in that way, while recognizing that all the numbers involved are open to question.

The horseshoe rears its ugly head

So, to continue, there’s nothing exactly wrong with the government’s refusal to perform a cost-benefit analysis that puts dollars and lives on a common scale. I think such analyses are useful, but it’s just one possible technique. It’s also legitimate cost-benefit analysis if you estimate the “dollars” ledger and the “lives” ledger separately. As they said, “Not monetizing does not equal not considering or not valuing the human health impact.”

That said, there does seem to be a legitimate concern with the new government policy. It depends how it’s implemented. On one hand, “the E.P.A. would no longer take health effects into account in the cost-benefit analyses necessary for clean-air regulations, according to the documents. Instead, the agency would estimate only the costs to businesses of complying with the rules”; on the other hand, the financial cost-benefit analysis is only part of the decision, so it depends how the health risks are entered into the decision making. One thing I like about formal inclusion of dollars and lives (and qalys) into the decision process is that it requires a paper trail, a set of justifications for the necessary tradeoffs. If they say they’re gonna consider health impacts but they don’t say how, I get concerned.

Anyway, it’s interesting to see the political horseshoe here. On the far left, don’t equate dollars and lives because it’s too capitalist and you can’t put a value on human life. On the far right, don’t equate dollars and lives because then you might have to put a dent in some corporate profits.

I hate that horseshoe shit.

That said, sometimes people label something as a horseshoe and it’s not. And, even here, the right-wing rationale against cost-benefit analysis is nothing like the left-wing rationale. They’re both problematic but for different reasons.

P.S. And this horseshoe is just fine.

“The Great Believers” by Rebecca Makkai

The author Rebecca Makkai has come up a couple times already in this space, first in a quick mention regarding the character names in her excellent recent novel, I Have Some Questions for You, then later in a discussion of the structure of suspense in literature. Also she has a blog that’s included in the Cultural section of our links page.

This all came up because I just finished another Makkai novel, The Great Believers, which I also liked a lot. I’d say I “enjoyed” it–I think that’s an accurate description of a book that I read a few pages every day at bedtime until one day I just sat on the couch and read the last 30 pages–except that the story is sad, so in that sense the reading experience wasn’t quite enjoyable. In any case, I recommend it.

The book did something with time that really worked. Chapters alternated between 1985 and 2015, where you see some of the characters from the earlier time period reappear. This gives some perspective (as logician and sometime Chicagoan Raymond Smullyan memorably said, “To know the past, one must first know the future.”). But it’s not just that. There’s some way in which placing the main action in the 1985, but situating the story in the present time, makes the people in 1985 seem more alive then the would feel in a straight-up historical novel. I’m not quite sure why this would be, and I don’t think the parallel-time-line thing always works–indeed, I’ve read novels that use it and it seems more like a gimmick, underlying the artificiality of the story–but in this case I found it to be very moving.

One more thing. From the author description:

Makkai is on the MFA faculties of the University of Nevada, Reno at Lake Tahoe and Northwestern University, and is the artistic director of StoryStudio Chicago. She lives on the campus of the midwestern boarding school where her husband teaches, and in Vermont.

Which leaves me with some questions:

1. If it’s “the University of Nevada, Reno at Lake Tahoe,” why don’t they just call it “the University of Nevada, Lake Tahoe”?

2. I wonder if she knows the story of the torment executioners at the University of Nevada, Reno? I have a feeling that the characters in The Great Believers would be very amused by the idea of a torment executioner.

3. Makkai has 3 jobs in 2 different states, and then also lives in a third state? How does she do it? I’m reminded of this guy:

Niall Ferguson, MA, D.Phil., is the Laurence A. Tisch Professor of History at Harvard University. He is a resident faculty member of the Minda de Gunzburg Center for European Studies. He is also a Senior Research Fellow of Jesus College, Oxford University, and a Senior Fellow of the Hoover Institution, Stanford University.

I guess some people just have a lot of energy. I’m pretty sure that Ferguson would hate Makkai’s book, though, given that he’s famous for a homophobic slur and The Great Believers is a sympathetic portrayal of gay life.

The stories behind our published research from last year

It’s January so time to look back on what we’ve done in the past year.  I thought this time I’d give a little story of background on each of our published papers.

First, here’s the list of recently published papers:

Also we completed some new work that’s not yet been published:

We have a lot on deck for 2026, including two new books (Bayesian Workflow and the second edition of the edited Handbook of Monte Carlo) and a bunch of research articles on different topics in statistical modeling, causal inference, and social science.

And you can expect another 600 or so blog posts.

The stories behind the papers

It’s hard for me to pick my favorites among all the recently published papers, so let me just say something about each of them, in the same order they were listed above (roughly inverse chronological order of publication):

  • Adaptive sequential Monte Carlo for structured cross validation in Bayesian hierarchical models:  GH took a couple of my classes and had ideas for a couple of papers, including this one.  This is his idea that I just helped on a small amount.
  • Reanalysis of “Competition and innovation: An inverted-U relationship”:  This was originally a blog post.  The editor of the Journal of Robustness Reports asked me to submit it to them.  It took a couple rounds–the reviewers made some good points!–and fun thing about this journal is you can go to the link and see the entire review process.
  • The ladder of abstraction in statistical graphics:  I absolutely love this paper.  It originated in a talk I gave to Ron Yurko’s statistical graphics class at CMU.  I sent it to the journal and they had some good suggestions for improvement that my friend and colleague Kaiser Fung was able to do.
  • Statistical workflow:  As many of youall know, we’ve been writing a book on Bayesian Workflow–it will appear very soon!  I felt that the workflow concept would be useful in non-Bayesian statistics too, so my colleagues and I organized a special issue of a journal, where we solicited a bunch of articles from theoretical and applied researchers, mostly not Bayesian, to get different perspectives on workflow.  The journal issue is looking good–I guess it will be out soon–and we wrote this short article to lead off that issue.  It’s a short paper and I recommend you take a look!
  • Adjusting for underreporting of child protective services involvement in the Future of Families and Child Wellbeing Study and assessing its empirical implications through illustrative analyses of young adult disconnection:  OK, I don’t have much to say about this one.  It’s by my colleagues at the school of social work at Columbia; I was involved in the survey weighting for the study.
  • A multilevel Bayesian approach to climate-fueled migration and conflict:  Hey, I don’t remember much about this at all!  But, yeah, multilevel modeling, I guess I did something useful here!
  • Artificial intelligence and aesthetic judgment:  This one’s mostly by Jessica and Ari, but I made some contributions throughout, which might be recognized from earlier appearances of some of these ideas on the blog.  It’s published in Sankhya because I think they asked me to submit something for a special issue, and we had this cool paper that we couldn’t figure out what to do with.
  • Discussion of “Statistical exploration of the manifold hypothesis”:  This journal sometimes runs papers with discussions (they did a couple of mine in the past decade), and sometimes I contributed something.  Here I saw a good opportunity to remind people of my thoughts on Tibshirani’s “bet on sparsity” principle and where it can go wrong.
  • Meta-analysis with a single study:  What can I say?  This paper has an awesome title.  Erik, Witold, and I have been meeting weekly and will be coming out with more articles soon on science and meta-science.
  • Normative scientific conflict is unavoidable and should be welcomed:  I can’t remember how, but I came across an announcement of a special issue of the journal Theory and Society on the topic of normative scientific conflict.  I had some things to say on the topic, and this seemed like a good outlet.  I like this paper!  You should read it.
  • Russian roulette:  The need for stochastic potential outcomes when utilities depend on counterfactuals:  This paper has a funny story behind it.  I was contacted by economist Amanda Kowalski about a paper she and her colleagues had written about causal inference.  That paper got me thinking about stochastic potential outcomes and asymmetric utility functions, and I had this idea of demonstrating these ideas in a simple example of Russian roulette.  Jonas joined as a collaborator and clarified a bunch of issues that I’d been sloppy with.  We asked Amanda if she wanted to join in, but she was too busy on her own stuff.  Anyway, the final paper is cool–it’s really clean, and it’s timely because lots of people are interested in going beyond the stable unit treatment value assumption.
  • Multilevel regression and poststratification using margins of poststratifiers:  Improving inference for HIV health outcomes during the COVID-19 pandemic:  Qixuan has been taking the lead on a bunch of papers we’ve been doing, generalizing MRP in various ways.  I think we’re gradually moving toward a bright future of generalizing from sample to population.
  • Statistical graphics and comics:  Parallel histories of visual storytelling:  This is an idea that I’ve had for a while.  I mentioned it in class offhandedly one day, and one of the students told me she was interested in the topic too, so we wrote this article.  It was a true collaboration.  It’s kind of a specialized topic, but I think it should have a potentially wide audience, because lots of people love comics and lots of people love statistical graphics.  We focus on the fascinating question of how it is that these two modes of communication have developed only in the past few centuries, even though they could have been invented much earlier.  This is a sister paper to the “ladder of abstraction” paper mentioned above.
  • Letter to the editor:  Long story here.   Back in 2017, a bigshot professor lied about me in a published article in the journal, Perspectives on Psychological Science.  It was the kind of crap article that should never have been accepted, but at the time that journal was run by a corrupt cabal and they were publishing their friends’ articles essentially without peer review.  At the time I complained to the journal but only got rude responses from the cabal.  But things change.  The journal is now run by civilized people and they published my letter.  Better 8 years late than never at all.  And, no, the people who wrote and published the lies never apologized.  Of course not!  Apologies are for losers, not for members of the prestigious National Academy of Sciences.
  • Rethinking approaches to analysis of global randomised controlled trials:  Epidemiologist Jay Brophy wrote this one.  I had some minor contribution, I can’t remember what.
  • Simulation-based calibration checking for Bayesian computation:  The choice of test quantities shapes sensitivity:  This is the latest version of a long series of papers on SBC, starting with Samantha Cook’s Ph.D. thesis, which we turned into a paper that was published twenty years earlier.  I continue to be interested in the idea of accompanying inferences with simulations that check the computations.
  • Visualizing distributions of covariance matrices:  This paper is nearly 20 years old!  At the time we had difficulty getting it published and we moved on to other things.  Then a couple years ago a journal asked me for an article and I sent them this one.  Unfortunately it was a so-called predatory journal, and one of my coauthors didn’t want our article appearing there.  Fair enough!  But then we thought we might as well get it published, so we sent it off.  I like the paper, and I also like that it’s on the relatively understudied topic of visualizing models (as opposed to visualizing data).
  • Interrogating the “cargo cult science” metaphor:  This topic had been bugging me for a while, and Megan and I wrote this paper which got rejected by a couple of places.  Neither of us really knows how to communicate with researchers in the field of science studies, so it was a hard paper to place, even though it makes a clean point.  Then I happened to hear about the journal Theory and Society, which seemed like the perfect place.  I don’t know if anyone read our article, but I’d like to think that, in the future, people will think twice before talking about cargo cult science.
  • A calibrated BISG for inferring race from surname and geolocation:  This is Philip’s project.  I did help out a bit, but I remain frustrated in that we haven’t been able to frame this in a fully Bayesian or generative way.  We’re continuing to work on the problem, and we have a new method, supercaliBISG, which does even better than caliiBISG, which is an improvement on BISG, which itself has the word “improved” in its title (and also calls itself Bayesian, but it’s not fully so).
  • Hierarchical Bayesian models to mitigate systematic disparities in prediction with proxy outcomes:  I can’t remember exactly where his paper came from, but it was somehow associated with some conversations we had with Sharad Goel and others on statistical measures of disparity.  As is often the case, I think much is gained by framing the problem within a generative model.
  • The piranha problem:  Large effects swimming in a small pond:  This one’s important!  The basic idea–there are probabilistic or statistical constraints regarding patterns of dependence in high dimensions, and this has implications for our understanding of patterns in complex structures–was mine, but the coauthors did most of the rest, to collect some relevant mathematical results.  As I like to say, I think there’s more to be said in this area, maybe some connections to random matrix theory.  Also, the paper has an unusual publication story.  What happened was that a student from the statistics club at San Diego State University asked me to do a remote meeting with them.  I did so–it was a fun conversation–and it turned out that their faculty adviser, Richard Levine, was editor of the Notices of the American Mathematical Society, and was looking for general-interest math papers with applied or statistical relevance.  So I sent him the piranha paper.  Articles in this journal have a strict limit of no more than 10 pages and no more than 20 references.  It was hard for me to keep the references under 20 while demonstrating the applied relevance of the topic, so I cheated and wrote a blog post entitled, “Here are just some of the factors that have been published in the social priming and related literatures as having large effects on behavior,” so that just counted as 1 reference in our paper.  Kind of like if the genie gives you 3 wishes and you spend one of them on more wishes.
  • For how many iterations should we run Markov chain Monte Carlo?:  This is an update of my paper with Kenny Shirley for the new edition of the MCMC handbook.  Charles took the lead on this chapter.

I have a horrible feeling sometimes that heavily promoted crap research on space aliens, cold showers, mind-body healing, schoolyard evolutionary psychology, extra-sensory perception, magic golf balls, air rage, himmicanes, subliminal smiley faces, etc etc etc, has softened the ground so that the seeds of more evil trees could then be planted and take root.

Dale Lehman sends an email with subject line “A new low in science”:

I watched part of the painful hearing and here is a story on it.

It is a new low in both statistical studies, policymakers reactions, and public reactions. Of course, the study could be correct, but without any review and without any data, it is simply out of line with many other studies. And, in the hearing the explanations amount to a vast conspiracy where thousands of scientists and clinicians are in a grand scheme (mostly out of fear for their jobs – an irony, given how this administration has used fear about employment as a tool against government employees) to prevent the truth from getting out. The hearing itself was a travesty with virtually none of the subcommittee members present – only Ron Johnson (who outdid himself) and Blumenthal who left (I think out of frustration). I don’t know what bothered me the most – the tone of the witnesses, Johnson’s tirade, or the public applauding the conspiracy statements.

I replied that the bit about “the study could be correct” reminds me of the distinction between evidence and truth which we’ve discussed on the blog.

I’m not sure that this is “a new low in science.” Some other recent lows in science have included members of the elite media promoting ridiculous UFO-as-space-aliens speculation, and celebrity academics here and here promoting junk-science claims of mind-body healing.

The vaccine crap is much worse from a policy perspective—space aliens and mind-body healing are mostly just a waste of time—but, as we’ve discussed, I have a horrible feeling sometimes that heavily promoted crap on space aliens, cold showers, mind-body healing, schoolyard evolutionary psychology, extra-sensory perception, magic golf balls, air rage, himmicanes, subliminal smiley faces, etc etc etc, has softened the ground so that the seeds of more evil trees can now planted and take root.

All that junk science over the past twenty years has been promoted by leading academics. Prominent professors from Harvard, Stanford, Columbia, Chicago, etc. have been promoting magical thinking under the guise of science. Perhaps no surprise that politicians and non-academic hucksters want to get into the game too.

P.S. I asked Lehman whether it was ok for me to quote him, and he said, “Sure. But if it is delayed by 6 months, there will probably be worse examples to come.” I replied that I’ve been doing less blogging lately and the lag is only 4 months now.

P.P.S. Between when I wrote the above post and when it appeared, I posted something else with a similar theme: 25,000 lives saved per ship sunk, $100,000 per citation, a probability of 10^-90 of a decisive vote . . . Is there a through line from B.S. numbers in junk science to B.S. numbers coming from the government?

Part of this may just be me trying to justify my own existence: I write about bad science and I’m concerned about bad policy, so it’s natural for me to see a connection. But I do see something real here. Many of the celebrated leaders of our pop-science establishment–professors with elevated titles at major universities, members of the National Academy of Sciences, PBS and Ted stalwarts, etc.–have at best a tolerance and at worst an active taste for junk science. And many of our political leaders will say the most ridiculous, immediately refutable things. I can’t do much about this, but I can scream. Oh yes, I can do that.

How the covid vaccine almost killed me

So, I was talking on the phone with a friend the other day and she said she just got covid, and I realized that I knew a few other people who’d had covid recently, and this season’s version of the vaccine had come out. I scheduled an appointment at the doctor’s office the next day for covid and flu shots. But when I got there, all they had was the flu shot—the covid shots hadn’t come in yet. The nurse recommended I try doing it through a pharmacy. I kinda forgot about it but then a couple days later I remembered. I went on the CVS website and it was really easy to schedule . . . actually they had an appointment in 20 minutes on West 57 St in midtown. (Amusingly enough, when I typed in my location, it gave the closest locations as some places in New Jersey—I guess they were measuring as-the-crow-flies distance rather than travel time.) 20 minutes doesn’t leave much margin of error so I threw on my shoes, grabbed my bike, zipped over to the subway, went down to 59 St, and biked over to the corner where the CVS was . . . I wasn’t sure which way to go and I couldn’t see any street numbers so I took a guess and turned left, then I saw the street numbers were too low . . . I was in a real hurry now, I didn’t want to get there too late and have them retract my appointment, also I had to return home in about 40 minutes, so I decided to turn around right there in the middle of the block. As I was making that U-turn I slowed down to find a break in the traffic going the other direction and I saw a city bus barreling right at me! Fortunately there was some space in the cars so I could get into the traffic and I didn’t get run over.

Everything else went well. I got the shot and I got home in time for my 4pm meeting. But I almost got run over by a bus (entirely my fault, not the bus driver’s at all). So that’s my story: the vaccine almost killed me.

I’m reminded of the principle that the most dangerous part of a flight is the ride to the airport.

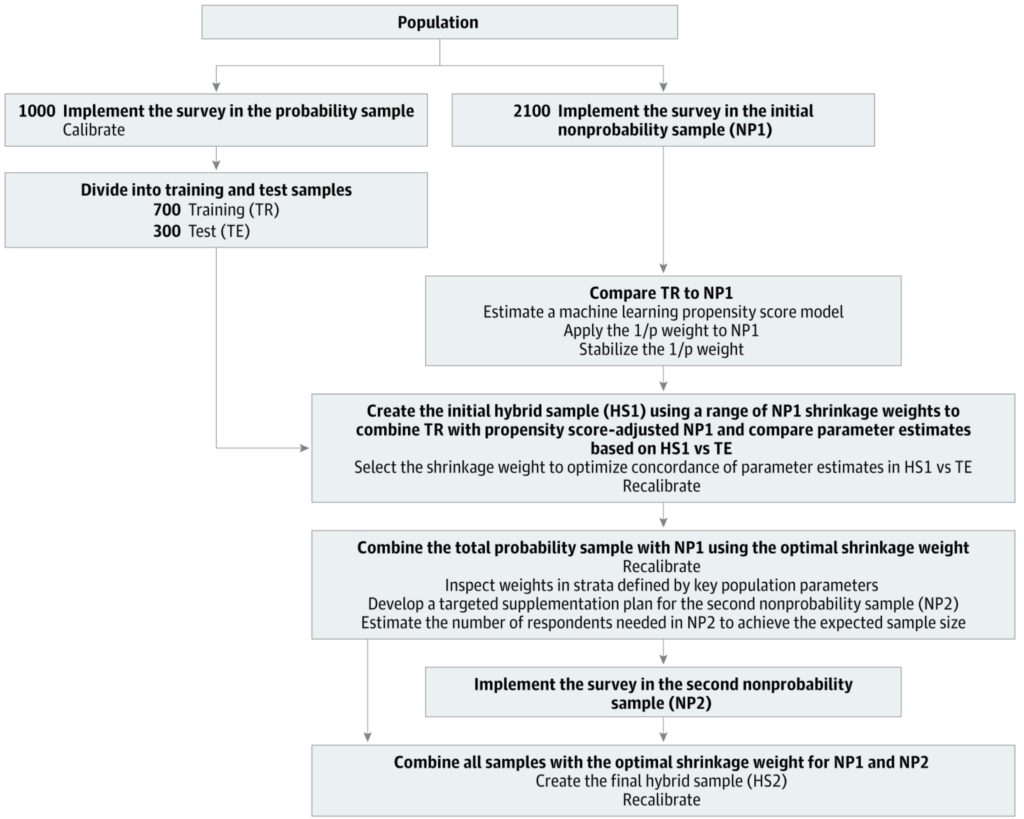
Combining a high-quality probability sample with data from larger online panels

Yajuan Si, James Wagner, and Ron Kessler write:

The traditional use of high-quality probability samples to carry out psychiatric epidemiological surveys of the household population is facing increasing financial and operational challenges. Surveys from nonprobability and probability-based online panels have emerged as cost-effective alternatives with the additional advantage of rapid turnaround time, albeit with biases that can in some cases be substantial.

We recommend a middle ground of integrating surveys from online panels with small parallel high-quality probability samples . . . The key features of such “hybrid designs” are as follows: use of a high-quality probability sample as a population surrogate to provide information about the distributions of otherwise unavailable variables that differentiate participants in online panels from the larger household population, inclusion in both surveys of measures that are both strongly associated with the outcomes of interest and strongly predictive of membership in the online panel, and use of best-practice statistical methods that blend results across the 2 samples.

Such a hybrid design should be the minimally acceptable design for psychiatric epidemiological surveys of the household population given the biases known to exist in online panels. However, we also comment on several other designs that might be used for more rapid and less expensive exploratory analyses.

This is interesting, to think of multi-frame, multi-mode sampling as best practice in itself rather than as an awkward problem to be dealt with only if absolutely necessary.

Yajuan offers some background on the project:

This is my first time writing a paper without any equations or data modeling but having to rely on solid statistical knowledge, understanding the extensive literature, and gathering lots of data. And Ron Kesser is a phenomenal collaborator. I learned a lot from working with him.

Anyway, here is the idea of the paper: We propose a hybrid data collection of large-scale nonprobability samples and small parallel high-quality probability samples as common practice for population-based research. For MRP applications, we often struggle with the availability of population information of X. We propose to estimate the population distribution of X in a small probability sample, after we identify the list of highly predictive covariates X for the outcome Y. We can also collect Y in the probability sample. We propose the sequential weighting adjustment by first weighting the probability sample to the census data (this should be based a small list of adjustment factors, say only demographics, assuming the probability sample design is well controlled and nonresponse bias is small) and then weighting the nonprobability sample to the initially weighted probability sample (the list of adjustment factors could be large, even including the outcome). After the sequential weighting, the combined samples can give us enough power for small area estimates. I use weighting adjustment here for simplicity, but we can also use MRP for the adjustment if we have an outcome of interest.

Basically, I’m trying to push the MRP adjustment from post-collection inference to inform study design and modify data collection adaptively, releasing the burden or strong assumptions on analysis by improving the study design from the starting point.

This is interesting and potentially important for several reasons:

1. Data quality of survey responses is becoming more and more of an issue, and it makes sense to try to reach potential respondents in more comfortable places than the traditional survey interview.

2. We should be thinking more systematically about how to integrate data from multiple sources.

3. MRP can be adapted to more general data structures.

4. As Yajuan says, we should be aware of all these data collection and analysis issues in the design stage.

The three funniest items on the Kroger recall list

Palko points us to this news item, “Kroger Recall Update: Full List of Product Warnings Across 18 States.” My favorite:

Yummi Sushi, recalled October 28, 2025: Nashville, Knoxville, Georgia, and South Carolina stores. Possible contamination with metal fragments.

If you’d asked me why they were recalling sushi, “contamination with metal fragments” would not have been in my first hundred guesses. I guess the metal makes it yummier.

And my second favorite:

Face Rock Curds Vampire Slayer Garlic, recalled June 25, 2025: Affects Fred Meyer and QFC stores. Potential Listeria contamination.

I don’t see the problem. Listeria would slay a vampire too, no?

And this:

High Noon vodka Beach Variety, recalled July 28, 2025: Affects Kroger-owned stores located in Wisconsin, South Carolina and Virginia. Kroger says: “Specific lot codes of the product are being recalled due to variety packs may have cans labeled Celsius Energy Drink filled with seltzer alcohol.”

High noon, indeed.

Who wants no kid vax law?

Palko points to this link to a recent Pew Research Report which states, “Nearly two-thirds have high confidence in vaccine effectiveness, and about half trust their safety testing and schedule; Republican support for school vaccine requirements continues to slide,” and includes the above graph.

The focus of the online discussion was that Democrats’ views have remained stable while Republicans have shifted a lot, in a disturbing direction. From a political science perspective, this is an interesting example of partisan polarization of an issue attitude happening in real time.

But I was struck by something else: Even back in the pre-covid era, before vaccination became politically polarized, a sixth of Americans opposed vaccine mandates. Some of this must be from the question wording (“Parents should be able to decide not to vaccinate their children, even if that may create health risks for others,” rather than, say, “Schools should be able to require that children be vaccinated”), but I wonder if some of this is a sort of costless opposition. It’s possible to oppose a policy in principle, without any expectation that it will be repealed.

P.S. This post’s title harks back to the John Lennon classic, What joker put seven dog lice in my Iraqi fez box?

Under what sort of systematic reporting errors will science be self-correcting, or not? And do gardening programs reduce obesity?

This paper by Jon Agley, Sarah Deemer, and David Allison begins:

Science is often said to be self-correcting . . . However, self-correction does not always happen to scientific evidence by default; it requires human agency. Further, even when scientists actively pursue corrections, it can take such a long time to achieve them that additional work may be done, or policy enacted, in the interim based on unjustified premises.

And here’s their point:

The standard dialogue seems to be that errors occur randomly, and that larger and better studies will eventually wash them out. We argue that this is not true for all types of errors. Specifically, we present a taxonomy of three types of errors: basic, non-Markovian, and biased Markovian.

• Basic errors are both (a) Markovian, meaning that whether the error occurs does not depend on any factors before the study at hand (e.g., honest coding errors), and (b) uninfluenced by common biasing factors outside the study that may exert influence in the same direction and away from the truth (e.g., a cultural norm or expectation).

• Non-Markovian errors are those for which the likelihood or nature of the error depends on prior errors within other studies, such as a junior researcher replicating an incorrect methodology used regularly by a more senior scientist in the field. We sometimes also refer to such errors as being “correlated,” by which we mean a dependency of this type, not a statistical correlation.

• Biased Markovian errors are those for which a common force leads to consistent bias in the same direction across many studies, but the errors remain Markovian because they do not depend on prior errors in a sequence of studies.

We argue that basic scientific errors may resist correction, but in principle can be mitigated by the general scientific progress within a field. In contrast, biased Markovian and non-Markovian errors may be more likely to lead an entire domain of study astray because they produce sequences of studies that are probabilistically linked, either directly or indirectly, through erroneous constructs. In other words, these errors are more likely to propagate errors.

We illustrate our hypothesis using the popular idea that gardening programs can reduce obesity, and we propose several directions for pursuing solutions.

Gardening programs can reduce obesity? I had no idea!

Seriously, though, I like the ideas in this paper, even though I’m not thrilled with the terms “Markovian” and “bias,” as these have existing technical meanings that don’t quite line up with how they’re being used in this paper.

I also see connections to the classic paper by Paul Smaldino and Richard McElreath, The Natural Selection of Bad Science

The density of fraud

Last year we discussed the story of a doctor at Columbia University who was involved in multiple cases of research fraud lasting over a decade—and is still being promoted by the university, years after this fraud came out. In a comment, Sholto David informs us that Columbia is investigating the case, so maybe by the time this post appears, Columbia will have fired the offending researcher.

Following the link at Sholto David’s comment let me to a website called For Better Science, and . . . wow. There’s a lot of corruption out there by medical researchers at top universities. Columbia included, and not just Dr. Oz and not just the doctor mentioned above. Here’s another example, which I only happened to notice because the relevant post is near the top of the webpage right now. For Better Science is run by Leonid Schneider, with whom we corresponded a few years ago regarding the replication crisis.

I read Retraction Watch and I know about fraud—but just the level of this, it’s stunning. I guess my problem is that I haven’t been thinking about the problem statistically. It says here that Columbia’s College of Physicians and Surgeons—I guess that’s what we’d call “the medical school”—has 2600 faculty. If, say, 10% of them are cheaters, then that would be 260 of those people rattling around in the institution. Not all these people will be cheating on research: some of them are cheating on their taxes, others are double-billing patients or fiddling with their expense accounts or selling drugs on the side, or . . . all sorts of things, I suppose!

The point is that I shouldn’t be so shocked to hear that Columbia medical school has prominent faculty who’ve been involved in research fraud. If you’re a medical researcher and a cheater, then research fraud is a natural step. Just as if you’re a storekeeper and a cheater, then ripping off your customers and employees is a natural step; or if you’re a statistician and a cheater, then it makes sense to hire yourself out as a data manipulator; or if you’re a CEO and a cheater, then it makes sense to fake your corporate reports; or if you sell used cars and you’re a cheater, then you’ll hide the flaws in your cars; or if you’re a university administrator and a cheater, then it makes sense to fake your U.S. News statistics . . . ulp! In all these examples, there’s a clear incentive to cheat: if you play honest, it’s easy to fall behind your competitors who could be cheating too. Indeed, you could argue that, if you play by the rules, you’d be letting the side down . . . it’s arguably unethical not to cheat. You’re developing treatments what will save lives, after all!

OK, I don’t buy that last bit. Lots of good research is done without cheating. I strongly disagree with the statement that research fraud serves a greater good, and in any case no one would make such a claim in public even if they might think so privately.

But what I’m hung up on here is the idea that there are so many cases of fraud out there. The error that we make at Columbia and other institutions is the implicit assumption that fraud will almost never happen, so that every newly-discovered instance is treated as a completely new and surprising event.

What should be done about this, I’m not sure. Until looking at that For Better Science, I just hadn’t thought hard about the sheer prevalence of scientific fraud at major university medical centers. It’s just part of the culture, in the same way that shortchanging the rubes is part of carny culture. Seeing the occasional story in Retraction Watch hadn’t given me the sense of the sheer density of fraud in the system.

Maybe Dan Davies, as an author of a thoughtful book on financial fraud, would have some thoughts on this one.

The acupuncture paradox and its resolution

This one’s important.

The other day we had a post on when it’s ok to judge people by their worst.

Dmitri wrote in:

You know who I judge by their worst belief? Healers: doctors and such. If a doctor has one crazy health belief, I am out of there.

My mother-in-law has an acupuncturist who is into all sorts of weird Chinese traditional medicine. I could use an acupuncturist for some tendinitis but I have ruled her out because I know that some of her beliefs are totally nuts. Maybe she knows where to stick for the tendinitis but I am not taking any chances.

I told him I disagreed regarding the nutty acupuncture beliefs (more on this below), and Dmitri elaborated on his reasoning:

When I choose a health-care practitioner I am choosing on the basis of the quality of their health-care reasoning. I want them to figure out what’s wrong with me and find a way to fix it. If I have any evidence that their health-care reasoning is faulty, I want to stay away.

My comment about acupuncture was written from the standpoint of the belief that acupuncture might really work for certain kinds of ailments. I had a friend who got good results with tendinitis. But even if it’s all placebo I suspect I’ll get the best placebo effect if I have faith in the person administering the treatment.

This all makes sense, also it pleases my sense of nostalgia to see a mother-in-law joke. OK, it wasn’t really a joke on Dmitri’s part; still, it brought back memories of wacky mothers-in-law in old sitcoms.

The acupuncture paradox

But back to the acupuncture. I’ve been thinking about this for a long time. Here’s a post from 2011:

The scientific consensus appears to be that, to the extent that acupuncture makes people feel better, it is through relaxing the patient, also the acupuncturist might help in other ways, encouraging the patient to focus on his or her lifestyle.

A friend recommended an acupuncturist to me awhile ago and I told her the above line, to which she replied: No, I don’t feel at all relaxed when I go to the acupuncturist. Those needles really hurt!

I don’t know anything about this, but one thing I do know is that when I discuss the topic with any of my Chinese friends, they assure me that acupuncture is real. Real real. Not “yeah, it works by calming people” real or “patients respond to a doctor who actually cares about them” real. Real real. The needles, the special places to put the needles, the whole thing. I haven’t had a long discussion on this, but my impression is that Chinese people think of acupuncture as working in the same way that we think of TV’s or cars or refrigerators: even if we don’t know the details, we trust the basic idea.

Anyway, I don’t know what to make of this. The scientific studies finding no effect of acupuncture needles are plausible to me—but if they’re so plausible, how come none of my Chinese friends seem to be convinced?

My question here is not whether acupuncture could work (possibly through some backdoor mechanism like the needles stimulating your body in some useful way, or whatever) but on the evidence of how much it does work. As noted, I think the overwhelming impression among my Chinese friends–statisticians included–is that it does work, and not merely through some vague calming effect. But this would seem to contradict the research, so I don’t know what to think.

This does seem to be a paradox, as evidenced by some of the discussion in the 56 comments on the above-linked post.

We had another good comment thread when I brought up the topic again in 2016.

What are acupuncturists doing?

So, yeah, this paradox was bugging me for years, and then at some point I came up with a satisfying resolution.

My resolution of the acupuncture paradox might not be scientifically correct–indeed, it would be wonderful to design some experiments to study the topic and see what, if any, of my ideas in this domain hold up–but it has the virtue of being a possible solution to the problem. Which is more than I had before.

I’ve talked with a bunch of people about this idea, and I’ve mentioned it in some public lectures, but this might be the first time I’ve written it up.

My resolution of the paradox starts with the idea that the success of acupuncture, as with physical therapy, coaching, teaching, and many other things, comes from a fruitful interaction between the patient and the therapist. Good acupuncturists, like good physical therapists, coaches, and teaching do not just push buttons and follow a template; they work closely with each patient and figure out what is needed. In addition, I assume that acupuncture is like these other endeavors in that an key function of the therapist is to motivate patients to keep up with the work.

Thinking of a treatment effect as a vector with direction and magnitude

I’ve written that you can conceptualize an education intervention as a vector, where the direction of the vector is the material being learned and the length of the vector is the amount that students are motivated to work. You want the material learned to be useful–you’d like the vector to have a positive “dot product” with the vector of skills, knowledge, and understanding that will be useful going forward–but, conditional on those two vectors being roughly aligned, the real gain is in the magnitude. And this magnitude will be an interaction between the teacher and student: there’s no button to push to create motivation, and if there were a button it would already have been pushed.

What I’m saying is that, when thinking about acupuncture, or physical therapy, or coaching, or teaching, we have to go beyond what I’ve called the penicillin model of science, the idea that innovations come from nowhere and that the job of statistics is to design and analyze experiments to reject the null hypothesis of no effect, and in which the treatment in such experiments is considered as a black box, with the goal being to estimate an average treatment effect.

I don’t think the penicillin model usually applies. Most of the time in health, education, and just about any field, improvements are incremental, and the goal is to improve the process while gaining understanding. Clinical trials and offline experiment both play a role, and you’re not going to learn much by studying a treatment as if it’s a black box.

This is not to say that there cannot be new developments in any of these fields, nor is it to deny that such developments can sometimes arise serendipitously. I just think that, in any case, you have to go beyond the average treatment effect and think about the mechanism of action.

Resolution of the acupuncture paradox

OK, now on to my answer.

Let’s suppose that acupuncture really works, not just as a placebo or as relaxation or whatever, but as a set of physical manipulations that help you heal better. Let’s also suppose that the mechanism of acupuncture is not the position of the needles or qi or whatever, but the result of the acupuncturist observing you, listening to you, watching and feeling you as you move, then getting a sense of where your problems are and doing movements and giving you advice that will improve your healing. There’s no need for either or both of these statements to be true, but they could be, and suppose they are.

In that case, we should see two things:

1. The usual controlled studies of acupuncture should show no effect. If you do an experiment where the treatment group gets acupuncture with the needles in the “correct” places and the control group gets acupuncture with needles in the “wrong” places, there will be no difference. If useful acupuncture is being done, with good interaction between the therapist and patient and the therapist giving informed, patient-specific therapy, then it will work in both treatment and control groups. If push-button acupuncture is being done, without that focus on the patient, it won’t work in either group. In either of these scenarios, the treatment effect in the experiment will be zero, or nearly zo.

2. Real-world acupuncture would work, and not just because of relaxation/placebo/etc.

In this setting, the usual experimental research method won’t work, because the experiment with the random needle placements is removing the very mechanism by which acupuncture works (or is assumed to work, in my scenario).

That’s a paradox for you: We can have an effect that is real but which will not show up under the usual controlled-trial design.

This is not to say that the effect could not be detected. You’d just need a different design, for example acupuncture (done however the therapist wants to do it) versus nothing, or versus some default therapy. In such a setting you’d want to gather lots of intermediate data to find out what the acupuncturists (and also the control-group therapists) and the patients are actually doing, how their bodies are moving as the weeks go on. Get rich data, thick description that can then be analyzed using multilevel models as necessary.

What about the theory?

To return to Dmitri’s original statement: What about the theory of acupuncture, the placement of the needles, the lines on the body, the qi, etc.? I don’t know. I admit I’m skeptical, and I think that acupuncture could work (and not just as relaxation etc.) even with all these theories being bogus. I’d think of the theories as a sort of checklist, a framework that gives acupuncturists some focus and gives them the space to observe the patient and figure out what to do and what to recommend.

Just as in chess it is said that planning is important, even your plan does not work out, it could also be true in acupuncture (and also in physical therapy, coaching, teaching, etc.) that even a misguided or empty theory can provide useful structure.

But we don’t always have a good language for talking about this when we talk about science. We can talk about specific mechanisms (this gene codes for this protein which unlocks this other protein which catalyzes that reaction, or whatever) or we can talk completely abstractly (this treatment works, as has been demonstrated in a bulletproof clinical trial), but we’re not so good about the steps of trying to work through a mechanism by gathering intermediate measurements and modeling them.

So, give your mother-in-law’s acupuncturist a break. Her beliefs and medical theories may be “totally nuts,” but they may be no more than a framework that she can use to do the useful things that she does.

P.S. Andrew Vickers points in comments to a meta-analysis from 2018 finding positive effects of acupuncture, beyond any placebo effect, in clinical trials.

The Office of Risk Assessment at the Netherlands Food and Consumer Product Authority is looking for an applied statistician with expertise in Bayesian statistics or causal inference

Joost Meekes writes:

At the Netherlands Food and Consumer Product Authority (NVWA), Office of Risk Assessment, we have a vacancy for an applied statistician (or a data scientist with expertise in statistics). We are particularly interested in candidates with knowledge of and experience with Bayesian statistics or causal inference. If you know anyone who might be interested in this position, or if you would publish the vacancy on your blog, we would be most grateful.

The position requires proficiency in Dutch.

The Netherlands Food and Consumer Product Authority is a government agency which oversees a wide variety of domains, working to guarantee public interests including food and product safety, plant health, and animal health and welfare. The position offers the opportunity to work on a wide variety of applied statistical and machine learning problems with societal impact and comes with excellent benefits.

This sounds really cool, also a great opportunity to improve jouw nederlands.

An economist reports that the cost data from Medicare are “completely irrelevant. It is clearly measures of net costs that matter, but only gross costs (analogous to sticker prices) are provided. Similar issues arise with recent requirements for hospital price transparency.”

Dale Lehman writes:

I’ve been trying to understand the large changes being made to Medicare Part D drug plan coverage and prices. Due to recent changes, Part D actually looks more like an insurance plan than it used to – there is a $2000 cap on out-of-pocket spending for all Part D plans (there used to be no limit) and a fairly high deductible, so it is sort of a catastrophic coverage plan. I can now get a plan with $0 monthly premiums, but due to my income I pay around $700/year to subsidize poorer participants. I was trying to find data to see whether this makes financial sense for myself – how common are drugs that cost more than $2000 per year? So, I investigated what data is available. CMS provides data (sample dataset attached) for each drug: https://data.cms.gov/summary-statistics-on-use-and-payments/medicare-medicaid-spending-by-drug/medicare-part-d-spending-by-drug. However, the drug cost data is gross drug costs:

Drug spending metrics for Part D drugs are based on the gross drug cost, which represents total spending for the prescription claim, including Medicare, plan, and beneficiary payments. The Part D spending metrics do not reflect any manufacturers’ rebates or other price concessions as CMS is prohibited from publicly disclosing such information.

This makes the data completely irrelevant! It is clearly measures of net costs that matter, but only gross costs (analogous to sticker prices) are provided. Similar issues arise with recent requirements for hospital price transparency. The data required for intelligent consumer decisions – or meaningful analysis of health policies is simply not available. Mass amounts of data are provided, but much of it is simply meaningless. I’m sure some researchers get access to relevant data, either through their connections or buy purchasing private data. But (too) much government data is not available in any form that permits independent analysis. This permits regulation and legislation to proceed under heavy influence from special interests, along with publication records for the limited few with privileged access. We (I) bemoan researchers not releasing their data – here we have cases where the raw government data that matters is “prohibited from publicly disclosing such information.”

He supplies this example:

The generic drug Tamsulosin, a favorite of mine (and many older men), shows almost 477,000 beneficiaries in 2022 (I said it is a favorite). Average spending per beneficiary is $75/year. When I fill my prescriptions, the price is $0. The brand name version (Flomax) still shows 990 beneficiaries, with an average spending of $1996/year. That drug manufacturer (Sanofi-Aventis) must be making a fortune – or discounting the drug greatly. Or are the small number of prescribers using the brand name drug getting huge kickbacks, financed by Medicare? Or did the insurer strike deals with the other 15 manufacturers of the drug, and what type of deals did they strike? Anybody trying to make sense out of how the actual part D drug plans work is left without any useful data. None of these numbers are meaningful, other than the total number of people on these drugs.

Generalizing Treatment Effects from Trials to EHR Populations (Qixuan Chen’s talk this Tues morning)

My biostatistics collaborator is speaking this Tues 21 Oct, 11am at the NYU Department of Population Health, room CR 314 and on zoom:

Generalizing Treatment Effects from Trials to EHR Populations using Propensity Score Predictive Inference

Although randomized controlled trials provide strong internal validity, they often lack external validity when generalized to populations. This limitation, known as generalizability, arises when trial participants are not representative of the target population. To address this, we develop an interaction-based Propensity Score Predictive Inference (PSPI) method that leverages propensity scores for trial participation combined with flexible outcome models. We introduce two robust PSPI variants that estimate potential outcomes across treatment groups by incorporating natural cubic splines of the propensity score and modeling high-dimensional covariates with Bayesian Additive Regression Trees.

Generalization is important!

It’s JAMA time, baby! Junk science presented as public health research

7% of adults have been present at the scene of a mass shooting? Believe it or not, there’s a lesson in probability theory here.

Matt Lerner points with skepticism to this new paper from JAMA, which reports:

In a survey study of 10 000 US adults, 7% reported having been present on the scene where 4 or more people were shot, which was more common among younger generations, males, and Black respondents. Two percent reported having been injured in a mass shooting–by being shot, trampled, or experiencing related injuries–which was more common among younger generations and males.

These findings underscore the extensive and often overlooked regular exposure to mass shootings in US society, which calls for targeted interventions designed to reduce violence.

Lerner writes:

I can’t see anything seriously wrong with the methodology on a quick skim (they used YouGov to generate…. some kind of sample) but obviously I just don’t believe it. A little BOTEC- there were 500 mass shootings in the US last year. If that’s been going on for fifty years and there’s 100 (mutually exclusive) people at each shooting, that’s 2.5m people, so still under 1% of adults. 7% ????

Agreed. The published paper is terrible, the kind of junk science that gets published because it enhances a political agenda.

From a statistical perspective the problem is obvious. What the survey tells us is not the percentage of respondents who had “ever been physically present on the scene of a mass shooting” or “were physically injured in the incident.” What it tells us is the percentage of respondents who say they had “ever been physically present on the scene of a mass shooting” or “were physically injured in the incident.”

That’s not the same thing! It’s well known that people overstate the frequencies of rare events. Whether this is misremembering, misclassification, or something else, I don’t know–but even a very small false-positive rate will destroy your estimate, if the true underlying frequency is low.

In a classic article in Chance magazine from 1997, “The myth of millions of annual self-defense gun uses: a case study of survey overestimates of rare events,” David Hemenway uses statistical reasoning to explain this bias in terms of probability theory. Misclassifications that induce seemingly minor biases in estimates of certain small probabilities can lead to large errors in estimated frequencies. Hemenway discusses this effect in the context of traditional medical risk problems and then argues that this bias has caused researchers to drastically overestimate the number of times that guns have been used for self defense. Direct extrapolations from surveys suggest 2.5 million self-defense gun uses per year in the United States, but Hemenway shows how response errors could be causing this estimate to be too high by a factor of 10.

Here are a couple more examples from Hemenway’s 1997 article:

The National Rifle Association reports 3 million dues-paying members, or about 1.5% of American adults. In national random telephone surveys, however, 4-10% of respondents claim that they are dues-paying NRA members. Similarly, although Sports Illustrated reports that fewer than 3% of American households purchase the magazine, in national surveys 15% of respondents claim that they are current subscribers.

Back to the published paper

The problem with the paper is not so much that it reports this survey result. It’s data! The problem is that they report it as if it’s telling us something useful about the number of people who have been present at, or injured in, a mass-shooting event.

Look again at their summary, which is written as if they have access to direct measurements:

These findings underscore the extensive and often overlooked regular exposure to mass shootings in US society.

The paper does have a Limitations section. Here it is, in its entirety:

Findings on the prevalence of direct exposure and associated correlates are subject to well-known limitations of survey research. Although survey prompts defined mass shootings and direct exposure, recall bias and cohort-specific experiences related to growing up in an era characterized by heightened awareness of gun violence could contribute to the generational gradient observed. Invariance in injury may mask differential forms of exposure by location and type of mass shooting, as well as the circumstances under which these incidents occur, including measurement of lifetime exposure (eg, shorter vs longer recall periods) and types of physical injuries (eg, shot vs trampled).

What a steaming pile of crap. Nowhere do they even consider that their estimate could be contaminated by false positives. They talk about “the generational gradient,” “differential forms of exposure,” and “types of physical injuries,” but never about their implausible and unsupported 7% and 2% claims.

Junk science presented as public health research

So, this is a bad paper. Bad papers happen. It could’ve been an ok paper, if they’d (a) reported their results as is without claiming to have learned about actual mass-shooting events, (b) addressed the problem of false positives, as discussed by Hemenway (1997), and (c) considered other data on the topic. On the other hand, without making those big, unsupported claims, they couldn’t have published it in a high-profile journal.

On the plus side, NPR doesn’t seem to have fallen for this one. The best media exposure this study has received seems to have been Axios, which I guess was taking a break from whatever the heck it is that they usually do at Axios.

The other thing that the paper has going for it–and I guess what got it published in JAMA–is that they’re framing a social problem as a public health problem:

This survey study offers evidence of wide-reaching direct exposure and experience with mass shootings in the US. Ongoing research and data collection are essential to understanding the full scope of mass shootings and their impact on US society. Future research should further investigate how direct exposure to these incidents shapes individuals’ health and well-being, with particular attention to the broader community and the potential for systemic interventions that promote safety and resilience.

Even setting aside the unaddressed data problems which make the paper entirely useless, this study was published by the Journal of the American Medical Association–and it has nothing to do with medicine. It pushes a particular political agenda in which social problems are framed as public health problems.

Yeah, JAMA gets the blame

Oh, you might say, the paper’s not really published in JAMA–it’s published in JAMA Network Open, a pay-to-play journal under the JAMA umbrella. To which I reply: No, if it’s got the JAMA brand, then JAMA has to take the responsibility for it. Reputation is a two-way street.

If JAMA keeps this up, they’re gonna get the reputation of Lancet as being willing to publish just about anything that fits their political agenda.

P.S. After writing the above I came across this post by Danielle Navarro regarding another example of unbelievable survey responses, and we also had this discussion a few years ago. All of these are respectable survey responses and it’s good to understand how people can get these wrong. The problem with the above-discussed JAMA paper is that it’s taking those numbers as representing external reality.