A suggestion on how to improve the broader impacts statement requirement for AI/ML papers

This is Jessica. Recall that in 2020, NeurIPS added a requirement that authors include a statement of ethical aspects and future societal consequences extending to both positive and negative outcomes. Since then, requiring broader impact statements in machine learning papers has become a thing.

The 2024 NeurIPS call has not yet been released, but in 2023 authors were required to complete a checklist where they had to respond to the following: “If appropriate for the scope and focus of your paper, did you discuss potential negative societal impacts of your work?”, with either Y, N, or N/A with explanation as appropriate. More recently, ICML introduced a requirement that authors include impact statements in submitted papers: “a statement of the potential broader impact of their work, including its ethical aspects and future societal consequences. This statement should be in a separate section at the end of the paper (co-located with Acknowledgements, before References), and does not count toward the paper page limit.”

ICML provided authors who didn’t feel they had much to say the following boiler-plate text:

“This paper presents work whose goal is to advance the field of Machine Learning. There are many potential societal consequences of our work, none which we feel must be specifically highlighted here.”  

but warned authors to “to think about whether there is content which does warrant further discussion, as this statement will be apparent if the paper is later flagged for ethics review.”

I find this slightly amusing in that it sounds like what I would expect authors to be thinking even without an impact statement: This work is like, so impactful, for society at large. It’s just like, really important, on so many levels. We’re out of space unfortunately, so we’ll have to leave it at that.\newline\newline\newline\newline Love, \newline\newline\newline\newline the authors \newline\newline\newline\newline

I have an idea that might increase the value of the exercises, both for authors and those advocating for the requirements: Have authors address potential impacts in the context of their discussion of related work *with references to relevant critical work*, rather than expecting them to write something based on their own knowledge and impressions (which is likely to be hard for many authors for reasons I discuss below).  In other words, treat the impact statement as another dimension of contextualizing one’s work against existing scholarship, rather than a free-form brainstorm.

Why do I think this could be an improvement?  Here’s what I see as the main challenges these measures run into (both my own thoughts and those discussed by others):  

  1. Lack of incentives for researchers to be forthright about possible negative implications of their work, and consequently a lack of depth in the statements they write. Having them instead find and cite existing critical work on ethical or societal impacts doesn’t completely reconcile this, but presumably the critical papers aren’t facing quite the same incentives to say only the minimum amount. I expect it is easier for the authors to refer to the kind of critiques that ethics experts think are helpful than it is for them to write such critical reflections themselves.
  2. Lack of transparency around how impacts statements factor into reviews of papers. Authors perceive reviewing around impacts statements as a black box, and have responded negatively to the idea that their paper could potentially get rejected for not sufficiently addressing broader impacts. But authors have existing expectations about the consequences for not citing some relevant piece of prior work.
  3. Doubts about whether AI/ML researchers are qualified to be reflecting on the broader impacts of their work. Relative to say, the humanities, or even areas of computer science that are closer to social science, like HCI, it seems pretty reasonable to assume that researchers submitting machine learning papers are less likely to gravitate to and be skilled at thinking about social and ethical problems, but skilled at thinking about technical problems. Social impacts of technology require different sensibilities and training to make progress on (though I think there are also technical components to these problems as well, which is why both sides are needed). Why not acknowledge this by encouraging the authors to first consult what has been said by experts in these areas, and add their two cents only if there are aspects of the possible impacts or steps to be taken to address them (e.g., algorithmic solutions) that they perceive to be unaddressed by existing scholarship? This would better acknowledge that just any old attempt to address ethics is not enough (consider, e.g., Gemini’s attempt not to stereotype, which was not an appropriate way to integrate ethical concerns into the tech). It would also potentially encourage more exchange between what currently can appear to be two very divided camps of researchers.
  4. Lack of established processes for reflecting on ethical implications in time to do something about them (e.g., choose a different research direction) in tech research. Related work is often one of the first sections to be written in my experience, so at least those authors who start working on their paper in advance of the deadline might have a better chance of acknowledging potential problems and adjusting their work in response. I’m less convinced that this will make much of a difference in many cases, but thinking about ethical implications early is part of the end goal of requiring broader impacts statements as far as I can tell, and my proposal seems more likely to help than hurt for that goal.

The above challenges are not purely coming from my imagination. I was involved in a couple survey papers led by Priyanka Nanayakkara on what authors said in NeurIPS broader impacts statements, and many contained fairly vacuous statements that might call out buzzwords like privacy or fairness but didn’t really engage with existing research. If we think it’s important to properly understand and address potential negative societal impacts of technology, which is the premise of requiring impacts statements to begin with, why expect a few sentences that authors may well be adding at the last minute to do this justice? (For further evidence that that is what’s happening in some cases, see e.g., this paper reporting on the experiences of authors writing statements). Presumably the target audience of the impact statements would benefit from actual scholarship on the societal implications over rushed and unsourced throwing around of ethical-sounding terms. And the authors would benefit from having to consult what those who are investing the time to think through potential negative consequences carefully have to say.

Some other positive byproducts of this might be that the published record does a better job of pointing awareness to where critical scholarship needs to be further developed (again, leading to more of a dialogue between the authors and the critics). This seems critical, as some of the societal implications of new ML contributions will require both ethicists and technologists to address. And those investing the time to think carefully about potential implications should see more engagement with their work among those building the tools.

I described this to Priyanka, who also read a draft of this post, and she pointed out that an implicit premise of the broader impact requirements is that the authors are uniquely positioned to comment on the potential harms of their work pre-deployment. I don’t think this is totally off base (since obviously the authors understand the work at a more detailed level than most critics), but to me it misses a big part of the problem: that of misaligned incentives and training (#1, #3 above). It seems contradictory to imply that these potential consequences are not obvious and require careful reflection AND that people who have not considered them before will be capable of doing a good job at articulating them.

At the end of the day, the above proposal is an attempt to turn an activity that I suspect currently feels “religious” for many authors into something they can apply their existing “secular” skills to. 
When Steve Bannon meets the Center for Open Science: Bad science and bad reporting combine to yield another ovulation/voting disaster

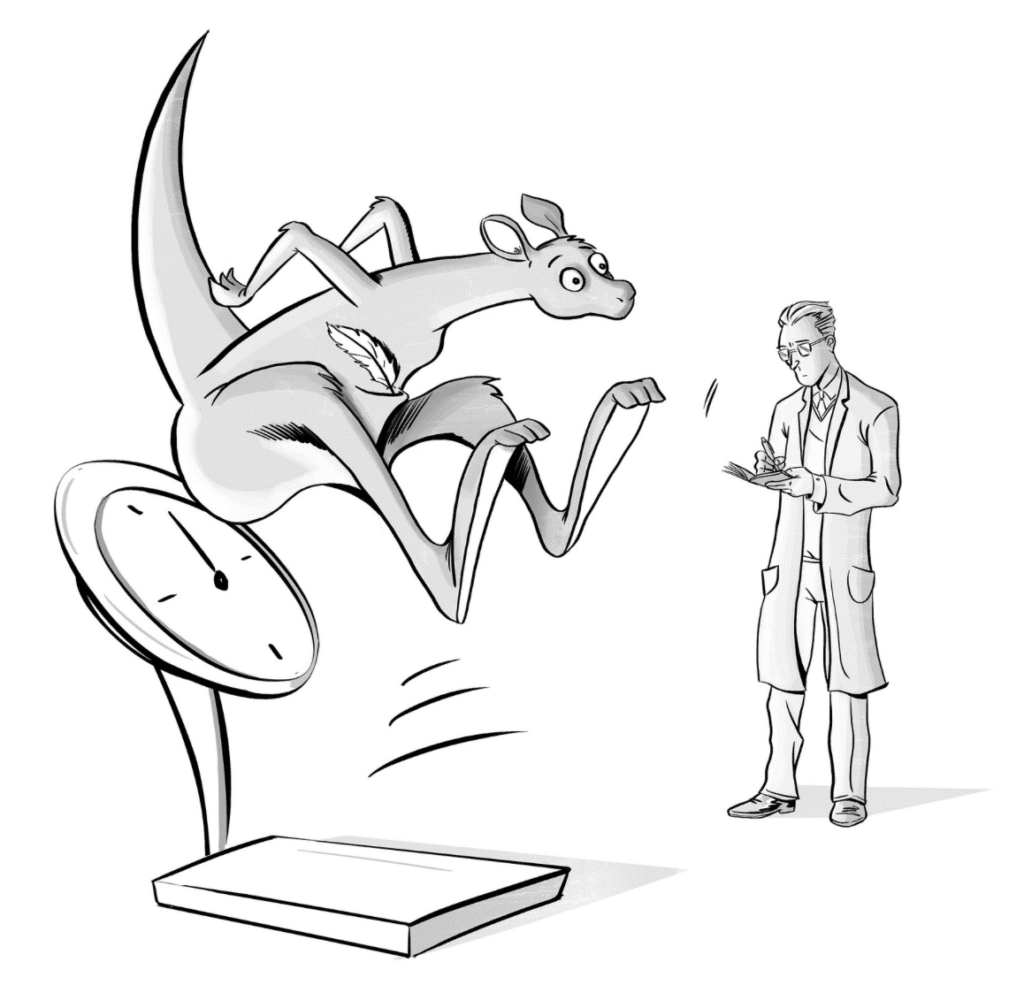
The Kangaroo with a feather effect

A couple of faithful correspondents pointed me to this recent article, “Fertility Fails to Predict Voter Preference for the 2020 Election: A Pre-Registered Replication of Navarrete et al. (2010).”

It’s similar to other studies of ovulation and voting that we’ve criticized in the past (see for example pages 638-640 of this paper.

A few years ago I ran across the following recommendation for replication:

One way to put a stop to all this uncertainty: preregistration of studies of all kinds. It won’t quell existing worries, but it will help to prevent new ones, and eventually the truth will out.

My reaction was that this was way too optimistic.The ovulation-and-voting study had large measurement error, high levels of variation, and any underlying effects were small. And all this is made even worse because they were studying within-person effects using a between-person design. So any statistically significant difference they find is likely to be in the wrong direction and is essentially certain to be a huge overestimate. That is, the design has a high Type S error rate and a high Type M error rate.

And, indeed, that’s what happened with the replication. It was a between-person comparison (that is, each person was surveyed at only one time point), there was no direct measurement of fertility, and this new study was powered to only be able to detect effects that were much larger than would be scientifically plausible.

The result: a pile of noise.

To the authors’ credit, their title leads right off with “Fertility Fails to Predict . . .” OK, not quite right, as they didn’t actually measure fertility, but at least they foregrounded their negative finding.

Bad Science

Is it fair for me to call this “bad science”? I think this description is fair. Let me emphasize that I’m not saying the authors of this study are bad people. Remember our principle that honesty and transparency are not enough. You can be of pure heart, but if you are studying a small and highly variable effect using a noisy design and crude measurement tools, you’re not going to learn anything useful. You might as well just be flipping coins or trying to find patterns in a table of random numbers. And that’s what’s going on here.

Indeed, this is one of the things that’s bothered me for years about preregistered replications. I love the idea of preregistration, and I love the idea of replication. These are useful tools for strengthening research that is potentially good research and for providing some perspective on questionable research that’s been done in the past. Even the mere prospect of preregistered replication can be a helpful conceptual tool when considering an existing literature or potential new studies.

But . . . if you take a hopelessly noisy design and preregister it, that doesn’t make it a good study. Put a pile of junk in a fancy suit and it’s still a pile of junk.

In some settings, I fear that “replication” is serving a shiny object to distract people from the central issues of measurement, and I think that’s what’s going on here. The authors of this study were working with some vague ideas of evolutionary psychology, and they seem to be working under the assumption that, if you’re interested in theory X, that the way to science is to gather some data that have some indirect connection to X and then compute some statistical analysis in order to make an up-or-down decision (“statistically significant / not significant” or “replicated / not replicated”).

Again, that’s not enuf! Science isn’t just about theory, data, analysis, and conclusions. It’s also about measurement. It’s quantitative. And some measurements and designs are just too noisy to be useful.

As we wrote a few years ago,

My criticism of the ovulation-and-voting study is ultimately quantitative. Their effect size is tiny and their measurement error is huge. My best analogy is that they are trying to use a bathroom scale to weigh a feather—and the feather is resting loosely in the pouch of a kangaroo that is vigorously jumping up and down.

At some point, a set of measurements is so noisy that biases in selection and interpretation overwhelm any signal and, indeed, nothing useful can be learned from them. I assume that the underlying effect size in this case is not zero—if we were to look carefully, we would find some differences in political attitude at different times of the month for women, also different days of the week for men and for women, and different hours of the day, and I expect all these differences would interact with everything—not just marital status but also age, education, political attitudes, number of children, size of tax bill, etc etc. There’s an endless number of small effects, positive and negative, bubbling around.

Bad Reporting

Bad science is compounded by bad reporting. Someone pointed me to a website called “The National Pulse,” which labels itself as “radically independent” but seems to be an organ of the Trump wing of the Republican party, and which featured this story, which they seem to have picked up from the notorious sensationalist site, The Daily Mail:

STUDY: Women More Likely to Vote Trump During Most Fertile Point of Menstrual Cycle.

A new scientific study indicates women are more likely to vote for former President Donald Trump during the most fertile period of their menstrual cycle. According to researchers from the New School for Social Research, led by psychologist Jessica L Engelbrecht, women, when at their most fertile, are drawn to the former President’s intelligence in comparison to his political opponents. The research occurred between July and August 2020, observing 549 women to identify changes in their political opinions over time. . . .

A significant correlation was noticed between women at their most fertile and expressing positive opinions towards former President Donald Trump. . . . the 2020 study indicated that women, while ovulating, were drawn to former President Trump because of his high degree of intelligence, not physical attractiveness. . . .

As I wrote above, I think that research study was bad, but, conditional on the bad design and measurement, its authors seem to have reported it honestly.

The news report adds new levels of distortion.

– The report states that the study observed women “to identify changes in their political opinions over time.” First, the study didn’t “observe” anyone; they conducted an online survey. Second, they didn’t identify any changes over time: the women in the study were surveyed only once!

– The report says something about “a significant correlation” and that “the study indicated that . . .” This surprised me, given that the paper itself was titled, “Fertility Fails to Predict Voter Preference for the 2020 Election.” How do you get from “fails to predict” to “a significant correlation”? I looked at the journal article and found the relevant bit:

Results of this analysis for all 14 matchups appear in Table 2. In contrast to the original study’s findings, only in the Trump-Obama matchup was there a significant relationship between conception risk and voting preference [r_pb (475) = −.106, p = .021] such that the probability of intending to vote for Donald J. Trump rose with conception risk.

Got it? They looked at 14 comparisons. Out of these, one of these was “statistically significant” at the 5% level. This is the kind of thing you’d expect to see from pure noise, or the mathematical equivalent, which is a study with noisy measurements of small and variable effects. The authors write, “however, it is possible that this is a Type I error, as it was the only significant result across the matchups we analyzed,” which I think is still too credulous a way to put it; a more accurate summary would be to say that the data are consistent with null effects, which is no surprise given the realistic possible sizes of any effects in this very underpowered study.

The authors of the journal article also write, “Several factors may account for the discrepancy between our [lack of replication of] the original results.” They go on for six paragraphs giving possible theories—but never once considering the possibility that the original studies and theirs were just too noisy to learn anything useful.

Look. I don’t mind a bit of storytelling: why not? Storytelling is fun, and it can be a good way to think about scientific hypotheses and their implications. The reason we do social science is because we’re interested in the social world; we’re not just number crunchers. So I don’t mind that the authors had several paragraphs with stories. The problem is not that they’re telling stories, it’s that they’re only telling stories. They don’t ever reflect that this entire literature is chasing patterns in noise.

And this lack of reflection about measurement and effect size is destroying them! They went to all this trouble to replicate this old study, without ever grappling with that study’s fundamental flaw (see kangaroo picture at the top of this post). Again, I’m not saying that they authors are bad people or that they intend to mislead; they’re just doing bad, 2010-2015-era psychological science. They don’t know better, and they haven’t been well served by the academic psychology establishment which has promoted and continues to promote this sort of junk science.

Don’t blame the authors of the bad study for the terrible distorted reporting

Finally, it’s not the authors’ fault that their study was misreported by the Daily Mail and that Steve Bannon associated website. “Fails to Predict” is right there in the title of the journal article. If clickbait websites and political propagandists want to pull out that p = 0.02 result from your 14 comparisons and spin a tale around it, you can’t really stop them.

The Center for Open Science!

Science reform buffs will enjoy these final bits from the published paper:

When do we expect conformal prediction sets to be helpful? 

This is Jessica. Over on substack, Ben Recht has been posing some questions about the value of prediction bands with marginal guarantees, such as one gets from conformal prediction. It’s an interesting discussion that caught my attention since I have also been musing about where conformal prediction might be helpful. 

To briefly review, given a training data set (X1, Y1), … ,(Xn, Yn), and a test point (Xn+1, Yn+1) drawn from the same distribution, conformal prediction returns a subset of the label space for which we can make coverage guarantees about the probability of containing the test point’s true label Yn+1. A prediction set Cn achieves distribution-free marginal coverage at level 1 − alpha when P(Yn+1 ∈ Cn(Xn+1)) >= 1 − alpha for all joint distributions P on (X, Y). The commonly used split conformal prediction process attains this by adding a couple of steps to the typical modeling workflow: you first split the data into a training and calibration set, fitting the model on the training set. You choose a heuristic notion of uncertainty from the trained model, such as the softmax values–pseudo-probabilities from the last layer of a neural network–to create a score function s(x,y) that encodes disagreement between x and y (in a regression setting these are just the residuals). You compute q_hat, the ((n+1)(1-alpha))/n quantile of the scores on the calibration set. Then given a new instance x_n+1, you construct a prediction set for y_n+1 by including all y’s for which the score is less than or equal to q_hat. There are various ways to achieve slightly better performance, such as using cumulative summed scores and regularization instead.

Recht makes several good points about limitations of conformal prediction, including:

—The marginal coverage guarantees are often not very useful. Instead we want conditional coverage guarantees that hold conditional on the value of Xn+1 we observe. But you can’t get true conditional coverage guarantees (i.e., P(Yn+1 ∈ Cn(Xn+1)|Xn+1 = x) >= 1 − alpha for all P and almost all x) if you also want the approach to be distribution free (see e.g., here), and in general you need a very large calibration set to be able to say with high confidence that there is a high probability that your specific interval contains the true Yn+1.

—When we talk about needing prediction bands for decisions, we are often talking about scenarios where the decisions we want to make from the uncertainty quantification are going to change the distribution and violate the exchangeability criterion. 

—Additionally, in many of the settings where we might imagine using prediction sets there is potential for recourse. If the prediction is bad, resulting in a bad action being chosen, the action can be corrected, i.e., “If you have multiple stages of recourse, it almost doesn’t matter if your prediction bands were correct. What matters is whether you can do something when your predictions are wrong.”

Recht also criticizes research on conformal prediction as being fixated on the ability to make guarantees, irrespective of how useful the resulting intervals are. E.g., we can produce sets with 95% coverage with only two points, and the guarantees are always about coverage instead of the width of the interval.

These are valid points, worth discussing given how much attention conformal prediction has gotten lately. Some of the concerns remind me of the same complaints we often hear about traditional confidence intervals we put on parameter estimates, where the guarantees we get (about the method) are also generally not what we want (about the interval itself) and only actually summarize our uncertainty when the assumptions we made in inference are all good, which we usually can’t verify. A conformal prediction interval is about uncertainty in a model’s prediction on a specific instance, which perhaps makes it more misleading to some people given that it might not be conditional on anything specific to the instance. Still, even if the guarantees don’t stand as stated, I think it’s difficult to rule out an approach without evaluating how it gets used. Given that no method ever really quantifies all of our uncertainty, or even all of the important sources of uncertainty, the “meaning” of an uncertainty quantification really depends on its use, and what the alternatives considered in a given situation are. So I guess I disagree that one can answer the question “Can conformal prediction achieve the uncertainty quantification we need for decision-making?” without considering the specific decision at hand, how we are constructing the prediction set exactly (since there are ways to condition the guarantees on some instance-specific information), and how it would be made without a prediction set. 

There are various scenarios where prediction sets are used without a human in the loop, like to get better predictions or directly calibrate decisions, where it seems hard to argue that it’s not adding value over not incorporating any uncertainty quantification. Conformal prediction for alignment purposes (e.g., control the factuality or toxicity of LLM outputs) seems to be on the rise. However I want to focus here on a scenario where we are directly presenting a human with the sets. One type of setting where I’m curious whether conformal prediction sets could be useful are those where 1) models are trained offline and used to inform people’s decisions, and 2) it’s hard to rigorously quantify the uncertainty in the predictions using anything the model produces internally, like softmax values which can be overfit to the training sample.

For example, a doctor needs to diagnose a skin condition and has access to a deep neural net trained on images of skin conditions for which the illness has been confirmed. Even if this model appears to be more accurate than the doctor on evaluation data, the hospital may not be comfortable deploying the model in place of the doctor. Maybe the doctor has access to additional patient information that may in some cases allow them to make a better prediction, e.g., because they can decide when to seek more information through further interaction or monitoring of the patient. This means the distribution does change upon acting on the prediction, and I think Recht would say there is potential for recourse here, since the doctor can revise the treatment plan over time (he lists a similar example here). But still, at any given point in time, there’s a model and there’s a decision to be made by a human.    

Giving the doctor information about the model’s confidence in its prediction seems like it should be useful in helping them appraise the prediction in light of their own knowledge. Similarly, giving them a prediction set over a single top-1 prediction seems potentially preferable so they don’t anchor too heavily on a single prediction. Deep neural nets for medical diagnoses can do better than many humans in certain domains while still having relatively low top-1 accuracy (e.g., here). 

A naive thing to do would be to just choose some number k of predictions from the model we think a doctor can handle seeing at once, and show the top-k with softmax scores. But an adaptive conformal prediction set seems like an improvement in that at least you get some kind of guarantee, even if it’s not specific to your interval like you want. Set size conveys information about the level of uncertainty like the width of a traditional confidence interval does, which seems more likely to be helpful for conveying relative uncertainty than holding set size constant and letting the coverage guarantee change (I’ve heard from at least one colleague who works extensively with doctors that many are pretty comfortable with confidence intervals). We can also take steps toward the conditional coverage that we actually want by using an algorithm that calibrates the guarantees over different classes (labels), or that achieves a relaxed version of conditional coverage, possibilities that Recht seems to overlook. 

So while I agree with all the limitations, I don’t necessarily agree with Recht’s concluding sentence here:

“If you have multiple stages of recourse, it almost doesn’t matter if your prediction bands were correct. What matters is whether you can do something when your predictions are wrong. If you can, point predictions coupled with subsequent action are enough to achieve nearly optimal decisions.” 

It seems possible that seeing a prediction set (rather than just a single top prediction) will encourage a doctor to consider other diagnoses that they may not have thought of. Presenting uncertainty often has _some_ effect on a person’s reasoning process, even if they can revise their behavior later. The effect of seeing more alternatives could be bad in some cases (they get distracted by labels that don’t apply), or it could be good (a hurried doctor recognizes a potentially relevant condition they might have otherwise overlooked). If we allow for the possibility that seeing a set of alternatives helps, it makes sense to have a way to generate them that give us some kind of coverage guarantee we can make sense of, even if it gets violated sometimes. 

This doesn’t mean I’m not skeptical of how much prediction sets might change things over more naively constructed sets of possible labels. I’ve spent a bit of time thinking about how, from the human perspective, prediction sets could or could not add value, and I suspect its going to be nuanced, and the real value probably depends on how the coverage responds under realistic changes in distribution. There are lots of questions that seem worth trying to answer in particular domains where models are being deployed to assist decisions. Does it actually matter in practice, such as in a given medical decision setting, for the quality of decisions that are made if the decision-makers are given a set of predictions with coverage guarantees versus a top-k display without any guarantees? And, what happens when you give someone a prediction set with some guarantee but there are distribution shifts such that the guarantees you give are not quite right? Are they still better off with the prediction set or is this worse than just providing the model’s top prediction or top-k with no guarantees? Again, many of the questions could also be asked of other uncertainty quantification approaches; conformal prediction is just easier to implement in many cases. I have more to say on some of these questions based on a recent study we did on decisions from prediction sets, where we compared how accurately people labeled images using them versus other displays of model predictions, but I’ll save that for another post since this is already long. 

Of course, it’s possible that in many settings we would be better using some inherently interpretable model for which we no longer need a distribution-free approach. And ultimately we might be better off if we can better understand the decision problem the human decision-maker faces and apply decision theory to try to find better strategies  rather than leaving it up to the human how to combine their knowledge with what they get from a model prediction. I think we still barely understand how this occurs even in high stakes settings that people often talk about.

I love this paper but it’s barely been noticed.

Econ Journal Watch asked me and some others to contribute to an article, “What are your most underappreciated works?,” where each of us wrote 200 words or less about an article of ours that had received few citations.

Here’s what I wrote:

What happens when you drop a rock into a pond and it produces no ripples?

My 2004 article, Treatment Effects in Before-After Data, has only 23 citations and this goes down to 16 after removing duplicates and citations from me. But it’s one of my favorite papers. What happened?

It is standard practice to fit regressions using an indicator variable for treatment or control; the coefficient represents the causal effect, which can be elaborated using interactions. My article from 2004 argues that this default class of models is fundamentally flawed in considering treatment and control conditions symmetrically. To the extent that a treatment “does something” and the control “leaves you alone,” we should expect before-after correlation to be higher in the control group than in the treatment group. But this is not implied by the usual models.

My article presents three empirical examples from political science and policy analysis demonstrating the point. The article also proposes some statistical models. Unfortunately, these models are complicated and can be noisy to fit with small datasets. It would help to have robust tools for fitting them, along with evidence from theory or simulation of improved statistical properties. I still hope to do such work in the future, in which case perhaps this work will have the influence I hope it deserves.

Here’s the whole collection. The other contributors were Robert Kaestner, Robert A. Lawson, George Selgin, Ilya Somin, and Alexander Tabarrok.

My contribution got edited! I prefer my original version shown above; if you’re curious about the edited version, just follow the link and you can compare for yourself.

Others of my barely-noticed articles

Most of my published articles have very few citations; it’s your usual Zipf or long-tailed thing. Some of those have narrow appeal and so, even if I personally like the work, it is understandable that they haven’t been cited much. For example, “Bayesian hierarchical classes analysis” (16 citations) took a lot of effort on our part and appeared in a good journal, but ultimately it’s on a topic that not many researchers are interested in. For another example, I enjoyed writing “Teaching Bayes to Graduate Students in Political Science, Sociology, Public Health, Education, Economics, . . .” (17 citations) and I think if it reached the right audience of educators it could have a real influence, but it’s not the kind of paper that gets built upon or cited very often. A couple of my ethics and statistics papers from my Chance column only have 14 citations each; no surprise given that nobody reads Chance. At one point I was thinking of collecting them into a book, as this could get more notice.

Some papers are great but only take you part of the way there. I really like my morphing paper with Cavan and Phil, “Using image and curve registration for measuring the goodness of fit of spatial and temporal predictions” (12 citations) and, again, it appeared in a solid journal, but it was more of a start than a finish to a research project. We didn’t follow it up, and it seems that nobody else did either.

Sometimes we go to the trouble of writing a paper and going through the review process, but then it gets so little notice that I ask myself in retrospect, why did we bother? For example, “Objective Randomised Blinded Investigation With Optimal Medical Therapy of Angioplasty in Stable Angina (ORBITA) and coronary stents: A case study in the analysis and reporting of clinical trials” has been cited only 5 times since its publication in 2019—and three of those citations were from me. It seems safe to say that this particular dropped rock produced few ripples.

What happened? That paper had a good statistical message and a good applied story, but we didn’t frame it in a general-enough way. Or . . . it wasn’t quite that, exactly. It’s not a problem of framing so much as of context.

Here’s what would’ve made the ORBITA paper work, in the sense of being impactful (i.e., useful): either a substantive recommendation regarding heart stents or a general recommendation (a “method”) regarding summarizing and reporting clinical studies. We didn’t have either of these. Rather than just getting the paper published, we should’ve done the hard work to more forward in one of those two directions. Or, maybe our strategy was ok if we can use this example in some future article. The article presented a great self-contained story that could be part of larger recommendations. But the story on its own didn’t have impact.

This is a good reminder that what typically makes a paper useful is if it can get used by people. A starting point is the title. We should figure out who might find the contents of the article useful and design the title from there.

Or, for another example, consider “Extension of the Isobolographic Approach to Interactions Studies Between More than Two Drugs: Illustration with the Convulsant Interaction between Pefloxacin, Norfloxacin, and Theophylline in Rats” (5 citations). I don’t remember this one at all, and maybe it doesn’t deserve to be read—but if it does, maybe it should’ve be more focused on the general approach so it could’ve been more directly useful to people working in that field.

“Information, incentives, and goals in election forecasts” (21 citations). I don’t know what to say about this one. I like the article, it’s on a topic that lots of people care about, the title seems fine, but not much impact. Maybe more people will look at it in 2024? “Accounting for uncertainty during a pandemic” is another one with only 21 citations. For that one, maybe people are just sick of reading about the goddam pandemic. I dunno; I think uncertainty is an important topic.

The other issue with citations is that people have to find your paper before they would consider citing it. I guess that many people in the target audiences for our articles never even knew they existed. From that perspective, it’s impressive that anything new ever gets cited at all.

Here’s an example of a good title: “A simple explanation for declining temperature sensitivity with warming.” Only 25 citations so far, but I have some hopes for this one: the title really nails the message, so once enough people happen to come across this article one way or another, I think they’ll read it and get the point, and this will eventually show up in citations.

“Tables as graphs: The Ramanujan principle” (4 citations). OK, I love this paper too, but realistically it’s not useful to anyone! So, fair enough. Similarly with “‘How many zombies do you know?’ Using indirect survey methods to measure alien attacks and outbreaks of the undead” (6 citations). An inspired, hilarious effort in my opinion, truly a modern classic, but there’s no real reason for anyone to actually cite it.

“Should we take measurements at an intermediate design point?” (3 citations). This is the one that really bugs me. Crisp title, clean example, innovative ideas . . . it’s got it all. But it’s sunk nearly without a trace. I think the only thing to do here is to pursue the researcher further, get new results, and publish those. Maybe also set up the procedure more explicitly as a method, rather than just the solution to a particular applied problem.

I’ve been mistaken for a chatbot

… Or not, according to what language is allowed.

At the start of the year I mentioned that I am on a bad roll with AI just now, and the start of that roll began in late November when I received reviews back on a paper. One reviewer sent in a 150 word review saying it was written by chatGPT. The editor echoed, “One reviewer asserted that the work was created with ChatGPT. I don’t know if this is the case, but I did find the writing style unusual ….” What exactly was unusual was not explained.

That was November 20th. By November 22nd my computer shows a file created named ‘tryingtoproveIamnotchatbot,’ which is just a txt where I pasted in the GitHub commits showing progress on the paper. I figured maybe this would prove to the editors that I did not submit any work by chatGPT.

I didn’t. There are many reasons for this. One is I don’t think that I should. Further, I suspect chatGPT is not so good at this (rather specific) subject and between me and my author team, I actually thought we were pretty good at this subject. And I had met with each of the authors to build the paper, its treatise, data and figures. We had a cool new meta-analysis of rootstock x scion experiments and a number of interesting points. Some of the points I might even call exciting, though I am biased. But, no matter, the paper was the product of lots of work and I was initially embarrassed, then gutted, about the reviews.

Once I was less embarrassed I started talking timidly about it. I called Andrew. I told folks in my lab. I got some fun replies. Undergrads in my lab (and others later) thought the review itself may have been written by chatGPT. Someone suggested I rewrite the paper with chatGPT and resubmit. Another that I just write back one line: I’m Bing.

What I took away from this was myriad, but I came up with a couple next steps. I decided this was not a great peer review process that I should reach out to the editor (and, as one co-author suggested, cc the editorial board). And another was to not be so mortified as to not talk about this.

What I took away from these steps were two things:

1) chatGPT could now control my language.

I connected with a senior editor on the journal. No one is a good position here, and the editor and reviewers are volunteering their time in a rapidly changing situation. I feel for them and for me and my co-authors. The editor and I tried to bridge our perspectives. It seems he could not have imagined that I or my co-authors would be so offended. And I could not have imagined that the journal already had a policy of allowing manuscripts to use chatGPT, as long as it was clearly stated.

I was also given some language changes to consider, so I might sound less like chatGPT to reviewers. These included some phrases I wrote in the manuscript (e.g. `the tyranny of terroir’). Huh. So where does that end? Say I start writing so I sound less to the editor and others ‘like chatGPT’ (and I never figured out what that means), then chatGPT digests that and then what? I adapt again? Do I eventually come back around to those phrases once they have rinsed out of the large language model?

2) Editors are shaping the language around chatGPT.

Motivated by a co-author’s suggestion, I wrote a short reflection which recently came out in a careers column. I much appreciate the journal recognizing this as an important topic and that they have editorial guidelines to follow for clear and consistent writing. But I was surprised by the concerns from the subeditors on my language. (I had no idea my language was such a problem!)

This problem was that I wrote: I’ve been mistaken for a chatbot (and similar language). The argument was that I had not been mistaken — my writing had been. The debate that ensued was fascinating. If I had been in a chatroom and this happened, then I could write `I’ve been mistaken for a chatbot’ but since my co-authors and I wrote this up and submitted it to a journal, it was not part of our identities. So I was over-reaching in my complaint. I started to wonder: if I could not say ‘I was mistaken for an AI bot’ — why does the chatbot get ‘to write’? I went down an existential hole, from which I have not fully recovered.

And since then I am still mostly existing there. On the upbeat side, writing the reflection was cathartic and the back and forth with the editors — who I know are just trying to their jobs too — gave me more perspectives and thoughts, however muddled. And my partner recently said to me, “perhaps one day it will be seen as a compliment to be mistaken for a chatbot, just not today!”

Also, since I don’t know an archive that takes such things so I will paste the original unedited version below.

I have just been accused of scientific fraud. It’s not data fraud (which, I guess, is a relief because my lab works hard at data transparency, data sharing and reproducibility). What I have just been accused of is writing fraud. This hurts, because—like many people—I find writing a paper a somewhat painful process.

Like some people, I comfort myself by reading books on how to write—both to be comforted by how much the authors of such books stress that writing is generally slow and difficult, and to find ways to improve my writing. My current writing strategy involves willing myself to write, multiple outlines, then a first draft, followed by much revising. I try to force this approach on my students, even though I know it is not easy, because I think it’s important we try to communicate well.

Imagine my surprise then when I received reviews back that declared a recently submitted paper of mine a chatGPT creation. One reviewer wrote that it was `obviously Chat GPT’ and the handling editor vaguely agreed, saying that they found `the writing style unusual.’ Surprise was just one emotion I had, so was shock, dismay and a flood of confusion and alarm. Given how much work goes into writing a paper, it was quite a hit to be accused of being a chatbot—especially in short order without any evidence, and given the efforts that accompany the writing of almost all my manuscripts.

I hadn’t written a word of the manuscript with chatGPT and I rapidly tried to think through how to prove my case. I could show my commits on GitHub (with commit messages including `finally writing!’ and `Another 25 mins of writing progress!’ that I never thought I would share), I could try to figure out how to compare the writing style of my pre-chatGPT papers on this topic to the current submission, maybe I could ask chatGPT if it thought I it wrote the paper…. But then I realized I would be spending my time trying to prove I am not a chatbot, which seemed a bad outcome to the whole situation. Eventually, like all mature adults, I decided what I most wanted to do was pick up my ball (manuscript) and march off the playground in a small fury. How dare they?

Before I did this, I decided to get some perspectives from others—researchers who work on data fraud, co-authors on the paper and colleagues, and I found most agreed with my alarm. One put it most succinctly to me: `All scientific criticism is admissible, but this is a different matter.’

I realized these reviews captured both something inherently broken about the peer review process and—more importantly to me—about how AI could corrupt science without even trying. We’re paranoid about AI taking over us weak humans and we’re trying to put in structures so it doesn’t. But we’re also trying to develop AI so it helps where it should, and maybe that will be writing parts of papers. Here, chatGPT was not part of my work and yet it had prejudiced the whole process simply by its existential presence in the world. I was at once annoyed at being mistaken for a chatbot and horrified that reviewers and editors were not more outraged at the idea that someone had submitted AI generated text.

So much of science is built on trust and faith in the scientific ethics and integrity of our colleagues. We mostly trust others did not fabricate their data, and I trust people do not (yet) write their papers or grants using large language models without telling me. I wouldn’t accuse someone of data fraud or p-hacking without some evidence, but a reviewer felt it was easy enough to accuse me of writing fraud. Indeed, the reviewer wrote, `It is obviously [a] Chat GPT creation, there is nothing wrong using help ….’ So it seems, perhaps, that they did not see this as a harsh accusation, and the editor thought nothing of passing it along and echoing it, but they had effectively accused me of lying and fraud in deliberately presenting AI generated text as my own. They also felt confident that they could discern my writing from AI—but they couldn’t.

We need to be able to call out fraud and misconduct in science. Currently, the costs to the people who call out data fraud seem too high to me, and the consequences for being caught too low (people should lose tenure for egregious data fraud in my book). But I am worried about a world in which a reviewer can casually declare my work AI-generated, and the editors and journal editor simply shuffle along the review and invite a resubmission if I so choose. It suggests not only a world in which the reviewers and editors have no faith in the scientific integrity of submitting authors—me—but also an acceptance of a world where ethics are negotiable. Such a world seems easy for chatGPT to corrupt without even trying—unless we raise our standards.

Side note: Don’t forget to submit your entry to the International Cherry Blossom Prediction Competition!

Cherry blossoms—not just another prediction competition

It’s back! As regular readers know, the Cherry Blossom Prediction Competition will run throughout February 2024. We challenge you to predict the bloom date of cherry trees at five locations throughout the world and win prizes.

We’ve been promoting the competition for three years now—but we haven’t really emphasized the history of the problem. You might be surprised to know that bloom date prediction interested several famous nineteenth century statisticians. Co-organizer Jonathan Auerbach explains:

The “law of the flowering plants” states that a plant blooms after being exposed to a predetermined quantity of heat. The law was discovered in the mid-eighteenth century by René Réaumur, an early adopter of the thermometer—but it was popularized by Adolphe Quetelet, who devoted a chapter to the law in his Letters addressed to HRH the Grand Duke of Saxe Coburg and Gotha (Letter Number 33). See this tutorial for details.

Kotz and Johnson list Letters as one of eleven major breakthroughs in statistics prior to 1900, and the law of the flowering plants appears to have been well known throughout the nineteenth century, influencing statisticians such as Francis Galton and Florence Nightingale. But its popularity waned among statisticians as statistics transitioned from a collection of “fundamental” constants to a collection of principles for quantifying uncertainty. In fact, Ian Hacking mocks the law as a particularly egregious example of stamp collecting statistics.

But the law is widely used today! Charles Morren, Quetelet’s collaborator, later coined the term phenology, the name of the field that currently studies life-cycle events, such as bloom dates. Phenologists keep track of accumulated heat or growing degree days to predict bloom dates, crop yields, and the emergence of insects. Predictions are made using a methodology that is largely unchanged since Quetelet’s time—despite the large amounts of data now available and amenable to machine learning.

Fun with Dååta: Reference librarian edition

Rasmuth Bååth reports the following fun story in a blog post, The source of the cake dataset (it’s a hierarchical modeling example included with the R package lme4).

Rasmuth writes,

While looking for a dataset to illustrate a simple hierarchical model I stumbled upon another one: The cake dataset in the lme4 package which is described as containing “data on the breakage angle of chocolate cakes made with three different recipes and baked at six different temperatures [as] presented in Cook (1938).

The search is on.

… after a fair bit of flustered searching, I realized that this scholarly work, despite its obvious relevance to society, was nowhere to be found online.

The plot thickens like cake batter until Megan N. O’Donnell, a reference librarian (officially, Research Data Services Lead!) at Iowa State, the source of the original, gets involved. She replies to Rasmuth’s query,

Sorry for the delay — I got caught up in a deadline. The scan came out fairly well, but page 16 is partially cut off. I’ll put in a request to have it professionally scanned, but that will take some time. Hopefully this will do for now.

Rasmuth concludes,

She (the busy Research Data Services Lead with a looming deadline) is apologizing to me (the random Swede with an eccentric cake thesis digitization request) that it took a few days to get me everything I asked for!?

Reference librarians are amazing! Read the whole story and download the actual manuscript from Rasmuth’s original blog post. The details of the experimental design are quite interesting, including the device used to measure cake breakage angle, a photo of which is included in the post.

I think it’d be fun to organize a class around generating new, small scale and amusing data sets like this one. Maybe it sounds like more fun than it would actually be—data collection is grueling. Andrew says he’s getting tired of teaching data communication, and he’s been talking a lot more about the importance of data collection on the blog, so maybe next year…

P.S. In a related note, there’s something called a baath cake that’s popular in Goa and confused my web search.

The paradox of replication studies: A good analyst has special data analysis and interpretation skills. But it’s considered a bad or surprising thing that if you give the same data to different analysts, they come to different conclusions.

Benjamin Kircup writes:

I think you will be very interested to see this preprint that is making the rounds: Same data, different analysts: variation in effect sizes due to analytical decisions in ecology and evolutionary biology (ecoevorxiv.org)

I see several ties to social science, including the study of how data interpretation varies across scientists studying complex systems; but also the sociology of science. This is a pretty deep introspection for a field; and possibly damning. The garden of forking paths is wide. They cite you first, which is perhaps a good sign.

Ecologists frequently pride themselves on data analysis and interpretation skills. If there weren’t any variability, what skill would there be? It would all be mechanistic, rote, unimaginative, uninteresting. In general, actually, that’s the perception many have of typical biostatistics. It leaves insights on the table by being terribly rote and using the most conservative kinds of analytic tools (yet another t-test, etc). The price of this is that different people will reach different conclusions with the same data – and that’s not typically discussed, but raises questions about the literature as a whole.

One point: apparently the peer reviews didn’t systematically reward finding large effect sizes. That’s perhaps counterintuitive and suggests that the community isn’t rewarding bias, at least in that dimension. It would be interesting to see what you would do with the data.

The first thing I noticed is that the paper has about a thousand authors! This sort of collaborative paper kind of breaks the whole scientific-authorship system.

I have two more serious thoughts:

1. Kircup makes a really interesting point, that analysts “pride themselves on data analysis and interpretation skills. If there weren’t any variability, what skill would there be?”, but then it’s considered a bad or surprising thing that if you give the same data to different analysts, they come to different conclusions. There really does seem to be a fundamental paradox here. On one hand, different analysts do different things—Pete Palmer and Bill James have different styles, and you wouldn’t expect them to come to the same conclusions—; on the other hand, we expect strong results to appear no matter who is analyzing the data.

A partial resolution to this paradox is that much of the skill of data analysis and interpretation comes in what questions to ask. In these replication projects (I think Bob Carpenter calls them “bake-offs”), several different teams are given the same question and the same data and then each do their separate analysis. David Rothschild and I did one of these; it was called We Gave Four Good Pollsters the Same Raw Data. They Had Four Different Results, and we were the only analysts of that Florida poll from 2016 that estimated Trump to be in the lead. Usually, though, data and questions are not fixed, despite what it might look like when you read the published paper. Still, there’s something intriguing about what we might call the Analyst’s Paradox.

2. Regarding his final bit (“apparently the peer reviews didn’t systematically reward finding large effect sizes”), I think Kircup is missing the point. Peer reviews don’t systematically reward finding large effect sizes. What they systematically reward is finding “statistically significant” effects, i.e. those that are at least two standard errors from zero. But by restricting yourself to those, you automatically overestimate effect sizes, as I discussed to interminable length in papers such as Beyond power calculations: Assessing Type S (sign) and Type M (magnitude) errors and The failure of null hypothesis significance testing when studying incremental changes, and what to do about it. So they are rewarding bias, just indirectly.

The importance of measurement, and how you can draw ridiculous conclusions from your statistical analyses if you don’t think carefully about measurement . . . Leamer (1983) got it.

Screen Shot 2013-08-03 at 4.23.29 PM

Jacob Klerman writes:

I have noted your recent emphasis on the importance of measurement (e.g., “Here are some ways to make your study replicable…”). For reasons not relevant here, I was rereading Leamer (1983), Let’s Take the Con Out of Econometrics—now 40 years old. It’s a fun, if slightly dated, paper that you seem to be aware of.

Leamer also makes the measurement point (emphasis added):

When the sampling uncertainty S gets small compared to the misspecification uncertainty M ,it is time to look for other forms of evidence, experiments or nonexperiments. Suppose I am interested in measuring the width of a coin. and I provide rulers to a room of volunteers. After each volunteer has reported a measurement, I compute the mean and standard deviation, and I conclude that the coin has width 1.325 millimeters with a standard error of .013. Since this amount of uncertainty is not to my liking, I propose to find three other rooms full of volunteers, thereby multiplying the sample size by four, and dividing the standard error in half. That is a silly way to get a more accurate measurement, because I have already reached the point where the sampling uncertainty S is very small compared with the misspecification uncertainty M. If I want to increase the true accuracy of my estimate, it is time for me to consider using a micrometer. So to in the case of diet and heart disease. Medical researchers had more or less exhausted the vein of nonexperimental evidence, and it became time to switch to the more expensive but richer vein of experimental evidence.

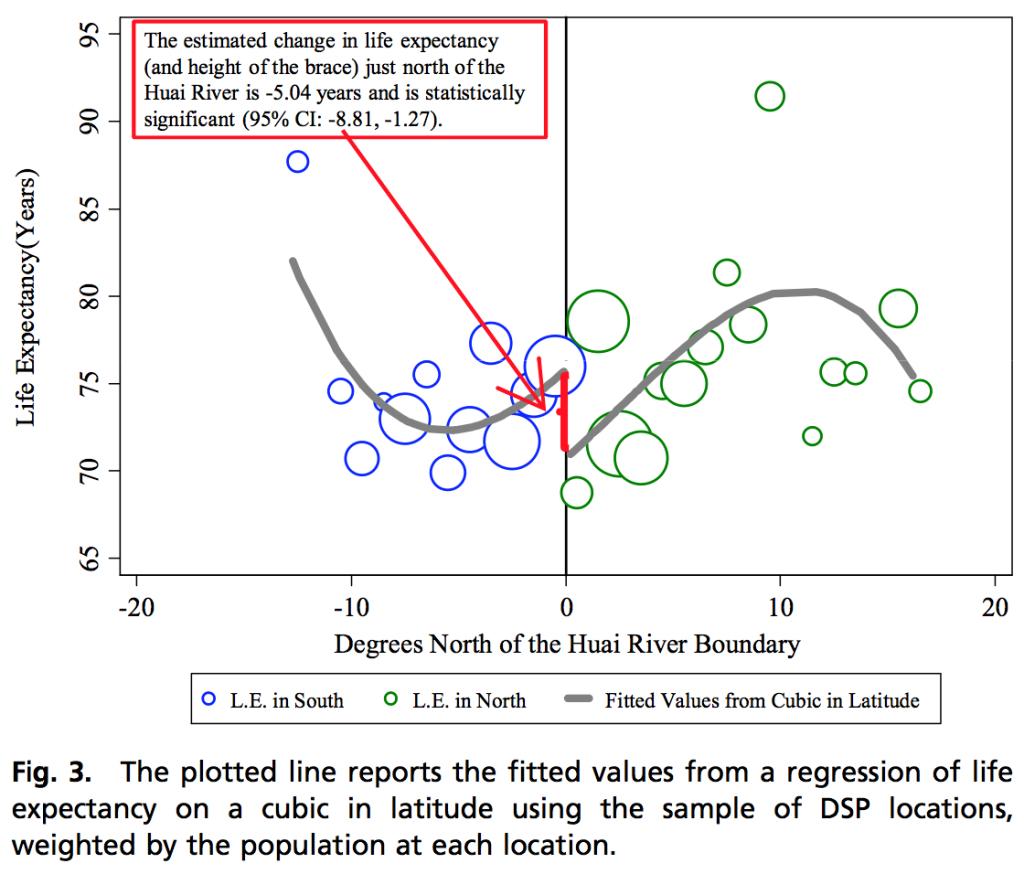
Interesting. Good to see examples where ideas we talk about today were already discussed in the classic literature. I indeed thing measurement is important and is under-discussed in statistics. Economists are very familiar with the importance of measurement, both in theory (textbooks routinely discuss the big challenges in defining, let alone measuring, key microeconomic quantities such as “the money supply”) and in practice (data gathering can often be a big deal, involving archival research, data quality checking, etc., even if unfortunately this is not always done), but then once the data are in, data quality and issues of bias and variance of measurement often seem to be forgotten. Consider, for example, this notorious paper where nobody at any stage in the research, writing, reviewing, revising, or editing process seemed to be concerned about that region with a purported life expectancy of 91 (see the above graph)—and that doesn’t even get into the bizarre fitted regression curve. But, hey, p less than 0.05. Publishing and promoting such a result based on the p-value represents some sort of apogee of trusting implausible theory over realistic measurement.

Also, if you want a good story about why it’s a mistake to think that your uncertainty should just go like 1/sqrt(n), check out this story which is also included in our forthcoming book, Active Statistics.

Resources for teaching and learning survey sampling, from Scott Keeter at Pew Research

Art Owen informed me that he’ll be teaching sampling again at Stanford, and he was wondering about ideas for students gathering their own data.

I replied that I like the idea of sampling from databases, biological sampling, etc. You can point out to students that a “blood sample” is indeed a sample!

Art replied:

Your blood example reminds me that there is a whole field (now very old) on bulk sampling. People sample from production runs, from cotton samples, from coal samples and so on. Widgets might get sampled from the beginning, middle and end of the run. David Cox wrote some papers on sampling to find the quality of cotton as measured by fiber length. The process is to draw a blue line across the sample and see the length of fibers that intersect the line. This gives you a length-biased sample that you can nicely de-bias. There’s also an interesting out there about tree sampling, literally on a tree, where branches get sampled at random and fruit is counted. I’m not sure if it’s practical.

Last time I found an interesting example where people would sample ocean tracts to see if there was a whale. If they saw one, they would then sample more intensely in the neighboring tracts. Then the trick was to correct for the bias that brings. It’s in the Sampling book by S. K. Thompson. There are also good mark-recapture examples for wildlife.

I hesitate to put a lot of regression in a sampling class; It is all too easy for every class to start looking like a regression/prediction/machine learning class. We need room for the ideas about where and how data arises and it’s too easy to crowd those out by dwelling on the modeling ideas.

I’ll probably toss in some space-filling sampling plans and other ways to down size data sets as well.

The old Cochran style was: get an estimator, show it is unbiased, find an expression for its variance, find an estimate of that variance, show this estimate is unbiased and maybe even find and compare variances of several competing variance estimates. I get why he did it but it can get dry. I include some of that but I don’t let it dominate the course. Choices you can make and their costs are more interesting.

I connected Art to Scott Keeter at Pew Research, who wrote:

Fortunately, we are pretty diligent about keeping track of what we do and writing it up. The examples below have lengthy methodology sections and often there is companion material (such as blog posts or videos) about the methodological issues.

We do not have a single overview methodological piece about this kind of work but the next best thing is a great lecture that Courtney Kennedy gave at the University of Michigan last year, walking through several of our studies and the considerations that went into each one:

Here are some links to good examples, with links to the methods sections or extra features:

Our recent study of Jewish Americans, the second one we’ve done. We switched modes for this study (thus different sampling strategy), and the report materials include an analysis of mode differences https://www.pewresearch.org/religion/2021/05/11/jewish-americans-in-2020/

Appendix A: Survey methodology

Jewish Americans in 2020: Answers to frequently asked questions

Our most recent survey of the US Muslim population:

U.S. Muslims Concerned About Their Place in Society, but Continue to Believe in the American Dream


A video on the methods:
https://www.pewresearch.org/fact-tank/2017/08/16/muslim-americans-methods/

This is one of the most ambitious international studies we’ve done:

Religion in India: Tolerance and Segregation


Here’s a short video on the sampling and methodology:
https://www.youtube.com/watch?v=wz_RJXA7RZM

We then had a quick email exchange:

Me: Thanks. Post should appear in Aug.

Scott: Thanks. We’ll probably be using sampling by spaceship and data collection with telepathy by then.

Me: And I’ll be charging the expenses to my NFT.

In a more serious vein, Art looked into Scott’s suggestions and followed up:

I [Art] looked at a few things at the Pew web-site. The quality of presentation is amazingly good. I like the discussions of how you identify who to reach out to. Also the discussion of how to pose the gender identity question is something that I think would interest students. I saw some of the forms and some of the data on response rates. I also found Courtney Kennedy’s video on non-probability polls. I might avoid religious questions for in-depth followup in class. Or at least, I would have to be careful in doing it, so nobody feels singled out.

Where could I find some technical documents about the American Trends Panel? I would be interested to teach about sample reweighting, e.g., raking and related methods, as it is done for real.

I’m wondering about getting survey data for a class. I might not be able to require them to get a Pew account and then agree to terms and conditions. Would it be reasonable to share a downsampled version of a Pew data set with a class? Something about attitudes to science would be interesting for students.

To which Scott replied:

Here is an overview I wrote about how the American Trends Panel operates and how it has changed over time in response to various challenges:

Growing and Improving Pew Research Center’s American Trends Panel

This relatively short piece provides some good detail about how the panel works:
https://www.pewresearch.org/fact-tank/2021/09/07/how-do-people-in-the-u-s-take-pew-research-center-surveys-anyway/

We use the panel to conduct lots of surveys, but most of them are one-off efforts. We do make an effort to track trends over time, but that’s usually the way we used to do it when we conducted independent sample phone surveys. However, we sometimes use the panel as a panel – tracking individual-level change over time. This piece explains one application of that approach:
https://www.pewresearch.org/fact-tank/2021/01/20/how-we-know-the-drop-in-trumps-approval-rating-in-january-reflected-a-real-shift-in-public-opinion/

When we moved from mostly phone surveys to mostly online surveys, we wanted to assess the impact of the change in mode of interview on many of our standard public opinion measures. This study was a randomized controlled experiment to try to isolate the impact of mode of interview:

From Telephone to the Web: The Challenge of Mode of Interview Effects in Public Opinion Polls

Survey panels have some real benefits but they come with a risk – that panelists change as a result of their participation in the panel and no longer fully resemble the naïve population. We tried to assess whether that is happening to our panelists:

Measuring the Risks of Panel Conditioning in Survey Research

We know that all survey samples have biases, so we weight to try to correct those biases. This particularly methodology statement is more detailed than is typical and gives you some extra insight into how our weighting operates. Unfortunately, we do not have a public document that breaks down every step in the weighting process:

Methodology

Most of our weighting parameters come from U.S. government surveys such as the American Community Survey and the Current Population Survey. But some parameters are not available on government surveys (e.g., religious affiliation) so we created our own higher quality survey to collect some of these for weighting:

How Pew Research Center Uses Its National Public Opinion Reference Survey (NPORS)

This one is not easy to find on our website but it’s a good place to find wonky methodological content, not just about surveys but about our big data projects as well:

Home


We used to publish these through Medium but decided to move them in-house.

By the way, my colleagues in the survey methods group have developed an R package for the weighting and analysis of survey data. This link is to the explainer for weighting data but that piece includes links to explainers about the basic analysis package:
https://www.pewresearch.org/decoded/2020/03/26/weighting-survey-data-with-the-pewmethods-r-package/

Lots here to look at!

It’s been awhile since I’ve taught a course on survey sampling. I used to teach such a course—it was called Design and Analysis of Sample Surveys—and I enjoyed it. But . . . in the class I’d always have to spend some time discussing basic statistics and regression modeling, and this always was the part of the class that students found the most interesting! So I eventually just started teaching statistics and regression modeling, which led to my Regression and Other Stories book. The course I’m now teaching out of that book is called Applied Regression and Causal Inference. I still think survey sampling is important; it was just hard to find an audience for the course.

Progress in 2023, Leo edition

Following Andrew, Aki, Jessica, and Charles, and based on Andrew’s proposal, I list my research contributions for 2023.

Published:

  1. Egidi, L. (2023). Seconder of the vote of thanks to Narayanan, Kosmidis, and Dellaportas and contribution to the Discussion of ‘Flexible marked spatio-temporal point processes with applications to event sequences from association football’Journal of the Royal Statistical Society Series C: Applied Statistics72(5), 1129.
  2. Marzi, G., Balzano, M., Egidi, L., & Magrini, A. (2023). CLC Estimator: a tool for latent construct estimation via congeneric approaches in survey research. Multivariate Behavioral Research, 58(6), 1160-1164.
  3. Egidi, L., Pauli, F., Torelli, N., & Zaccarin, S. (2023). Clustering spatial networks through latent mixture models. Journal of the Royal Statistical Society Series A: Statistics in Society186(1), 137-156.
  4. Egidi, L., & Ntzoufras, I. (2023). Predictive Bayes factors. In SEAS IN. Book of short papers 2023 (pp. 929-934). Pearson.
  5. Macrì Demartino, R., Egidi, L., & Torelli, N. (2023). Power priors elicitation through Bayes factors. In SEAS IN. Book of short papers 2023 (pp. 923-928). Pearson.

Preprints:

  1. Consonni, G., & Egidi, L. (2023). Assessing replication success via skeptical mixture priorsarXiv preprint arXiv:2401.00257. Submitted.

Softwares:

    CLC estimator

  • free and open-source app to estimate latent unidimensional constructs via congeneric approaches in survey research (Marzi et al., 2023)

   footBayes package (CRAN version 0.2.0)

   pivmet package (CRAN version 0.5.0)

I hope and guess that the paper dealing with the replication crisis, “Assessing replication success via skeptical mixture priors” with Guido Consonni, could have good potential in the Bayesian assesment of replication success in social and hard sciences; this paper can be seen as an extension of the paper written by Leonhard Held and Samuel Pawel entitled “The Sceptical Bayes Factor for the Assessment of Replication Success“.  Moreover, I am glad that the paper “Clustering spatial networks through latent mixture models“, focused on a model-based clustering approach defined in a hybrid latent space, has been finally published in JRSS A.

Regarding softwares, the footBayes package, a tool to fit the most well-known soccer (football) models through Stan and maximum likelihood methods, has been deeply developed and enriched with new functionalities (2024 objective: incorporate CmdStan with VI/Pathfinder algorithms and write a package’s paper in JSS/R Journal format).

Learning from mistakes (my online talk for the American Statistical Association, 2:30pm Tues 30 Jan 2024)

Here’s the link:

Learning from mistakes

Andrew Gelman, Department of Statistics and Department of Political Science, Columbia University

We learn so much from mistakes! How can we structure our workflow so that we can learn from mistakes more effectively? I will discuss a bunch of examples where I have learned from mistakes, including data problems, coding mishaps, errors in mathematics, and conceptual errors in theory and applications. I will also discuss situations where researchers have avoided good learning opportunities. We can then try to use all these cases to develop some general understanding of how and when we learn from errors in the context of the fractal nature of scientific revolutions.

The video is here.

It’s sooooo frustrating when people get things wrong, the mistake is explained to them, and they still don’t make the correction or take the opportunity to learn from their mistakes.

To put it another way . . . when you find out you made a mistake, you learn three things:

1. Now: Your original statement was wrong.

2. Implications for the future: Beliefs and actions that flow from that original statement may be wrong. You should investigate your reasoning going forward and adjust to account for your error.

3. Implications for the past: Something in your existing workflow led to your error. You should trace your workflow, see how that happened, and alter your workflow accordingly.

In poker, they say to evaluate the strategy, not the play. In quality control, they say to evaluate the process, not the individual outcome. Similarly with workflow.

As we’ve discussed many many times in this space (for example, here), it makes me want to screeeeeeeeeeam when people forego this opportunity to learn. Why do people, sometimes very accomplished people, give up this opportunity? I’m speaking here of people who are trying their best, not hacks and self-promoters.

The simple answer for why even honest people will avoid admitting clear mistakes is that it’s embarrassing for them to admit error, they don’t want to lose face.

The longer answer, I’m afraid, is that at some level they recognize issues 1, 2, and 3 above, and they go to some effort to avoid confronting item 1 because they really really don’t want to face item 2 (their beliefs and actions might be affected, and they don’t want to hear that!) and item 3 (they might be going about everything all wrong, and they don’t want to hear that either!).

So, paradoxically, the very benefits of learning from error are scary enough to some people that they’ll deny or bury their own mistakes. Again, I’m speaking here of otherwise-sincere people, not of people who are willing to lie to protect their investment or make some political point or whatever.

In my talk, I’ll focus on my own mistakes, not those of others. My goal is for you in the audience to learn how to improve your own workflow so you can catch errors faster and learn more from them, in all three senses listed above.

P.S. Planning a talk can be good for my research workflow. I’ll get invited to speak somewhere, then I’ll write a title and abstract that seems like it should work for that audience, then the existence of this structure gives me a chance to think about what to say. For example, I’d never quite thought of the three ways of learning from error until writing this post, which in turn was motivated by the talk coming up. I like this framework. I’m not claiming it’s new—I guess it’s in Pólya somewhere—, just that it will help my workflow. Here’s another recent example of how the act of preparing an abstract helped me think about a topic of continuing interest to me.

Regarding the use of “common sense” when evaluating research claims

I’ve often appealed to “common sense” or “face validity” when considering unusual research claims. For example, the statement that single women during certain times of the month were 20 percentage points more likely to support Barack Obama, or the claim that losing an election for governor increases politicians’ lifespan by 5-10 years on average, or the claim that a subliminal smiley face flashed on a computer screen causes large changes in people’s attitudes on immigration, or the claim that attractive parents are 36% more likely to have girl babies . . . these claims violated common sense. Or, to put it another way, they violated my general understanding of voting, health, political attitudes, and human reproduction.

I often appeal to common sense, but that doesn’t mean that I think common sense is always correct or that we should defer to common sense. Rather, common sense represents some approximation of a prior distribution or existing model of the world. When our inferences contradict our expectations, that is noteworthy (in a chapter 6 of BDA sort of way), and we want to address this. It could be that addressing this will result in a revision of “common sense.” That’s fine, but if we do decide that our common sense was mistaken, I think we should make that statement explicitly. What bothers me is when people report findings that contradict common sense and don’t address the revision in understanding that would be required to accept that.

In each of the above-cited examples (all discussed at various times on this blog), there was a much more convincing alternative explanation for the claimed results, given some mixture of statistical errors and selection bias (p-hacking or forking paths). That’s not to say the claims are wrong (Who knows?? All things are possible!), but it does tell us that we don’t need to abandon our prior understanding of these things. If we want to abandon our earlier common-sense views, that would be a choice to be made, an affirmative statement that those earlier views are held so weakly that they can be toppled by little if any statistical evidence.

P.S. Perhaps relevant is this recent article by Mark Whiting and Duncan Watts, “A framework for quantifying individual and collective common sense.”

Progress in 2023, Charles edition

Following the examples of Andrew, Aki, and Jessica, and at Andrew’s request:

Published:

Unpublished:

This year, I also served on the Stan Governing Body, where my primary role was to help bring back the in-person StanCon. StanCon 2023 took place at the University of Washington in St. Louis, MO and we got the ball rolling for the 2024 edition which will be held at Oxford University in the UK.

It was also my privilege to be invited as an instructor at the Summer School on Advanced Bayesian Methods at KU Leuven, Belgium and teach a 3-day course on Stan and Torsten, as well as teach workshops at StanCon 2023 and at the University of Buffalo.

Storytelling and Scientific Understanding (my talks with Thomas Basbøll at Johns Hopkins on 26 Apr)

Storytelling and Scientific Understanding

Andrew Gelman and Thomas Basbøll

Storytelling is central to science, not just as a tool for broadcasting scientific findings to the outside world, but also as a way that we as scientists understand and evaluate theories. We argue that, for this purpose, a story should be anomalous and immutable; that is, it should be surprising, representing some aspect of reality that is not well explained by existing models of the world, and have details that stand up to scrutiny.

We consider how this idea illuminates some famous stories in social science involving soldiers in the Alps, Chinese boatmen, and trench warfare, and we show how it helps answer literary puzzles such as why Dickens had all those coincidences, why authors are often so surprised by what their characters come up with, and why the best alternative history stories have the feature that, in these stories, our “real world” ends up as the deeper truth. We also discuss connections to chatbots and human reasoning, stylized facts and puzzles in science, and the millionth digit of pi.

At the center our framework is a paradox: learning from anomalies seems to contradict usual principles of science and statistics where we seek representative or unbiased samples. We resolve this paradox by placing learning-within-stories into a hypothetico-deductive (Popperian) framework, in which storytelling is a form of exploration of the implications of a hypothesis. This has direct implications for our work as a statistician and a writing coach.

Progress in 2023, Jessica Edition

Since Aki and Andrew are doing it… 

Published:

Unpublished/Preprints:

Performed:

If I had to choose a favorite (beyond the play, of course) it would be the rational agent benchmark paper, discussed here. But I also really like the causal quartets paper. The first aims to increase what we learn from experiments in empirical visualization and HCI through comparison to decision-theoretic benchmarks. The second aims to get people to think twice about what they’ve learned from an average treatment effect. Both have influenced what I’ve worked on since.

A feedback loop can destroy correlation: This idea comes up in many places.

The people who go by “Slime Mold Time Mold” write:

Some people have noted that not only does correlation not imply causality, no correlation also doesn’t imply no causality. Two variables can be causally linked without having an observable correlation. Two examples of people noting this previously are Nick Rowe offering the example of Milton Friedman’s thermostat and Scott Cunningham’s Do Not Confuse Correlation with Causality chapter in Causal Inference: The Mixtape.

We realized that this should be true for any control system or negative feedback loop. As long as the control of a variable is sufficiently effective, that variable won’t be correlated with the variables causally prior to it. We wrote a short blog post exploring this idea if you want to take a closer look. It appears to us that in any sufficiently effective control system, causally linked variables won’t be correlated. This puts some limitations on using correlational techniques to study anything that involves control systems, like the economy, or the human body. The stronger version of this observation, that the only case where causally linked variables aren’t correlated is when they are linked together as part of a control system, may also be true.

Our question for you is, has anyone else made this observation? Is it recognized within statistics? (Maybe this is all implied by Peston’s 1972 “The Correlation between Targets and Instruments”? But that paper seems totally focused on economics and has only 14 citations. And the two examples we give above are both economists.) If not, is it worth trying to give this some kind of formal treatment or taking other steps to bring this to people’s attention, and if so, what would those steps look like?

My response: Yes, this has come up before. It’s a subtle point, as can be seen in some of the confused comments to this post. In that example, the person who brought up the feedback-destroys-correlation example was economist Rachael Meager, and it was a psychologist, a law professor, and some dude who describes himself as “a professor, writer and keynote speaker specializing in the quality of strategic thinking and the design of decision processes” who missed the point. So it’s interesting that you brought up an example of feedback from the economics literature.

Also, as I like to say, correlation does not even imply correlation.

The point you are making about feedback is related to the idea that, at equilibrium in an idealized setting, price elasticity of demand should be -1, because if it’s higher or lower than that, it would make sense to alter the price accordingly and slide up or down that curve to maximize total $.

I’m not up on all this literature; it’s the kind of thing that people were writing about a lot back in the 1950s related to cybernetics. It’s also related to the idea that clinical trials exist on a phase transition where the new treatment exists but has not yet been determined to be better or worse than the old. This is sometimes referred to as “equipoise,” which I consider to be a very sloppy concept.

The other thing is that everybody knows how correlations can be changed by selection (Simpson’s paradox, the example of high school grades and SAT scores among students who attend a moderately selective institution, those holes in the airplane wings, etc etc.). Knowing about one mechanism for correlations to be distorted can perhaps make people less attuned to other mechanisms such as the feedback thing.

So, yeah, a lot going on here.

“Theoretical statistics is the theory of applied statistics”: A scheduled conference on the topic

Ron Kenett writes:

We are planning a conference on 11/4 that might be of interest to your blog followers.

It is a hybrid format event on the foundations of applied statistics. Discussion inputs will be most welcome.

The registration link and other information are here.

I think that “11/4” refers to 11 Apr 2024; if not, I guess that someone will correct me in comments.

Kenett’s paper on the theory of applied statistics reminds me of my dictum that theoretical statistics is the theory of applied statistics. For example of how this principle can inform both theory and applications, see this comment at the linked post:

There are lots of ways of summarizing a statistical analysis, and it’s good to have a sense of how the assumptions map to the conclusions. My problem with the paper [on early-childhood intervention; see pages 17-18 of this paper here for background] was that they presented a point estimate of an effect size magnitude (42% earnings improvement from early childhood intervention) which, if viewed classically, is positively biased (type M error) and, if viewed Bayesianly, corresponds to a substantively implausible prior distribution in which an effect of 84% is as probable as an effect of 0%.

If we want to look at the problem classically, I think researchers who use biased estimates should (i) recognize the bias, and (ii) attempt to adjust for it. Adjusting for the bias requires some assumption about plausible effect sizes; that’s just the way things are, so make the assumption and be clear about what assumption your making.

If we want to look at the problem Bayesianly, I think researchers should have to justify all aspects of their model, including their prior distribution. Sometimes the justification is along the lines of, “This part of the model doesn’t materially impact the final conclusions so we can go sloppy here,” which can be fine, but it doesn’t apply in a case like this where the flat prior is really driving the headline estimate.

The point is that theoretical concepts such as “unbiased estimation” or “prior distribution” don’t exist in a vacuum; they are theoretically relevant to the extent that they connect to applied practice.

I assume that such issues will be discussed at the conference.

“My quick answer is that I don’t care much about permutation tests because they are testing a null null hypothesis that is of typically no interest”

Riley DeHaan writes:

I’m a psych PhD student and I have a statistical question that’s been bothering me for some time and wondered if you’d have any thoughts you might be willing to share.

I’ve come across some papers employing z-scores of permutation null distributions as a primary metric in neuroscience (for an example, see here).

The authors computed a coefficient of interest in a multiple linear regression and then permuted the order of the predictors to obtain a permutation null distribution of that coefficient. “The true coefficient for functional connectivity is compared to the distribution of null coefficients to obtain a z-score and P-value.” The authors employed this permutation testing approach to avoid the need to model potentially complicated autocorrelations between the observations in their sample and then wanted a statistic that provided a measure of effect size rather than relying solely on p-values.

Is there any meaningful interpretation of a z-score of a permutation null distribution under the alternative hypothesis? Is this a commonly used approach? This approach would not appear to find meaningfully normalized estimates of effect size given the variability of the permutation null distribution may not have anything to do with the variance of the statistic of interest under its own distribution. In this case, I’m not sure a z-score based on the permutation null provides much information beyond significance. The variability of the permutation null distribution will also be a function of the sample size in this case. Could we argue that permutation null distributions would in many cases (I’m thinking about simple differences in means rather than regression coefficients) tend to overestimate the variability of the true statistic given permutation tests are conservative compared to tests based on known distributions of the statistic of interest? This z-score approach would then tend to produce conservative effect sizes. I’m not finding references to this approach online beyond this R package.

My reply: My quick answer is that I don’t care much about permutation tests because they are testing a null null hypothesis that is of typically no interest. Related thoughts are here.

P.S. If you, the reader of this blog, care about permutation tests, that’s fine! Permutation tests have a direct mathematical interpretation. They just don’t interest me, that’s all.

Prediction isn’t everything, but everything is prediction

Image

This is Leo.

Explanation or explanatory modeling can be considered to be the use of statistical models for testing causal hypotheses or associations, e.g. between a set of covariates and a response variable. Prediction or predictive modeling, (supposedly) on the other hand, is the act of using a model—or device, algorithm—to produce values of new, existing, or future observations. A lot has been written about the similarities and differences between explanation and prediction, for example Breiman (2001), Shmueli (2010), Billheimer (2019), and many more.

These are often thought to be separate dimensions of statistics, but Jonah and I have been discussing for a long time that in some sense there may actually be no such thing as explanation without prediction. Basically, although prediction itself is not the only goal of inferential statistics, everything—every objective—in inferential statistics can be reframed through the lense of prediction.

Hypothesis testing, ability estimation, hierarchical modeling, treatment effect estimation, causal inference problems, etc., can all be described in our opinion from a (inferential) predictive perspective. So far we have not found an example for which there is no way to reframe it as prediction problem. So I ask you: is there any inferential statistical ambition that cannot be described in predictive terms?

P.S. Like Billheimer (2019) and others, we think that inferential statistics should be considered as inherently predictive and be focused primarily on probabilistic predictions of observable events and quantities, rather than focusing on statistical estimates of unobersvable parameters that do not exist outside of our highly contrived models. Similarly, we also feel that the goal of Bayesian modeling should not be taught to students as finding the posterior distribution of unobservables, but rather as finding the posterior predictive distribution of the observables (with finding the posterior as an intermediate step); even when we don’t only care about predictive accuracy and we still care about understanding how a model works (model checking, GoF measures), we think the predictive modeling interpretation is generally more intuitive and effective.