This week, for the 3rd time, Dr. Arjun Potter and I are teaching a week-long course on statistical workflow at the Nelson Mandela African Institution of Science and Technology (NM-AIST), a public postgraduate research university in Arusha, Tanzania established in 2009. I blogged about the 1st iteration of the course here. And here are the course materials.

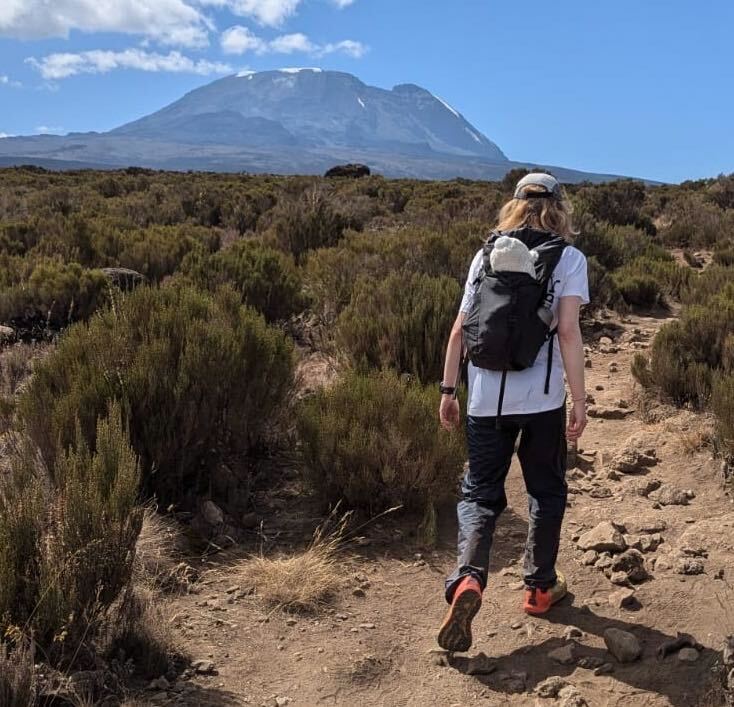

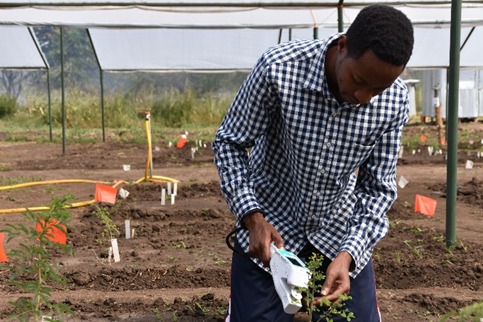
Our case study is an experiment on the NM-AIST campus designed and implemented by Arjun Potter and Charles Luchagula and colleagues to study the effects of drought, fire, and herbivory on growth of various acacia tree species. The focus is experimental design and modeling.

This is a blog series about surveys, so why am I talking about experiments ? Well, as Fienberg and Tanur (1987) said about the connections between survey sampling and experiments:
It is well known that the basic concepts in the design of sampling studies parallel those for the design of randomized experiments.
Their Table 1 shows some of these parallels:
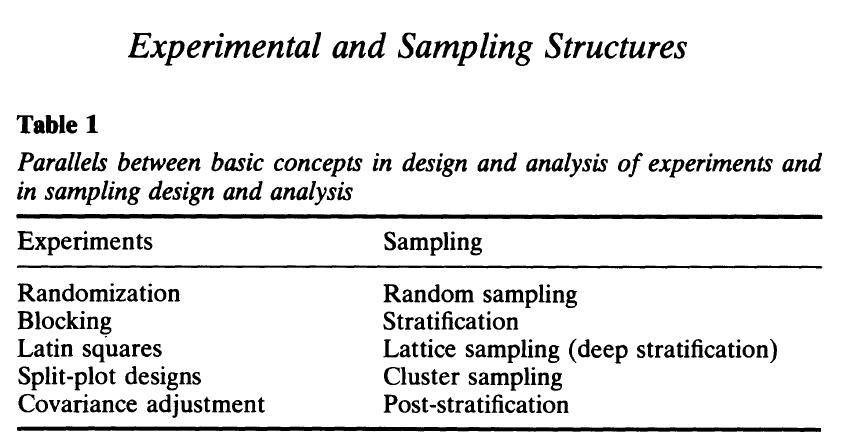
Let’s discuss two of these: split-plot/clusters and blocking/stratification.
Group-level interventions in Experiments, Clusters in Surveys
Manipulating fire is difficult. So the researchers chose to do the controlled burns at a larger-area level they call “blocks”. Herbivory and drought were assigned at the a smaller-area level they call “subplots”, nested within blocks. This is sometimes called “split-plots”.

Group-level interventions in experiments are analogous to cluster in surveys, as Lumley 2010 explains (bolding my own):
Cluster sampling, i.e., sampling a relatively small number of groups of people, is almost universal in large surveys that involve in-person interviews. In contrast to stratified sampling, which gives increased precision for the same sample size, cluster sampling decreases precision for a specified sample size, but can increase sample size and precision for a specified cost.
We saw this in the experimental context: the effect of fire is estimated with less precision than the effects of herbivory and drought.
We mentioned this in the (quasi-)experimental context in in The Millennium Villages Project: a retrospective, observational, endline evaluation: “challenges of reduced statistical power due to village-level interventions” (see our 2018 paper in The Lancet as well as blog posts from 2015, 2018, 2023).
Blocking in Experiments, Stratification in Surveys
If we directly randomize subplots to herbivory and drought, we could get unlucky and have all the herbivory subplots in the east or all the drought subplots are in the west. Instead, we randomize within each block to protect against this unluckiness.
Blocking in experiments is analogous to stratification in surveys, as Lumley 2010 explains (bolding my own):
One way to increase precision is stratified sampling, which involves dividing the population up into groups called strata and drawing a separate probability sample from each one. Stratification ensures that a prespecified number of observations from each stratum end up in the sample, rather than allowing distribution of observations across strata to be random.
Survey statisticians: what insights have you gained from the experimental design literature ?
Shira:
Regarding split-plot designs and the like, I recommend my 2005 paper, Analysis of variance: Why it is more important than ever, which discusses how the correct analysis of cluster designs just pops right out when you fit a multilevel model.
Thanks, Andrew ! I agree. Indeed, in the course we fit a multilevel model with block effects and treatment effects. The full model would also include subplot effects.
With a small number of blocks and plots, it could happen that even when you randomize you get an undesirable pattern, which of course is why people sometimes use Latin square designs and so on. I usually use simple randomization if it seems like that is going to be OK, and if not I do stratified random samples, but a few times in my career I’ve used a Latin square. Do you have any advice or insight on how/when to choose one approach or the other?
Thanks, Phil ! Great question. This experiment included 10 rainout shelters we call “blocks”, arranged in 2 rows and 5 columns. The fire treatment has 2 levels (fire or no) and was assigned to these “blocks”. My understanding of Latin Squares (see e.g. this https://online.stat.psu.edu/stat503/lesson/4/4.3) is that it considers rows and columns to each be blocking variables, and that the number of levels of each of these blocking variables needs to be equal, and also to equal the number of levels of treatment. But in this case, 2 != 5 != 2. So I don’t know that a Latin Square would exactly work. But you’re right that some other type of blocking on rows and columns was possible.
Phil, this came up again and I think a Latin-square-in-spirit method could just be systematic assignment of fire in the 2 dimensions like:
N F N F N
F N F N F
where F = fire, N = no fire.
What do you think ?
Not survey related – how did you assign natural herbivory to plots? Fence in the wildlife? It seems like domestic animals like goats would have far different levels of herbivory than wildlife.
Thanks, jd ! We simulated herbivory by clipping branches so that ~70% of biomass was removed and the young tree was pruned into a roundish shape. This replicates a one-time severe bout of herbivory by a hungry herbivore, rather than chronic herbivory pressure. We considered applying herbivory with the help of tethered goats, but ruled that out for several reasons. Some ecologists will insist that the saliva of animals has important biochemical impacts on the plants they nibble, but I’m skeptical of that body of research (though still open to the possibility!).
Your point is very well taken–domestic animals such as goats can seem to have higher impacts on vegetation than wildlife do, but I would argue that this is mostly because domestic animals are kept at high densities. As preferred food plant species and plant parts (fruits, leaves) are exhausted, hungry herbivores will move to less preferred plant species and plant parts (twigs). On top of this, large-bodied animals such as elephants take bigger bites and can break larger twigs or branches, causing a “heavier pruning” but this is made more complicated by the fact that they forage at coarser spatial scales and thus ignore small food plant patches which aren’t worth their time. I’d say the “level of herbivory” pressure is some combination of animal size (foraging style) and animal numbers (density). A third factor is the diet of herbivores: some eat mostly grass, others eat trees and bushes, and others eat a mix. Goats are fond of shrubs but will eat grass, while cows and sheep prefer grass; this might explain the voracious reputation that goats have. Having a mix of animal species, like you do in African savannas, means more of the plant growth gets eaten (higher herbivory pressure but perhaps more even utilization).
Last point.. assessing what levels of herbivory are “natural” is a bit tricky. Most of the world used to have herbivore faunas much like that in Africa (North America had mastodons, giant sloths, extinct horses, etc). This herbivore fauna was decimated quite recently (~10,000 years ago). In modern times, many herbivore populations are still being decimated (overhunting, habitat destruction), others are being replaced with domestic animals, and yet others are superabundant where predators are gone. The effects of all these changes are still being studied by people like me!