Nick Brown pointed me to a new paper, “The Impact of Incidental Environmental Factors on Vote Choice: Wind Speed is Related to More Prevention-Focused Voting,” to which his reaction was, “It makes himmicanes look plausible.” Indeed, one of the authors of this article had come up earlier on this blog as a coauthor of paper with fatally-flawed statistical analysis. So, between the general theme of this new article (“How might irrelevant events infiltrate voting decisions?”), the specific claim that wind speed has large effects, and the track record of one of the authors, I came into this in a skeptical frame of mind.
That’s fine. Scientific papers are for everyone, not just the true believers. Skeptics are part of the audience too.
Anyway, I took a look at the article and replied to Nick:
The paper is a good “exercise for the reader” sort of thing to find how they managed to get all those pleasantly low p-values. It’s not as blatantly obvious as, say, the work of Daryl Bem. The funny thing is, back in 2011, lots of people thought Bem’s statistical analysis was state-of-the-art. It’s only in retrospect that his p-hacking looks about as crude as the fake photographs that fooled Arthur Conan Doyle. Figure 2 of this new paper looks so impressive! I don’t really feel like putting in the effort to figuring out exactly how the trick was done in this case . . . Do you have any ideas?
Nick responded:
There are some hilarious errors in the paper. For example:
– On p. 7 of the PDF, they claim that “For Brexit, the “No” option advanced by the Stronger In campaign was seen as clearly prevention-oriented (Mean (M) = 4.5, Standard Error (SE) = 0.17, t(101) = 6.05, p < 0.001) whereas the “Yes” option put forward by the Vote Leave campaign was viewed as promotion-focused (M = 3.05, SE = 0.16, t(101) = 2.87, p = 0.003).": But the question was not "Do you want Brexit, Yes/No". It was "Should the UK Remain in the EU or Leave the EU". Hence why the pro-Brexit campaign was called "Vote Leave", geddit? Both sides agreed on before the referendum that this was fairer and clearer than Yes/No. Is "Remain" more prevention-focused than "Leave"? - On p. 12 of the PDF, they say "In the case of the Brexit vote, the Conservative Party advanced the campaign for the UK to leave the EU." This is again completely false. The Conservative government, including Prime Minister David Cameron, backed Remain. It's true that a number of Conservative politicians backed Leave, and after the referendum lots of Conservatives who had backed Remain pretended that they either really meant Leave or were now fine with it, but if you put that statement, "In the case of the Brexit vote, the Conservative Party advanced the campaign for the UK to leave the EU" in front of 100 UK political scientists, not one will agree with it. If the authors are able to get this sort of thing wrong then I certainly don't think any of their other analyses can be relied upon without extensive external verification. If you run the attached code on the data (mutatis mutandis for the directories in which the files live) you will get Figure 2 of the Mo et al. paper. Have a look at the data (the CSV file is an export of the DTA file, if you don't use Stata) and you will see that they collected a ton of other variables. To be fair they mention these in the paper ('Additionally, we collected data on other Election Day weather indicators (i.e., cloud cover, dew point, precipitation, pressure, and temperature), as well as historical wind speeds per council area.5 The inclusion of other Election Day weather indicators increases our confidence that we are detecting an association between wind speed and election outcomes, and not the effect of other weather indicators that may be correlated with wind speed.") My guess is that they went fishing and found that wind speed, as opposed to the other weather indicators that they mentioned, gave them a good story. Looking only at the Swiss data, I note that they also collected "Income", "Unemployment", "Age", "Race" (actually the percentage of foreign-born people; I doubt if Switzerland collects "Race" data; Supplement, Table S3, page 42), "Education", and "Rural", and threw those into their model as well. They also collected latitude and longitude (of the centroid?) for each canton, although those didn't make it into the analyses. Also they include "Turnout", but for any given Swiss referendum it seems that they only had the national turnout because this number is always the same for every "State" (canton) for any given "Election" (referendum). And the income data looks sketchy (people in Schwyz canton do not make 2.5 times what people in Zürich canton do). I think this whole process shows a degree of naivety about what "kitchen-sink" regression analyses (and more sophisticated versions thereof) can and can't do, especially with noisy measures (such as "Precipitation" coded as 0/1). Voter turnout is positively correlated with precipitation but negatively with cloud cover, whatever that means. Another glaring omission is any sort of weighting by population. The most populous canton in Switzerland has a population almost 100 times the least populous, yet every canton counts equally. There is no "population" variable in the dataset, although this would have been very easy to obtain. I guess this means they avoid the ecological fallacy, up to the point where they talk about individual voting behaviour (i.e., pretty much everywhere in the article).
Nick then came back with more:
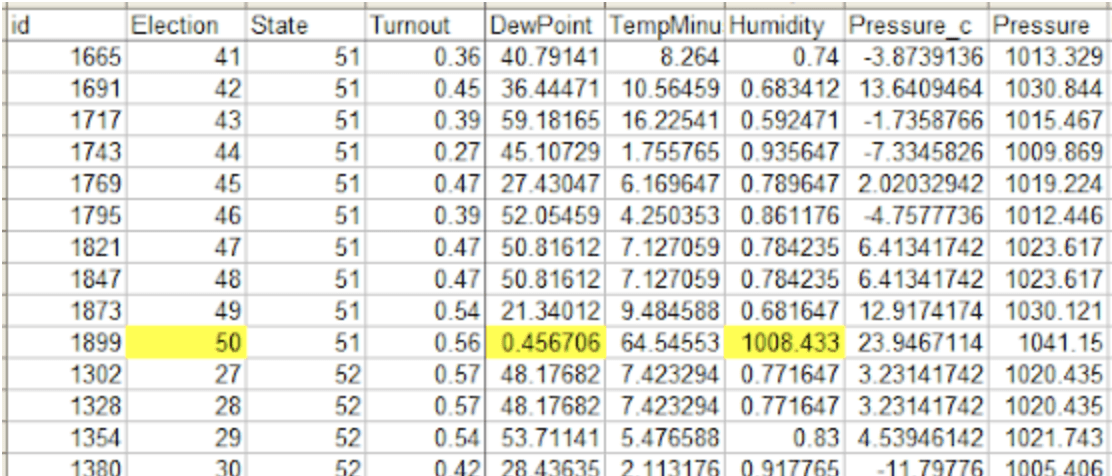
I found another problem, and it’s huge:
For “Election 50”, the Humidity and Dew Point data are completely borked (“relative humidity” values around 1000 instead of 0.6 etc; dew point 0.4–0.6 instead of a Fahrenheit temperature slightly below the measured temperature in the 50–60 range). When I remove that referendum from the results, I get the attached version of Figure 2. I can’t run their Stata models, but by my interpretation of the model coefficients from the R model that went into making Figure 2, the value for the windspeed * condition interaction goes from 0.545 (SE=0.120, p=0.000006) to 0.266 (SE=0.114, p=0.02).
So it seems to me that a very big part of the effect, for the Swiss results anyway, is being driven by this data error in the covariates.
And then he posted a blog with further details, along with a link to some other criticisms from Erik Gahner Larsen.
The big question
Why do junk science and sloppy data handling so often seem together? We’ve seen this a lot, for example the ovulation-and-voting and ovulation-and-clothing papers that used the wrong dates for peak fertility, the Excel error paper in economics, the gremlins paper in environmental economics, the analysis of air pollution in China, the collected work of Brian Wansink, . . . .
What’s going on? My hypothesis is as follows. There are lots of dead ends in science, including some bad ideas and some good ideas that just don’t work out. What makes something junk science is not just that it’s studying an effect that’s too small to be detected with noisy data; it’s that the studies appear to succeed. It’s the misleading apparent success that’s turns a scientific dead end into junk science.
As we’ve been aware since the classic Simmons et al. paper from 2011, researchers can and do use researcher degrees of freedom to obtain apparent strong effects from data that could well be pure noise. This effort can be done on purpose (“p-hacking”) or without the researchers realizing it (“forking paths”), or through some mixture of the two.
The point is that, in this sort of junk science, it’s possible to get very impressive-looking results (such as Figure 2 in the above-linked article) from just about any data at all! What that means is that data quality doesn’t really matter.
If you’re studying a real effect, then you want to be really careful with your data: any noise you introduce, whether in measurement or through coding error, can be expected to attenuate your effect, making it harder to discover. When you’re doing real science you have a strong motivation to take accurate measurements and keep your data clean. Errors can still creep in, sometimes destroying a study, so I’m not saying it can’t happen. I’m just saying that the motivation is to get your data right.
In contrast, if you’re doing junk science, the data are not so relevant. You’ll get strong results one way or another. Indeed, there’s an advantage to not looking too closely at your data at first; that way if you don’t find the result you want, you can go through and clean things up until you reach success. I’m not saying the authors of the above-linked paper did any of that sort of thing on purpose; rather, what I’m saying is that they have no particular incentive to check their data, so from that standpoint maybe we shouldn’t be so surprised to see gross errors.
I find Andrew’s comments here sensible. One additional factor seems missing, though. The 4 authors of this article are at 4 of the most prestigious universities in the world. Is that just coincidence? Is this sloppiness the same sort we would find if we looked at articles by researchers are lesser places? One might expect the “cream of the crop” to exhibit better work habits than the typical researcher. If not, then what exactly is their prestige based upon? There is an additional dimension that should be addressed here – if this sloppiness occurs in the “best” places, is it more or less common than in lesser places? And, what are we to make of the answer to that question?
Dale,
I’m inclined to say “sloppy” practices lead, on average, to more statistically significant results. So “sloppy” research produces better outcomes in terms of citations, prestige journals, name recognition, etc. Now, on the other hand, that might be some factors that push in the other direction, but apart from those factors, I’d expect more non-reproducible research at bigger name schools.
Best,
Josh
This seems pretty consistent with Smaldino and McElreath’s conclusions about the effect of “effort” on publication output (see: https://royalsocietypublishing.org/doi/10.1098/rsos.160384).
It is like an inverted U. The least and most prestigious publications/schools/etc generate the least reliable info.
Prestige originally meant:
In real science you test *your hypothesis*, which means you have incentive to account for all sources of error/uncertainty. Ie, you do not want to see a significant deviation from what your model predicts.
Junk science is the bizarro version of this. You test a *null hypothesis*, which incentivizes accounting for the minimum allowable amount of uncertainty/error. Ie, you do want to see a significant deviation from the (strawman) null model.
The table which heads the day’s discussion has me puzzled. The yellow highlighting suggests something strange, as in the humidity and the dew point listed must be incorrect. But, I was unable to find the table in the article itself. Where is the table buried?
As a side note, Andrew mentions Simmons et al 2011 paper which I presume is
https://journals.sagepub.com/doi/full/10.1177/0956797611417632
“Our job as scientists is to discover truths about the world. We generate hypotheses, collect data, and examine whether or not the data are consistent with those hypotheses. Although we aspire to always be accurate, errors are inevitable.”
Of course, Simmons et al are deeply involved in the current Gino/Harvard law suit. My guess, given the usual 3-6 month lag, is that Andrew created this day’s blog before that issue hit the news.
The table is in the data file that the authors provided on OSF.
Dale,
Thanks for the info.
But while I was busy searching for more on the Gino/Harvard situation, I unexpectedly came across this regarding Harvard and body parts(!!)
https://www.theday.com/state/20230807/new-lawsuit-against-harvard-in-wake-of-body-part-trafficking/
and this more run-of-the-mill lawsuit against Harvard
https://en.wikipedia.org/wiki/Students_for_Fair_Admissions_v._Harvard#:~:text=In%202013%2C%20Students%20for%20Fair%20Admissions%20%28SFFA%29%20filed,against%20Asian%20Americans%20in%20favor%20of%20white%20applicants.
I wonder if tuition may be on the increase in the forthcoming years.
It seems there are other fundamental problems with the data here, but one common issue with studies using weather is that there is huge amount of dependence, which is often insufficiently accounted for. I don’t think this paper does anything to address this dependence, making it easy to get tiny p-values when nothing is happening.
Most serious efforts in this general area use some kind of cluster-robust standard errors. However, even these can yield invalid inference.
This is highlighted in this paper by Alicia Cooperman https://doi.org/10.1017/pan.2017.17, where the idea is to construct a reference distribution using historical weather data.
I came across her paper when we independently were doing something similar with the weather shocks we used to identify endogenous peer effects in this paper on COVID policies: https://www.pnas.org/doi/10.1073/pnas.2009522117. There our results for 3/4 outcomes hold up quite well when doing this kind of randomization inference.
Re: “Why do junk science and sloppy data handling so often seem together?” — I think Andrew is right, but some part of this relationship could just be selection. People are more likely to check studies that get lots of coverage, have crazy hypotheses, etc. When a boring study that no one pays attention to has sloppy analysis, no one bothers to look into it.
I really think this quote sums up my experience:
“any noise you introduce, whether in measurement or through coding error, can be expected to attenuate your effect”
I work with medium/large medical datasets. Sometimes, indexes get misaligned when combining and pre-processing these data. A 99.9999% sure sign that this has happened is that EVERY effect goes to zero.