10 thoughts on ““Another bad chart for you to criticize””
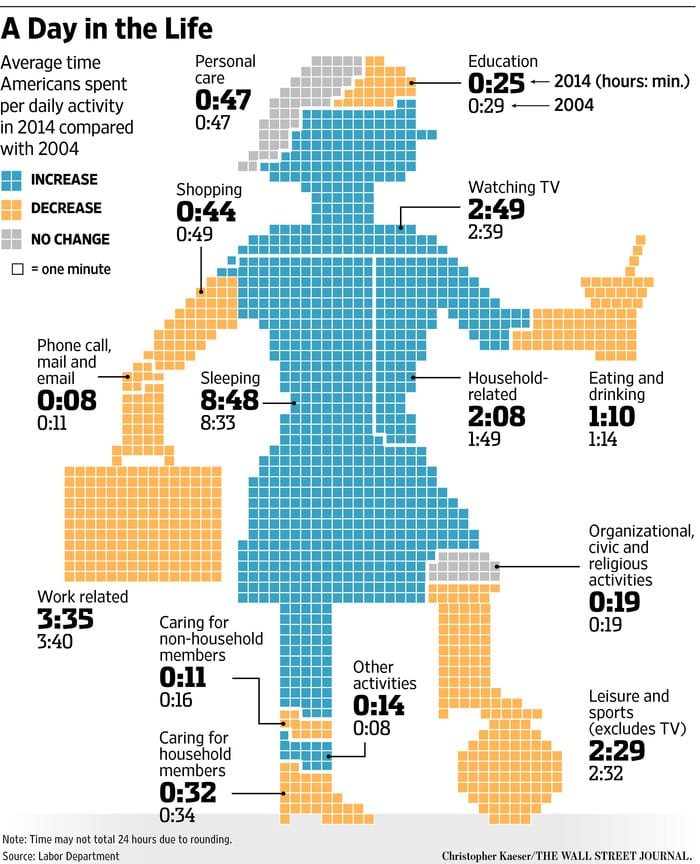
A backhanded compliment: The chart is sufficiently bizarre that I looked close at the numbers to see what information they were attempting to convey. (And why choose the knee for “Organizational, civic, and religious activities”? Why is “Watching TV” not assigned to the hindquarters? Questions abound re their mappings.) So I’m not sure what Big Picture I should be taking away from this chart but I did get the information provided.
PS Coming back to the chart, I have to admit that all I did on my first pass was note the major time sinks and the changes. I did not do a reality check on ‘minor hours’ and the details of how the hours sum to 24. As some note below, some of the numbers are a bit puzzling, e.g., only 8 minutes/day on email? To comment seriously on the chart, on a good chart the reader wouldn’t have to hunt for minor hours or how hours sum to 24.
PPS What’s our prior on how much time people should spend caring for others vs watching TV? How did people waste time before TV and was the (caring for others)-to-(wasting time) ratio higher then? (Did people waste as much of their time pre-TV? What activities did TV displace? That must be well-established.)
Do you really want a chart that better represents this data? Are you sure? Because the stupidity of this figure does at least keep us from noticing the fact that we spend about 4 times as many minutes watching TV as we do “caring for others”. Do we really want to be reminded of that about ourselves?
“Other activities” has grown from eight to 14 minutes daily due in part to the increased time we spend deciphering charts like this one on the Internets.
The Onion is (or used to be) known for silly infographics that mock the style of the (formerly) notorious infographics that were regularly featured in USA Today.
A backhanded compliment: The chart is sufficiently bizarre that I looked close at the numbers to see what information they were attempting to convey. (And why choose the knee for “Organizational, civic, and religious activities”? Why is “Watching TV” not assigned to the hindquarters? Questions abound re their mappings.) So I’m not sure what Big Picture I should be taking away from this chart but I did get the information provided.
Yes, this graph is awesome. It’s like a chart in a Robert Benchley short from the 1940s:
https://www.youtube.com/watch?t=134&v=G1yc-19z14s
The Benchley clip is great.
PS Coming back to the chart, I have to admit that all I did on my first pass was note the major time sinks and the changes. I did not do a reality check on ‘minor hours’ and the details of how the hours sum to 24. As some note below, some of the numbers are a bit puzzling, e.g., only 8 minutes/day on email? To comment seriously on the chart, on a good chart the reader wouldn’t have to hunt for minor hours or how hours sum to 24.
PPS What’s our prior on how much time people should spend caring for others vs watching TV? How did people waste time before TV and was the (caring for others)-to-(wasting time) ratio higher then? (Did people waste as much of their time pre-TV? What activities did TV displace? That must be well-established.)
Do you really want a chart that better represents this data? Are you sure? Because the stupidity of this figure does at least keep us from noticing the fact that we spend about 4 times as many minutes watching TV as we do “caring for others”. Do we really want to be reminded of that about ourselves?
The strangest part is the 8 minutes a day spent on email. Did none of the people surveyed have professional jobs?
Yeah, that one struck me as strange, too — all the more so since it’s actually mail, phone calls, *and* email combined.
“Other activities” has grown from eight to 14 minutes daily due in part to the increased time we spend deciphering charts like this one on the Internets.
Should that be “The Allium” rather than “The Onion”, since these are scientific criticisms? https://www.theallium.com/
Sean:
The Onion is (or used to be) known for silly infographics that mock the style of the (formerly) notorious infographics that were regularly featured in USA Today.
What tool did they use to create this chart?