Following up on this discussion from a few years ago, John Kastellec offers some practical advice for producing better graphs:
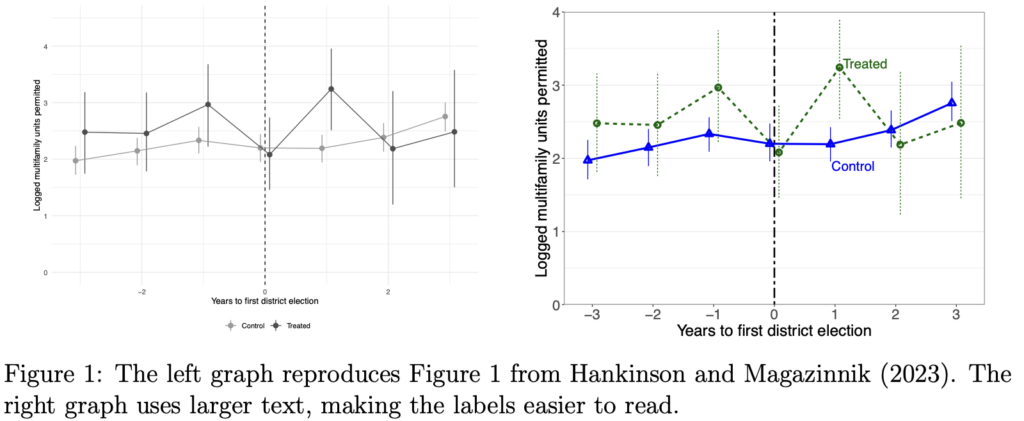
In this short paper I present a few practical tips for producing better published graphs. These include: making labels big enough to read; avoiding legends and labeling lines directly; using small multiple plots; and using different line types and shapes to draw distinctions.
I agree with these points. Well, not the last one. I much prefer using colors, rather than line types and shapes. Sometimes line types and shapes can work, but I recommend first using colors.
Also, I’d add the recommendation to give each graph a title or embed it in a figure with a caption. Remember, a picture plus a thousand words is better than two pictures or two thousand words. It’s a classic error to think that a graph should be self-explanatory.
In any case, I disagree with this statement from John:
These are suggestions designed for better published graphs; they are not generally applicable for scholars’ own visualizations in the course of their research workflow. Indeed, some of the basic problems arise because what works well as a default during the data exploration phase does not translate well to published graphs.
No no no no no!
The same attributes that make a graph more useful and readable by others will make it more useful and readable by you. You are the first audience for any graph. All too often I’ve seen people make ugly, unreadable default graphs, and this has inhibited their ability to learn from their data and models. Give your graphs titles, label those axes, use small multiples without making each plot too crowded, use colors effectively, etc etc . . . do it for yourself too!
OK, here’s a story for you. Many years ago I knew a couple who were moving and they needed to sell their apartment. To make it more sellable, they had all sorts of work done, fixing everything that was broken, getting new appliances, new floors, etc. It was wonderful! And they should’ve done it earlier, while they were still living there!
Oh, one more thing. I don’t like “comb plots,” which multiplex an x- or y-axis. Here’s an example from John’s paper:

I think a simple dot plot would be better, with a red dot and a blue dot on each row. That said, I appreciate that they listed the issues in decreasing order of frequency rather than alphabetically.
Overall I think that John’s article should be useful to many people. Even if you don’t agree with all the recommendations, it gives you something to think about.
For more on the topic, placing graphical displays in the context of statistical measurement, I recommend chapter 2 of Regression and Other Stories.
Remember what Tufte taught us: All graphs are comparisons.
I completely concur with your statement that what works for your audience also works for yourself – while I may not spend as much energy fixing visualizations while exploring the data, thinking about how to improve the visualization is part of the data exploration process. And if the visualization obscures the meaning, that is bad for me – not just my audience.
Regarding Kastellec’s paper, I have mixed feelings. It is always worth providing examples and emphasizing good practices (and I would note that a number of his examples illustrate exactly what Andrew prefers in using color rather than shapes to distinguish lines). But there is nothing new in the paper and Tufte has said such things more eloquently, in my opinion. The article is a great thing to hand out to students, but it isn’t clear to me that it belongs in a professional publication.
The final thought I have is Tufte’s close to his original book:
“What is to be sought in designs for the display of information is the clear portrayal of complexity. Not the complication of the simple; rather the task of the designer is to give visual access to the subtle and the difficult – that is,
the revelation of the complex.”
FWIW, I have not been able to publish the paper, as the reviewers agree with your assessment. (I would note the average political scientist is either not aware of Tufte, or, even if so, has no idea how to implement his basic suggestions.)
My point about line types is that, even today, many journals do not publish color graphs, so you sometimes end up with graphs that are unintelligible when viewed in grayscale (and hence why that problem does not exist at the data visualization stage.)
I am completely out of touch with the academic political science world. However, many years ago I applied for an academic political science job. My mentor for the application gave me a box of books to read so I could appear to know some modern political science. One of those books was Tufte’s Political Control of the Economy, Princeton University Press, 1978. It was awarded the APSA’s Gladys M. Kammerer Award for the best book in the field of U.S. national policy.
Political scientists may not always be familiar with Tufte’s work on info display. But he was a real political scientist.
Label size defaults are in my opinion way too small in every statistical software I am familiar with. This is really bad for projected presentations (papers are somewhat more arguable, since a reader in the PDF can zoom in if they need it).
I have close to the same recommended font sizes as John for my defaults (both python and ggplot2), https://crimede-coder.com/news/Post005.
The use of colors should be informed by the fact that many readers will suffer from some form of color blindness. The most common ones are red-green and yellow-blue, in that order. Don’t use two colors from the same pair. Choose one from (red, green) and (blue, yellow), for example (yellow is usually too light to use on a white background).
Luminosity is also a good cue. Many or most color-blind people are sensitive to luminosity (but not all are). Color saturation is another useful cue but most people can’t distinguish too many different levels of saturation.
Line width is another good cue, as is line style. Also, color-blind readers may not be able to determine the color of thin lines. The larger the colored area, the better the chance its color can be recognized. I speak from personal experience.
No manner of differentiation can work for all readers, but the above should work for most.
I was about to post a similar comment. I am often unable to understand graphs with thin red and green lines.
The advice regarding color choice is sound and should be a default setting.
“yellow is usually too light to use on a white background”
This is then complicated by the fact that a lot of people like to use “dark mode” backgrounds, when viewing documents online. (I don’t… but the majority of my students do…)
For my aging brain, gaudy colors are a distraction, and I prefer graphs that work when printed in black and white, which means line types and muted colors.
While color can be an important component of good graphics, I always bear in mind Tufte’s admonition about using color: “Above all, do no harm.”
Sorry, the name didn’t come out right.
Large readable axis labels obviously. Setting the label on the ordinate in italics makes it instantly more readable. (A trick acquired drawing graphs on onion-skin paper with a Leroy lettering set … never mind when.)
Geoff:
Agreed. This is related to another point I emphasize, which is the importance of displaying multiple graphs on a page. Axis label defaults are small because the expectation is that the graph will take up the whole page. Once the axis labels are smaller, it’s natural to display the graph smaller.
We have some examples in this paper, where we show how, with large axis labels, we can make graphs that take up no more room than the tables they replace.
Thanks for the link.
And all axis label in upper-case letters please.
Alternatively, see https://www.europeanurology.com/article/S0302-2838(20)30316-X/fulltext
Andrew V.:
I agree with most of that article, and I appreciate that they give good examples and clear explanations of the problems with the graphs they don’t like.
One place I disagree with them is in their recommendation, “Only include figures if they importantly improve the reader’s ability to understand the study findings.” They give an example where there’s a graph and a table, and they say the graph gives no more information than the table. But in that case I’d prefer the graph! And, with care, the graph can be drawn to take up no more space than the original table. We discuss this general point in a paper from 2002.
Don’t knock default plots. See the discussion (and examples) in §33.3 of “Getting (more out of) Graphics”
(https://019bda6a-e305-3f69-9f6f-a4e8bf459bf7.share.connect.posit.cloud/differences-between-early-drafts-and-later-graphics.html)
Antony:
I’m not knocking default graphs. Defaults are great, and then we can move forward from that. Also, we can improve our defaults.
One default I don’t like is the default of one graph per page, something that’s a big problem with presentations and online documents where it’s hard to see more than one graph at a time and so it’s hard to make comparisons between graphs. I’d like to change people’s defaults so that the default is multiple graphs per page.
More generally, I want people, when creating and changing defaults, to think about comparisons. For example I think the multiplexed bar chart (what I call a “comb” plot) is a bad default; I think dot plots and line plots are better for displaying comparisons.
Andrew:
Comparisons with what you expect are important, especially in EDA. Everyone should think about what they expect before looking at plots.
The default of one graph per page is not ideal (and don’t get me started on RStudio’s plot pane), but how could multiple graphs per page be a default? Displaying more than one graph on a printed page is often wise in presentations. More interesting is what happens in EDA, where you need lots of graphics, mostly in their own windows, so that you can shuffle them, reorder them, resize them and and and… There has been little discussion of how to do that effectively and what supporting software tools are needed. As you imply, the standard should be to work with lots of graphics, not just one.
Antony:
1. Regarding defaults, one starting point would be a default of plots being a 2×2 grid; in R base graphics, for example, the default could be par(mfrow=c(2,2), mar=c(3,3,1,1), mgp=c(1.7,0.5,0), tck=-.01). So if you just start making plots, it will show four graphs at a time. Then as a user you can change the layout if you want.
2. I agree that dynamic graphics as part of workflow is a separate and interesting question, something that I’ve not thought about much.
Your suggestion below sounds like Procrustean Graphics or, in more modern terms, Model T Graphics. Which name do you prefer for it?
Antony:
Which suggestion are you referring to?
All graphics forced into the same initial size (Procrustes) or “you can have any size for your graphics you like, as long as it’s the default” (Model T).
Antony,
I think that defaults are both useful and inevitable. The default should not represent a restriction on what you can do; it’s just a starting point. Except in some cases such as a class assignment (where you want students to stick with the default so they can learn what it can be do) or a document that is prepared in a uniform style.
I have to admit that I don’t find “all graphs are comparisons” all that illuminating: I would have thought that *all* information is a comparison, in that it’s difficult to conceive of any fact conveying information unless it is placed in relation to other facts, but maybe I am missing something relating to older theories, or implied theories, of what folk used to teach concerning graphs?
Anon:
A traditional model is “Graphs are look-up tables,” in which the point of a graph if is to convey a bunch of numerical values. Traditional evaluations of graphical perception ask how accurately the reader of a graph can estimate the numbers in it. “Graphs are comparisons” is a different model of the purpose of graphics and what can get out of them.
Thanks for clarifying!
“I think a simple dot plot would be better.”
I, myself, find these better than “comb plots”, but when I’ve tried them with audiences (mostly in the business and education sectors) there always is some confusion and push back. I wonder if they have just forced themselves to get used to “comb plots”, so there’s more cognitive load and they resist it? It’s the white space that seems to throw people off.
Andy:
Yeah, I think it’s always important when presenting a graph to also explain it in words. (A graph plus 1000 words is better than two graphs or 2000 words.) The dot plot needs explaining to make it clear. But I think that the comb plot (and, for that matter, the pie chart or the simple bar chart) needs explaining too. I have a feeling that lots of people see a comb plot and think they’re following it, but they’re not, in that they’re not extracting relevant comparisons from it.
I wonder if Tufte knew of…
“Ascending into the Realm of Japanese Charts
A prewar collection crosses the Pacific.
RJ Andrews
Apr 02, 2026
…
“At a certain point, I was no longer finding books. I was discovering a world: chart-rich, prewar, often beautiful, and in some cases likely never before shelved in this hemisphere.
…
“Soon it became clear that these were not isolated curiosities. They belonged to a coordinated 1920s campaign to make statistical thinking public.
Here’s what it’s like viewing charts on the National Diet Library’s digital archive. Notice that brilliant chart, and then see how it is one of dozens in the volume.
…
https://www.chartography.net/p/ascending-into-the-realm-of-japanese
I would say a big challenge lies with the defined “styles” of many journals. Lots of them are antiquated (to put it nicely).
For example, I 100% agree with the following advice:
“Also, I’d add the recommendation to give each graph a title or embed it in a figure with a caption.”
However, the primary journal in my field refuses to allow the captioning/titling of sub-figures. The best laid plans of mice and men aft go awry.