In 2021, I taught Survey Research Methods at NYU (thank you to Daphna Harel for that opportunity !). We used the textbook by Groves et al. (in this blog series here). It’s got this helpful image, which even Twitter liked:
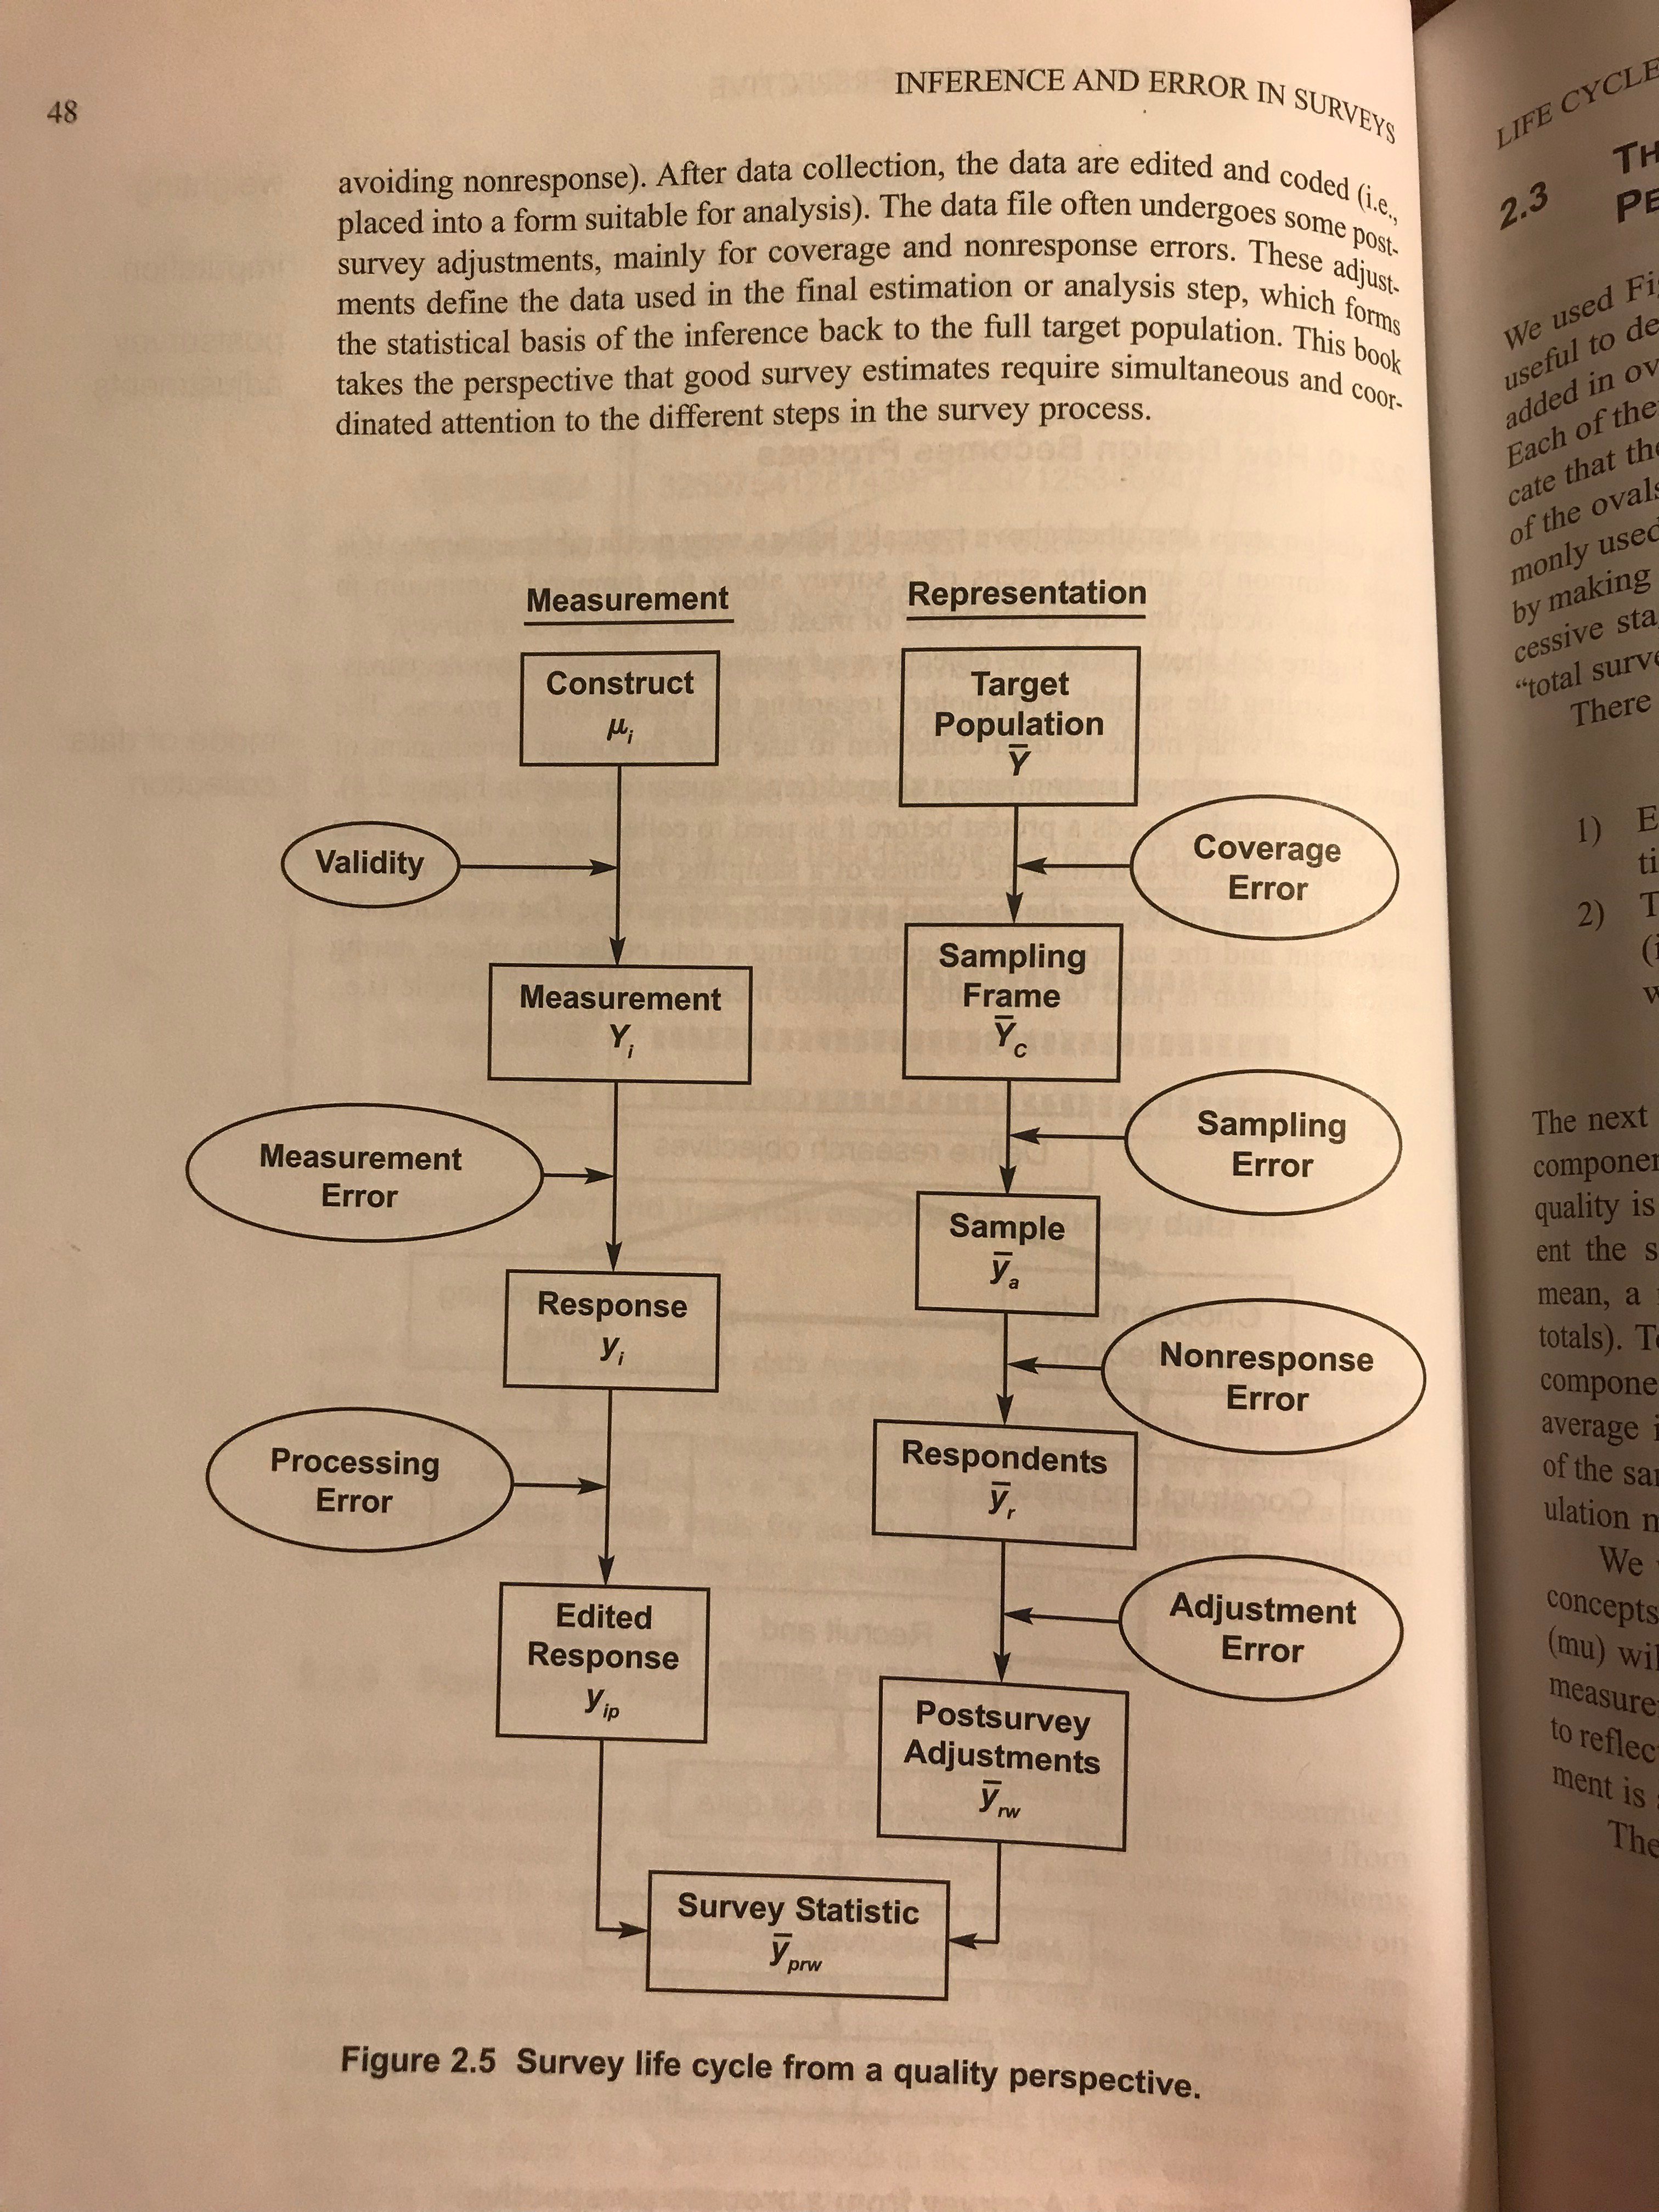
I like this image because it reminds us to consider all the sources of error, even if that’s a bit stressful. For example, in considering different survey modes (face-to-face vs phone vs mail), Groves et al. p.151 compares response rate, cost, coverage, and measurement error. Meng 2018 “Statistical Paradises and Paradoxes” (in this blog series here) reminds us that big administrative datasets may have large coverage and sample size, but a smaller higher quality dataset could be better in important ways. In a talk Meng asks if an 80% (or even 99%) non-random sample is better than a 5% random sample.
Consider two data sources, maybe from different survey modes:
- 100% coverage, i.e. your sampling frame is the entire population. But response probability P[R = 1 | Y] differs a lot by Y, a variable of interest. These differences may not decrease with multiple contact attempts. They could in fact get worse.
- Only 5% coverage, i.e. you only can contact 5% of the population and ask them to respond to your survey, so P[R = 1] <= 5%. But suppose response probability P[R = 1 | Y] is roughly constant across Y. Here R = 1 includes both coverage and response.
(To keep this comparison simple, I left out discussion of auxiliary data X, which we’ve discussed a lot in this blog series.) The first data source has no coverage error, but lots of nonresponse error. The second data source has lots of coverage error, but it doesn’t ultimately result in bias. These are both cartoon examples, the real world is usually a bit more subtle.
Andrew advocates (2011, 2018, and 2025) throwing both surveys into one model with:
indicators for the individual surveys (varying intercepts, maybe varying slopes too)
In practice I think this is harder than it sounds, with big models accounting for lots of auxiliary X and surveys that differ quite a lot in their coverage and nonresponse mechanisms. It could be better to focus on understanding one survey’s mechanisms really well ? But it could also be better to combine data sources.
I don’t work with survey data, but it seems like if you are going to throw both surveys into one model then you would need to model the response probability in the first survey. Is that what you are suggesting?
Jd:
No, you don’t need to model response probability, you just need to condition on enough X variables and poststratify. See my linked posts!
hmmm, it sounded like Shira’s example required modeling selection.
Jd:
Fair enough. In practice different surveys ask different questions, or ask the questions in different ways, so it’s not so trivial to adjust for a common set of background variables.
Thanks, jd ! I wrote that in the first survey P[R = 1 | Y] differs a lot by Y. I don’t mean that we model P[R = 1 | Y], which usually you couldn’t because Y is only observed for respondents R = 1.
As Andrew says, we often have some auxiliary data X in the population (for R = 0 and R = 1). We often hope we have enough X such that R is independent of Y conditional on X. Then you can model P[R = 1 | X] if you want to use e.g. inverse response probability methods. Or you can take Andrew’s approach and model P[Y | X, R = 1] and score that on the population, which he calls “MRP”.
And yes as Andrew says if we are using the same X for both surveys, we need to line up various question wordings that might differ across them.
Andrew
shira brings up a more basic issue. Surveys, in 2025, face different conditions than described in classical methodology and this requires adaptation. Access to administrative data, the use of AI and LLM technologies, diminishing response rates bring up opportunities and challenges.
One approach that seems ready to be adapted to media related snowball like surveys is response driven surveys (RDS). Looksit has not picked up? Do you agree? If so, why is that??
a lot can go wrong in RDS, its not so easy. there are a few papers out there reviewing lessons learned in rolling out rds operations
thanks, Ron and mjt ! I’ve not yet used snowball sampling myself. My impression is that it is most useful for finding hard to reach populations, where someone in that population is likely to know others in that population.
As Pew warns:
https://www.pewresearch.org/short-reads/2023/05/08/when-surveying-small-populations-some-approaches-are-more-inclusive-than-others/
So if your Y variable of interest is something about social connections, you would expect to see response probability P[R = 1 | Y] differ a lot by Y, causing bias in your analysis unless your auxiliary data X is really spectacular. But maybe for other Y variables this is much less severe.