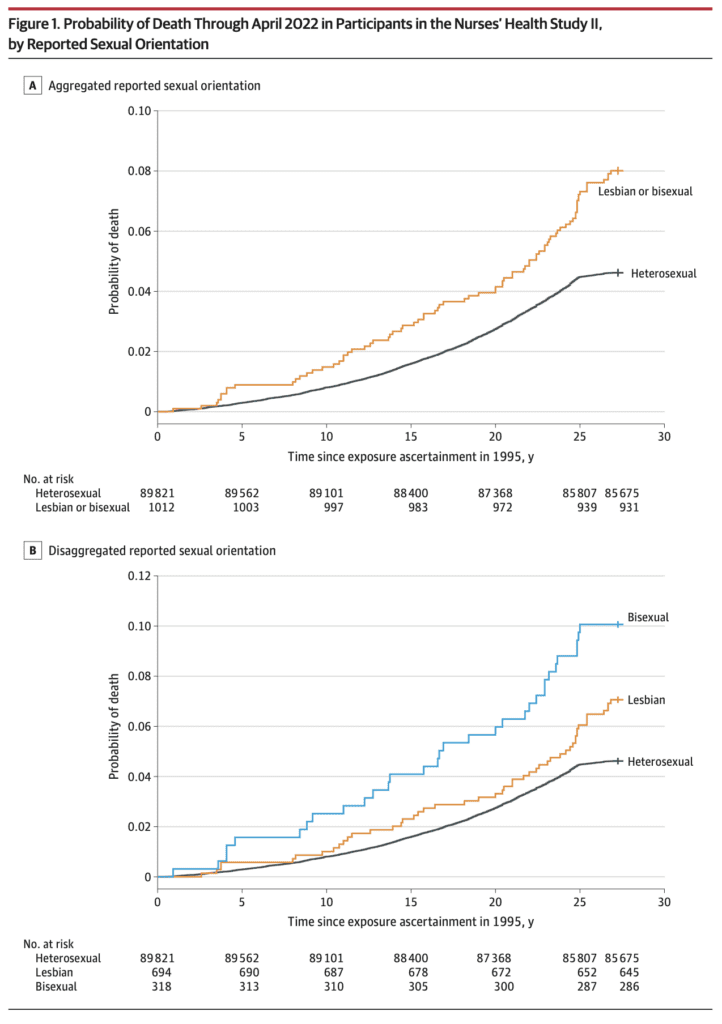
Last month we discussed a JAMA paper that included the above misleading graph and made strong claims that were not supported by data.
Since then, these strong claims have received further publicity. Here’s a news article uncritically reporting those claims, including this quote from one of the authors of the study:
One of the advantages of this study is that we were able to separate out bisexual and lesbian participants, because we had enough people and we followed them for long enough that we can actually look at those risks separately, which no other U.S. study has been able to do.
This is kind of a subtle issue, and it would be hard to expect a news reporter to do pushback on such a claim, but, no, a comparison of the 49 deaths among lesbians and 32 deaths among bisexuals in that study is noisy enough that differences between the two groups can be explainable by chance alone. Even their own reported comparisons did not reach a conventional level of statistical significance, and that doesn’t even get into the other statistical issues discussed above. See the above-linked post for details on that point.
Those survival graphs are so misleading—they make the evidence look much stronger than it is. It would’ve been the job of the statistician on the project to push back against these sort of noise-mining claims. I’m not saying the differences between the groups are zero, just that the data are sparse enough that, even aside from all other issues, they are consistent with underlying differences that could go either way.
It’s frustrating that the news media coverage of this is so unskeptical. See here, here, and here for more examples. JAMA’s prestige has to be part of the problem, and I think another problem is that seductively appealing graph (for people who don’t look at it too carefully). From one of those reports:
“These findings may underestimate the true disparity in the general U.S. population,” the authors wrote, adding that the study population “is a sample of racially homogeneous female nurses with high health literacy and socioeconomic status, predisposing them to longer and healthier lives than the general public.”
“We think that that means that our estimate is, unfortunately, conservative,” McKetta noted.
This sort of thing is frustrating, and we see it so often: researchers see some pattern in noisy data and then they expect that the true effect is even larger. All things are possible, but experience and Bayesian logic goes the other way.
I’d like to think that continuing coverage of the replication crisis in science would make this issue clearer to people, but I fear that most researchers see the replication crisis as something that happens to other people, not to them.
This is another reason I prefer the neutral term “forking paths” to the accusatory-sounding “p-hacking,” which sounds like a bad thing that people do. Honesty and transparency are not enough; making statistical errors doesn’t mean you’re a bad person, and sincere and qualified researchers can make statistical mistakes.
There’s also this echo chamber thing, where if you are asked to talk about a topic multiple times, and you never get any pushback, it’s natural to make stronger and stronger claims, going far beyond the data that were used to justify those claims in the first place. We’ve seen this with the sleep guy, the Stanford medical school professor, the glamorous business school professor, and many others. When there’s no pushback, it’s all too easy to slip from experimental data to strong claims to pure speculation.
Again, I’m not trying to disparage the study of health disparities. Indeed, it is because the topic is important that I’m bothered when researchers make avoidable mistakes when studying it.
“tl;dr – My math and an online death simulator predict that about 8% of all women in the sample should have died, and in the actual sample it is 5% for heterosexual nurses and 8% for LGB nurses.”
https://statmodeling.stat.columbia.edu/2024/04/30/disparities-in-mortality-by-sexual-orientation-in-a-large-prospective-jama-paper/#comment-2371090
I still lean towards measurement issues leading them to miss the deaths of straight women.
And I still don’t forgive them for the time-dimension on their x-axis (time since study started), which should, of course, be age.
Wait what? Unless the distribution of ages is almost exactly the same between the groups, the curves would be *expected* to diverge based on the mix of ages at ascertainment (age in 1995).
I agree we would expect the current curves to diverge because of age imbalance. They should have used age to show that wasn’t what was driving this (either as x-axis or adjusting for age with a smooth function of some sort). But that’s NOT the worst thing here.
First off, disregard +25 years because those heterosexual nurses did NOT stop dying, they stopped being measured (they couldn’t link them to death records). So that leaves most of the left part of the graph as a starting point.
Then ask yourself – how many women of approximately these age-cohorts (provided in the paper from baseline) SHOULD have died, just by probability, over the next 25 years. The answer I got was about 8% – which is exactly the rate at which the heavy-surveillance non-heterosexual group died at. BUT – the heterosexual women just did NOT die enough even before 25+.
So you are left with two choices: 1) heterosexual deaths were missed (different surveillance system by papers own admission); or 2) being a heterosexual nurse is an incredibly effective treatment against all-cause mortality.
Maybe the paper should be “Heterosexual nurses live improbably long lives!”, but I think they just missed a bunch of deaths of heterosexual women because, unlike the lesbian/bisexual women, they didn’t have an external surveillance system for them. The paper does not provide much details on how it matched heterosexual nurses to death certificates, but we know from 25+ they do better at it for non-heterosexual women.
This kind of thing was exactly the kind of thing that I spent a good couple weeks tracing down in my cancer mortality model thinking there were bugs in the model because my model diverged RADICALLY from standard K-M curve analysis done by others. Finally I realized the “standard” method of using Kaplan-Meier curves on heterogenous cohorts was just doing a terrible job and my bayesian model was doing the right thing.
https://pubmed.ncbi.nlm.nih.gov/34611608/
The point was so confusing to my colleagues that we spent several graphs trying to explain it.
In the cancer data, if you assume that people stop coming to followup appts largely because they die and you can’t get ahold of the grieving family to finalize the study data, then you see precisely the divergence I saw between K-M and Bayes (determined by simulation).
Is this to some degree a “we find what we expect to find” thing? That is, it’s expected that they would have worse health outcomes so the statistics aren’t scrutinized so heavily as if the result had been opposite of expectations?
I also don’t understand why a generally healthy/high health literacy/high socioeconomic status sample would be expected to mean a smaller comparative effect. Longer lifespans in general, sure, but why a smaller *comparative* gap? I would think that expectation would rely on a hypothesis of what the mechanism is. (If it’s discrimination based, the effect might be smaller, yeah; but if it’s behavioral, it might be larger in a high health literacy group with a lower baseline rate of unhealthy behaviors like smoking etc.)
f anything you could argue the opposite (i.e. pregnancy is riskier for low health literacy/low socioeconomic status women,
In previous ‘longevity’ comparisons, where left handers seemed to ‘die young’, a numbers of commentators pointed out that left-handers are a recent (ie younger) group, having been forced in school to act as right-handers. So it was not possible for left handers (or other emerging groups, like women physicians) to ‘die old’ like the rest of their peers.
I wonder if there is a similar phenomenon (i.e. willingness to report orientation) at play here?
If there is a cohort effect, is it even just willingness to report? This is lumping bisexual in with lesbian, and there is reason to believe that the incidence of bisexuality isn’t fixed over time (supposedly most of the Roman Empire upper class male population was bisexual – IIRC to the point that Emperor Claudius being exclusively heterosexual was considered worthy of remark, though I don’t remember the source for that detail so it could be wrong).
There might actually be more bisexual 30 year olds than 70 year olds, not just a higher proportion willing to report.
Yes, the consulting bio-statistician was missing in action.
David Cox warned about these poorly designed studies in the biomedical field
https://www.youtube.com/watch?v=xRik3vOKLcU&t=1197s
https://www.youtube.com/watch?v=lq8DrgkZlYE
The critical social justice (woke) movement is stoking a lot of this. Read Chapter 11 of the Unprotected Class. But it transcends class, e.g. similar critiques from socialist Norman Finkelstein and UK leftist Andrew Doyle – both high integrity people.
I meant it transcends Left vs Right, no class. Sorry
You state “Even their own reported comparisons did not reach a conventional level of statistical significance, and that doesn’t even get into the other statistical issues discussed above.” Perhaps this is one of the cases where requiring p <= 0.05 for publication would have led the reviewers to make the correct decision. Is there an objective and reasonably easily assessed rule which could do the same job, if traditional statistical significance is no longer to be used as a gatekeeper?
I would respond that no, there is no “reasonably easily assessed rule which could do the same job.” For that matter, I don’t think we should be looking for something “to do the same job” if that job is to draw a bright line between research that is deemed “worthy” and that which is not. Given all the myriad subtleties about data and modeling that are discussed on this blog and elsewhere, maybe it is time to give up on the idea that there is a simple way to decide what research should be published. As Andrew often says, “statistics is hard.”
Ag:
What Dale said. In this particular example, a “p less than 0.05” threshold could’ve worked—or it could’ve inspired the authors to just try a few more things with the data to reach the threshold. In other settings, the p-value is greater than 0.05 and people make the mistake of treating this as evidence for a null effect; recall the ORBITA atory: https://stat.columbia.edu/~gelman/research/published/Stents_published.pdf
I am glad this topic came back, because I kept thinking about it. For me it is a showcase of an analysis driven by the new DAG orthodoxy, which states that before you do anything, you need to draw a DAG, decide which are the confounders, which are the mediators, then choose the right set of dependent variables (though it seems, if you apply the theory, you can get several sets of right variables). In this case the authors state:
“We chose not to further control for other health-related variables that vary in distribution across sexual orientation (eg, diet, smoking, alcohol use) because these are likely on the mediating pathway between LGB orientation and mortality. Therefore, controlling for these variables would be inappropriate because they are not plausible causes of both sexual orientation and mortality (ie, confounders) and their inclusion in the model would likely attenuate disparities between sexual orientation and mortality. “
I’ve recently had a first course in the DAG-style of causal inference applied in epidemiology, so I now understand where this comes from. Before I had the course, I would have said without blinking that you need to adjust for smoking (and diet and alcohol-use), as possible confounders. Well, in the DAG-dogma, you can’t anymore, and this really puzzles me. I get that smoking is considered to be mediator, so if you adjust for smoking, you estimate the direct effect not mediated through the smoking. Even if smoking is determined by sexual orientation, isn’t this direct effect the possible link that we are interested in? Then is it even true that smoking and alcohol and diet are determined by sexual orientation? I have the feeling their DAG is a subjective construction with an ideological bent – despite the claim that DAGs are supposed to be the realm of ultimate objectivity. I am frankly confused. I am no researcher, I am a “footsoldier” statistician, and I try to do things right. I have plenty other complains about the DAG approach to statistics, but I will keep it short for now. Signed “Bewildered”.
DAGs are very much not intended to the the “realm of ultimate objectivity”; they are the opposite, an explicit description of the investigators assumptions (which are subjective) about the causal structure of the question at hand. Or, as you put it, a “subjective construction with an ideological bent”. Your DAG for this problem would be different than theirs, and therefore you would do a different analysis. A benefit of the DAG is that it makes it clear where you disagree because you made different assumptions.
Indeed. One cannot make a causal omelette without breaking the causal eggs.
(Their assumption that “diet, smoking, alcohol use are likely on the mediating pathway between LGB orientation and mortality” is of course a quite strong one. One can easily imagine a different causality chain.)