tl;dr. People are slagging on the Fivethirtyeight election forecast because it’s at 50/50, but that’s roughly where you’re supposed to be if don’t know what might happen.
Last week I posted something, “The election is coming: What forecasts should we trust?,” discussing the incentives of different election forecasters.
Political actors and journalists have been forecasting elections for a long time. Oddsmaker and TV personality Jimmy the Greek shared some good stories about election predictions in his entertaining autobiography from 1975. In 1983, political scientist Steven Rosenstone in published an excellent book on forecasting presidential elections; this came around the same time as work by Douglas Hibbs, James Campbell, and others. Gary King and I made use of this work when constructing a hierarchical model to forecast the 1992 election for our paper, Why are American Presidential election campaign polls so variable when votes are so predictable.
Those predictions were based on economic and political trends—what we often vaguely call “fundamentals”—along with some modeling of the correlation of uncertainty across states. One issue with this sort of forecast is sometimes you can see problems even before the election happens. We discussed one such example in chapter 6 of Bayesian Data Analysis: our 1992 model gave Bill Clinton an implausibly high chance of winning Texas and some other southern states. We could track that down to a term in our model that gave a home-region benefit for candidates from the south, which did not work so well in the newly-polarized political environment starting with that Clinton campaign. The general point here is that we knew what went into the forecast. In the words of economist Rajiv Sethi, “statistical models perform well only when the past is a reasonably good guide to the future. Models are built and calibrated based on historical data, under the assumption that the data generating process has not shifted dramatically. They run into real trouble when we enter uncharted waters.”
The presidential elections of 1984, 1988, 1992, and 1996 were not particularly close, and election forecasting was more of an academic than a journalistic pursuit. After the very narrowly-decided 2000 election (only 30,000 more Floridians voted for Gore than for Bush, and of course the count in the tabulated votes was even closer), election forecasting became much more of general interest, and this has continued in the many close elections since then.
It’s also pretty clear that, if you want to have a sense of who will win the upcoming election in particular, rather than in understanding the factors that can determine the election outcome, it makes sense to look at the polls.
In the first decade of the 2000s, Real Clear Politics and some other media organizations produced polling averages, then in 2008 Nate Silver put together a state-by-state polling average at fivethirtyeight.com and various other organizations did the same.
And once you start on the path of poll aggregation, you get challenges: which polls to include, how fast to change your average when new polls come, how to adjudicate disagreements between state and national polls, how to adjust for expected artifacts such as the convention bounce, how to combine polls from different organizations that use different survey methods, how to account for nonsampling error . . . all this pushes us away from simple weights and moving averages toward probability modeling of uncertainty. There was some academic work in the early 2010s on the topic by Drew Linzer and by Kari Lock and me, and lots more can be done.
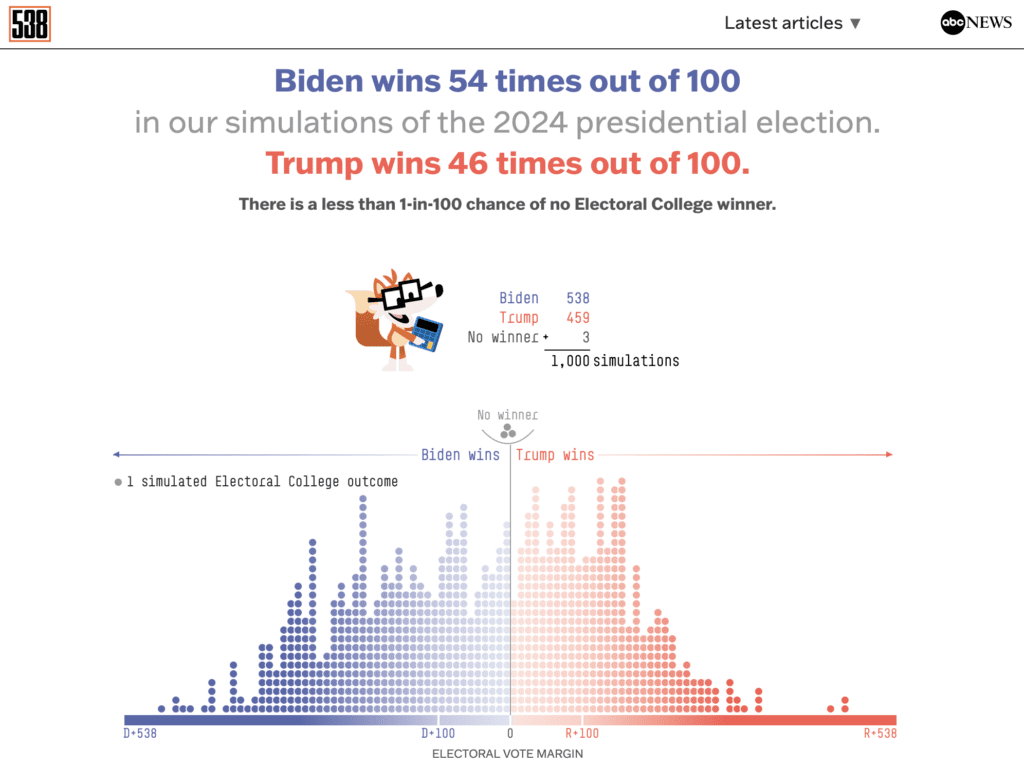
This year, the Fivethirtyeight website (now part of ABC News) and the Economist magazine report election forecasts that combine information from state polls, national polls, past election patterns, and whatever else the forecasters want to thrown in. I was involved in creating both these models, but they’re different in many details, and they’re run by different people, and they give different results.
Here’s Fivethirtyeight:
And here’s the Economist:

They disagree! One says the election is even odds, the other gives the Republicans a 3/4 chance of winning. The two polls are based on the same information, but they use that information in different ways.
Why do they differ? If you go to Slate magazine, you’ll see this misleading headline:

(no, a 54% chance of winning should not be summarized as “Biden will win”), which takes you to this news article subtitled, “FiveThirtyEight’s dead-heat prediction will self-destruct in roughly two months,” which is also misleading, because the whole point of the forecast is that it says that we don’t know what will happen in two months. That’s the whole point of a 50-50 forecast; it expresses ignorance!
This is not to say that I think the Fivethirtyeight forecast is correct; the forecast with which I’ve worked most recently is the Economist’s, which as noted above gives Biden only a 1/4 chance of winning.
The polls themselves are currently favoring the Republicans. Here’s the Fivethirtyeight poll summary:

And here’s the Economist’s:

0.427/(0.427+0.401) = 0.516, and 0.463/(0.463+0.439) = 0.513, so, yeah, the poll averages are essentially the same. It’s a narrow Republican lead, but based on past state-by-state election results, the Democrats are anticipated to need a bit more than half the national vote to have an even shot at the electoral college, which is why this is considered a solid lead for Trump.
Why is Fivethirtyeight giving the Democrats 50-50 odds even though they’re down in the polls and on the wrong side of the electoral college map? The Slate article says, “Biden is an incumbent overseeing a growing economy, which should mean he’d be sailing smoothly to reelection. But he’s not. And other [election forecasters] appear to be weighting fundamentals less heavily, which means they put more importance on polls, in which Biden is (unambiguously) losing.”
This description is fine for what it is. I think we can also benefit from thinking about the problem from a statistical modeling perspective.
The key question is how to connect three things:
A. The current state of the polls,
B. The state of the polls just before the election,
C. The election outcome.
If you simply take the poll aggregation as a forecast, you’re implicitly assuming that A = B = C. But we know that this is not the case. A is not the same as B (polls can move during the campaign) and B is not the same as C (polls can be off, even right before the election). To allow for A!=B and B!=C, you need to broaden your forecast (and also shift it, if you have some sense of where things are going).
Now look again at those Fivethirtyeight and Economist forecasts above. Forget about the probabilities and look at the wide displayed distributions of possible electoral college outcomes. There’s a lot of uncertainty!
Back in 2016, some people were criticizing Fivethirtyeight for being too cautious in its forecast, giving Clinton a 2/3 chance of winning even though she was consistently ahead in the polls!—see here for an embarrassing-in-retrospect election-eve critique of Fivethirtyeight. The critic didn’t get the point that the polls could be off!
To return to the 2024 forecasts, that Slate article continues, “FiveThirtyEight’s model will get less favorable to Biden as Election Day approaches and it gradually weighs fundamentals less and less heavily.” But that’s not right! If the polls stay where they are as Election Day approaches, then, yes, the forecast will become less favorable to Biden. But, remember, A!=B. The polls might change between now and then.
How much might the polls change? How to model this?
It depends on what you use as standard of comparison. Recent general elections for president have been very stable in public opinion, and even more so after adjusting for differential nonresponse. Go back a few decades, though, and it’s another story. Jimmy Carter was up 30 points in the polls in 1976 and barely beat Gerald Ford on election day. In 1988, Mike Dukakis was up by a lot over George H. W. Bush but ended up losing decisively.
To put it another way, put yourself back in time to when Dukakis was polling at 52% of the two-party vote. Would you have wanted to give him a 75% chance of winning? I don’t think so. So, when we at the Economist are giving Trump a 75% chance of winning, a large part of this is an implicit assumption that the polls won’t be swingin now like they were in 88.
Fivethirtyeight is giving a relatively low weight to the polls. Another way to say it is that they’re assigning a high uncertainty to future poll swings. They’re saying that this year the polls could move like they did in 1988.
Is that a reasonable assumption? I don’t know. We’re now in a much more politically polarized era than 1976 or 1988, so arguably there’s a lot less room for the polls to swing. On the other hand, when making a forecast there’s an argument for including the possibility of unexpected events. By giving a high variance to potential poll swings, the Fivethirtyeight forecast is keeping the probability closer to 50/50, which could be considered a safe choice.
The Slate article quotes political scientist David Broockman as saying, “historically the early polls aren’t super predictive. But that’s because people don’t know the candidates yet. Hard to imagine people not knowing how they feel about these two!” Fair enough, and indeed our Economist forecast is allowing less in the way of potential polling swings between now and the election. That’s a basic tradeoff in forecasting: we’re able to make a stronger statement (giving the Republicans a 75% rather than 50% chance of winning), but at the cost of leaving us vulnerable to large poll swings.
Every assumption we make is a hostage to fortune, but there’s no way to forecast without making assumptions. Which is kinda the point of the above post. Converting a straight-up poll aggregation into a forecast is a clean procedure, but if you want to interpret that as saying anything about the election to come, it corresponds implicitly to the strong assumption that A=B=C above.
Again this is not to say that either the Fivethirtyeight forecast of 50% win probability or the Economist forecast of 75% is “correct”; they’re just making different assumptions about possible polling swings, and it happens that Fivethirtyeight this year is in a similar position as they were in 2016, being less confident in the polls compared to the forecasts from many pundits.
P.S. I also recommend this post (also linked above) by Rajiv Sethi, discussing the variation in prices in an election prediction market.
Related to Sethi’s point is that any statistical forecast does two different things: it’s a data summary and it’s a forecast of a future outcome. In its role as data summary, you want the forecast to be transparent, so we can understand the relation between the data that come in and the predictions that come out. But the flip side of this is that there will always be information not included in the model. This came up in 2016 and 2020 as well. How to think about the first female candidate, how to think about third parties, how to think about large numbers of mail-in votes, how to think about past polling errors, how to think about surprising results in special elections, how to think about a candidate who’s a convicted felon, how to think about a candidate who has evident difficulties going about his job, etc etc.
A tempting solution is to just ignore the data-based forecasts and just go with the prediction market, but that’s a form of circular reasoning: The prediction markets are informed by economic conditions and by the latest polls, but the latest polls are noisy, which motivates some amount of poll aggregation, which then raises the question of how exactly to aggregate, which then motivates forecasting models—and there we are! So no easy answers.
P.S. See here for more (if you’re not already tired of the topic).
Nate Silver’s new version, sharing a very recent common ancestor with 538, gives 70/30 Trump odds, a bit closer to the Economist model. I think the difference from the current 538 mostly comes from different treatment of the fundamentals, since the poll aggregation is almost identical to the other two models.
Of course, as Silver points out, the model only includes factors that are uniquely important in the current election as part of the general uncertainty. New factors that are currently known (primarily Biden’s limited capacity to run a campaign) can only be judged informally. What happens if (when?) he’s replaced is even further outside the models.
Michael:
Part of it is the fundamentals, and part of it is how much swing might be expected during the next few months. I’m guessing (without any particular inside knowledge) that the current Fivethirtyeight forecast has a higher uncertainty for that swing, as compared to the Economist’s model or Nate Silver’s model, and I’m further guessing that Fivethirtyeight is doing this as a way of playing it safe, saying that anything can happen, which is in the tradition of past Fivethirtyeight forecasts.
Another way of putting it is that the difference between 50% and 75% is dramatic, but it wouldn’t take much of a swing in polls to go from one to the other. Which is one reason why I think the Slate article was wrong to claim that they know how the forecast will change going forward.
But to Michael’s point, Nate’s model is actually the current iteration of the previous 538 models.
Today’s 538 model is not related to the “tradition” of 538 forecasts, it’s G Elliot Morris’s new model.
Anon:
I assume that the 2024 Fivethirtyeight forecasting procedure is similar to the 2020 Economist model, which Merlin and I helped Elliott to develop. I also assume that Nate’s 2024 forecasting procedure is similar to the 2020 Fivethirtyeight procedure, which I think was more of a series of adjustments than a Bayesian model. (This does not make Nate’s approach better or worse than ours; it’s just different. All these models are Bayesian in how they are interpreted, and none of them are fully Bayesian in how they are set up and fit.)
When I said that the 2024 Fivethirtyeight forecast is in the tradition of previous Fivethirtyeight forecasts, I didn’t mean it is similar in its construction or its details; I meant that it’s similar in having wider uncertainty than other public forecasts. The personnel of Fivethirtyeight have changed, but they appear to be continuing the tradition of making cautious forecasts that are closer to 50/50 compared to their competitors.
Aha- I hadn’t realized that the current 538 wasn’t descended from the old one. That makes the difference from Nate’s less puzzling.
At any rate all the models are likely to need a reset soon.
Andrew- That makes sense.
Still, the value of a model depends both on it being well-calibrated and on its ability to make informative predictions. Nate has shown that his model is fairly well-calibrated in the sense of correctly calling the winner about 70% of the time when it gives ~70/30 odds, about 90% of the time when it gives ~90/10 odds, etc. IIRC it was slightly under-confident, i.e. called the right winner slightly more often than it expected to.
Of course this calibration requires making predictions on lots of races, not just sparse Presidential ones. Since Presidential elections must have systematic differences from others, even the calibration of the uncertainty is uncertain in an unquantified way.
Michael:
In the past, Nate’s election forecasts have not been quite calibrated. As you say, they were a bit underconfident, which relates to my point in the above post and comments about the new Fivethirtyeight forecast being in the Fivethirtyeight tradition of expressing high uncertainty. In any case, as discussed, these methods have been applied on only a few national elections, and the statewide results within a national election are correlated, so any evaluations or attempt at calibration are speculative.
Hi Andrew,
G Elliot Morris (whose work I enjoy very much) addressed the questions surrounding the 538 model on twitter:
https://x.com/gelliottmorris/status/1812505261950587082
I have a question about this:
‘- Usually this splits the difference between the polls and fundamentals, but the model can push vote shares outside the range of the observed polls and fundamentals if that’s what the model needs to do to make the correlations between states match expectations.’
I’m surprised that this is a feature you would want in your model (granted I don’t have a stats background). Some people have suggested that his method for accounting for correlated polling error across states is unusual.
What are your thoughts on his method for accounting for correlation of polling error between states as explained on his twitter post?
Thanks,
John
John:
I haven’t looked at the details here. All I can say is that multivariate distributions can be confusing. Take a multivariate normal prior with correlations, and combine it with a multivariate normal likelihood with a different correlation structure, and the result can be counterintuitive. I guess the right way to go would be to do some experimentation to better understand how the inputs map to the outputs. We’ve done some experimentation with the Economist model, but, as usual, the difficultly is that the model itself is so complicated that it can be difficult to interpret the results. Which suggests that some research is needed on various stripped-down versions of the model, so we can build up our understanding.
Thanks for the reply!
I’m still concerned that there isn’t a great explanation for 538’s wisconsin’s final forecast being more in biden’s favor than either the fundamentals or polls.
https://projects.fivethirtyeight.com/2024-election-forecast/wisconsin/
They added the disclaimer “Before Election Day, the final forecast in some states can be more Democratic or Republican than the fundamentals and polls because of patterns of overperformance in similar states.”
So my understanding is that you have the fundamentals forecast with the expected state correlation matrix, and then you have the polls with their state correlation matrix. The way you get what he’s talking about would be if poll means are deemed very uncertain relative to the fundamentals (hence the final mean heavily weights the fundamental), but the poll state correlation structure is deemed reasonable relative to the fundamental model. So you have are left with a mostly fundamentals nationwide mean, but a hybrid fundamental/poll state correlation structure. Furthermore, the poll correlations show trump performing relatively worse in states like wisconsin than the fundamentals expect (is this true?).
I mean, sure it’s possible. It just feels weird to be largely dismissing the first-order polling measures, while simultaneously giving weight to the second-order measures.
Kj:
Regarding your last sentence: I would not want to dismiss the importance of the fundamentals-based forecast! As noted above, fundamentals-based forecasting is where I got started when working in this area back in the 1980s. I was focusing here on the error term because that seemed to be an issue that people were missing in their discussions of these different forecasts.
I wasn’t trying to dismiss the fundamentals model. I do tend to think the 538 model is overweighting it, but it’s certainly a defensible assumption. My issue is that I think their final posterior is something akin to a frankenstein fundamentals-mean + polls-correlation. This seems like a strange thing to end up with.
I’m guessing it came about because the fundamentals model has high uncertainty, while the polls by themselves are relatively low uncertainty. By adding the systematic bias term to the polls (justifiably so), the polls mean becomes very high uncertainty. But without a corresponding systematic bias to the state correlation structure, you end up the polls having a highly uncertain mean, but relatively certain correlation structure. Combining that with the fundamentals get you what you see.
What the model is essentially saying is that this far out from elections, polls are mostly useful for measuring the state-correlations and not the mean. Is this a reasonable assumption?
The final (average) forecast, compared to the forecast polling average, is a systematic improvement of 4-5 points in the vote margin for Democrats (only DC is an outlier). This improvement is correlated with the “fundamental” forecast (which is also more favorable to Democrats than polls everywhere except in DC) but in a few cases it “overshoots”.
https://imgur.com/a/XCSxZwb
Yeah. It’s weird. It’s bold to say: “Biden will outperform his fundamentals-forecast on election day and the pollsters will be off in the other direction by 4 points.”
I’m curious what states have the highest correlation to Wisconsin and what their forecast says relative to the fundamentals forecast and polling forecast.
Anon:
I don’t think any of these forecasts are saying that the Democrats will outperform by X or that the polls will be off by Y, for specific values of X and Y. I think the forecasts are saying there’s quite a bit of uncertainty about X and Y, and when you pipe that uncertainty into the model, it gives you a probability forecast that’s close to 50/50, or, at least, closer to 50/50 than you’d get from a naive poll aggregation.
How close to 50/50 is another question. Again, I’m not saying I think Fivethirtyeight team made the best choices; I’m just trying to give some insight into how the different pieces of the forecast fit together.
Oh. I see what you’re saying. Thanks for the reply.
Is there a way to partition A as a predictor B and B as a predictor of C. In other words, separate the uncertainty based on current polls and polling right before election from the uncertainty between polls right before election and actual election outcome?
I could imagine this as some random effect for time until Election Day based on poll variability in previous elections, but I’m not to familiar with time series and forecasting and most of the work I’ve done with hierarchical modeling has been cross-sectional.
Wannabe:
Yes, our model has separate error terms for A!=B and B!=C. The A!=B error term is a random walk prior over time, which allows possible drift in the polls, and the B!=C error term represents persistent polling biases. Both these error terms are correlated between states, and both require a lot of assumptions to set up (but setting them to zero would require even stronger and more implausible assumptions). We describe the model, but not in all its details, in this paper from 2020.
> Is there a way to partition A as a predictor B and B as a predictor of C.
FiveThirtyEight does show separately the “Polling average” (current state of the polls), “Adjusted polling average” (their estimate of the “true” current state of the polls), “Forecast of polling average on Election Day” and “Full forecast”.
The (median) forecast is equal to the (median) current adjusted estimate but the uncertainty interval is much wider.
See the section “What do the polls and fundamentals alone say?” in each of their “Who Is Favored To Win” pages: https://projects.fivethirtyeight.com/2024-election-forecast/#adjustments
“That’s the whole point of a 50-50 forecast; it expresses ignorance!”
All this reminds me of an old Daily Show clip, which seems unavailable now, about the large hadron collider (LHC) and the probability of the world ending. From https://physicsworld.com/a/the-daily-show-does-cern/:
“Cue Walter Wagner, a high-school physics teacher, who infamously filed a federal lawsuit in the US District Court in Honolulu last year to prevent the LHC from starting up. He told Oliver there is a one in two chance that the LHC will destroy the world.
The funniest part is when Oliver asks Wagner to give more details about the “50/50” chance of survival.
“Well, if you have something that can happen and something that won’t necessarily happen, it’s going to either happen or it’s not going to happen, and… so the best guess is 1 or 2,” says Wagner. To which Oliver says to a slightly bemused looking Wagner, “I am not sure that’s how probability works Walter.””
Raghu:
Yes, we discussed that in one of our posts four years ago. Even in a two-party election, should the “ignorance” baseline be a 50/50 chance of winning the electoral college, a 50/50 share of the popular vote, or last election’s vote outcome, or the forecast from the fundamentals, . . . It’s turtles all the way down!
My tl;dr summary that leads off the post is a bit too compressed. A better way to put it is that a 50/50 forecast is one way of expressing ignorance. In this particular case, if you start with the two candidates being close in the polls, as they are now, and you place yourself in a historical framework of close elections, and you allow for the possibility of 1988-scale polling swings, than you’ll end up near 50/50. Other assumptions will lead you to other places.
individual models are useful individual tools, but stacked models should in theory be better than any individual model. BMA would apply model weights based on observed outcomes, but in the case of a forecast, we haven’t yet observed the outcome. Is a simple average over models an improvement here?
M:
Yes, I would use stacking rather than Bayesian model averaging to combine predictions (see here) but in this case, the number of previous elections is low enough that it’s hard to get much out of a data-based combination or calibration procedure (except to discard the methods that performed really badly in the past). Another challenge here is that the models get changed from election to election, and sometimes within a campaign as well.
There’s a larger issue here, which is that the use of numerical expressions of the race give a spurious precision to the predictions. 538 isn’t saying that the race “is a toss-up and could go in either direction,” it’s saying that Biden has a 54% chance of winning. It was that precision that sold the public on the idea of these models — that the models weren’t just going to be some pundit saying “Well, it could go either way” — instead they would be scientific and precise.
They’re not — or at least the models don’t really have any added value over a random person looking at the race and saying “I don’t know what’s going to happen” or “Trump’s probably going to win.”
The problem is compounded by the fact that when the modelers get called out, they famously retreat into the “well, it’s not *really* precise, it’s just expressing an overall sense of the race.” Silver’s famous 70% prediction for Clinton in 2016 got hand-waved away in exactly that way: that Clinton was probably going to win but Trump had a chance. Well, thanks, Nate, why are you more valuable than Tom Friedman, again?
I’m highly entertained that no one can figure out a response.
Nate is more valuable than Friedman because he does provide a probability, and we can use that to see how well calibrated his predictions are (as discussed above, he turned out to be underconfident).
“we can use that to see how well calibrated his predictions are”
We really can’t…or, I mean, we think we can, but it’s a false certainty.
My general feeling is that it wouldn’t surprise me given the biases inherent in telephone polls, internet polls, via nonresponse and whatever else… if there were consistent errors in polling on the order of 5-10%. If I take the polling outcomes as normal(0.5+bias,0.05) and the bias itself as about normal(0.0,.07) say, then actual outcomes could be kind of anywhere in the range of sqrt(.05^2+.07^2) ~ .09
I knew before any polls that the outcomes would be something like normal(0.5,.1)… so I have a hard time thinking that any of this is predictive of anything.
When I see poll shifting I think mostly “perhaps there’s some general shift in the bias” for example, after a Republican took a shot at Trump perhaps a bunch of Dems became more or less likely to answer phone or internet polls, and perhaps Republicans become more or less likely to answer phone or internet polls… Also perhaps say some of the more moderate republicans realize that they can’t support a guy who is so divisive even republicans are taking shots at him, or perhaps Dems think “see, the republicans are going to start shooting people… we gotta vote for Biden even though he’s arming Israel” or whatever. The changes in who is going to bother voting at all are maybe more important than who they’ll vote for. The choice for many marginal people isn’t “vote for Biden or vote for Trump?” it’s “Vote for Biden or just stay home?” or “Vote for Trump or just stay home?”
But do these things represent real shifts in the outcomes in Nov? or do they just represent differences at the margin that bobble around?
Of course the Economist model looks at outcomes of the individual states, and so it has some better more precise calculations than my internal intuitive ones, but even still, I find it hard to be very far from 50/50, if The Economist says 60/40 I could maybe get on board with that by the time it’s saying 75/25 I’m imagining a mild amount of over-confidence.
Does The Economist model have bias parameters per state that are mean-zero? Or also include an overall bias at the country level?
Yes Daniel but the real questions here is, of course, ‘is this sequence of election forecasts a martingale?’
Deja Vu all over again.
Daniel Lakeland wrote, ” after a Republican took a shot at Trump perhaps a bunch of Dems became more or less likely to answer phone or internet polls, and perhaps Republicans become more or less likely to answer phone or internet polls… ”
Well, time has gone by since the shooting and as far as I can tell from what is emanating from the convention, it is all Biden’s doing; he somehow provoked the shooter and made it impossible for the Secret Service to do a proper job of protecting Trump. And here is my prediction: the bandage over the right ear is now the new American Flag pin. Proper foot gear is now the “Fight Fight Fight” sneakers.
https://www.yahoo.com/news/trump-already-cashing-assassination-attempt-172551135.html?fr=yhssrp_catchall
replacing the predecessor sneakers:
https://nymag.com/intelligencer/article/absolutely-everything-we-know-about-the-trump-sneakers.html
Surely when people look at a poll aggregator (or just a poll in general) they’re not interested in the predicted result as of election date and the sqrt(T) uncertainty that comes with that, rather they want to know what would happen if we ran the election right now. A polling aggregator that says “the election is too far away for us to meaningfully predict a winner” is ostensibly pointless no? In the limit you’re arguing that if polls all said X wins +20% of the vote, but the election is sufficiently far away, the aggregator ought to mark their prediction at 50/50.
So in essence, why not publish both? The prediction market EV 50/50, and the “run it right now” 75/25.
Jimmy:
Yes, Fivethirtyeight does something like that; go here and scroll down to “What do the polls and fundamentals alone say?”
A longer answer to your question is that, yes, people do care about the model-based forecast of the election outcome, not just the “nowcast” of what would happen if the election were held today. The Slate article is correct that we should expect the forecast to get more precise during the upcoming month; its error was only to suppose that they know which way it will be moving.
And, even as early as July (i.e., now), the model will not necessarily give a 50-50 probability. Our Economist forecast gives the Republicans a 3/4 chance, and if the polls move around, that will move the forecast too. As discussed in the above post, the Republicans are currently polling at around 51.5% of the two-party vote, which is a lead, but not a huge lead. If they were polling at 55%, the probabilities of winning would shift accordingly.
Cheers, I accept that I waved too thick a brush. Thanks for pointing out the additional info on 538.
Do you think aggregators should spend more time extolling the value of inspecting the posterior? I personally would be interested in understanding whether 538 is confidently uncertain or unconfidently uncertain, and by extension the economist and Nate etc… You’re all sampling from distributions that purport to represent the same thing, it would be nice to see a comparison of the distributions themselves, don’t you think?
Why would I want to know what would happen if the election were run today given that it’s a 100% chance the election is NOT going to be run today or at any time other than Nov also given there is literally no way to observe the accuracy of such a prediction, and models in the past have been very inaccurate even a few days ahead of the real election (2016 for example)?
I can understand why political campaigns might want to know something about say which direction things are trending, and whether the get out the vote efforts are working, or whether people’s confidence in the candidate or the policies they’re advocating is changing etc, but that’s specific to the campaign management, and even they can’t really know for sure if people’s views are trending or just the polling bias is trending.
Honestly I’m very confused how to interpret these models in a meaningful way. I just don’t think we can identify whether the models are giving real information about political viewpoints or just information about the fluctuation in the biases in measurement.
If you believe that polls are a martingale, then all you get by running it forward is an increase in uncertainty. Even if you don’t believe polls are a martingale, the uncertainty necessarily increases over time, and that will reflect in an aggregate prediction as of right now which is more diffuse. You can see that in prediction markets.
Jimmy:
The idea is that forecasts should be a martingale, not that polls should be a martingale.
I would like to know such things, because I’d like to know who is “winning” right now. My mental model operating in the background is that the candidate preference of an individual voter is basically stable over time unless acted upon by outside forces, at least once they’ve moved out of “undecided.” And so depending on the percentage of voters labeling themselves undecided, we get a sense of what the candidates have to do to try to win the election. It could be that even a modest win among currently undecided voters would give them a win, or the pool of undecideds could be small enough that one candidate has to actually convince supporters of the other to change their vote preference, etc.
Consider, for example, Pennsylvania in 2012, 2016, and 2020. In 2012 and 2020, even as early as July/August, polls are showing Obama/Biden with 48-52% of respondent votes. It was clear in both cases that it would be quite hard for the Republican to get to a plurality without either changing a substantial number of minds or getting a large group of people to come out to vote who so far were either not answering the phone or answering and saying they weren’t voting. By contrast, this cycle is looking more like 2016. Granted, no one is as low in terms of vote share (not margin) as Trump was in 2016 (for a long time his vote share in the midwest was polling in the high 30s). But you have 15-20% of the electorate consistently saying they’re voting 3rd party or remaining undecided.
Of course one still has lots of problems with whether polling is getting a representative sample of the electorate.
Kevin:
Take a look at our paper from 2012, Understanding persuasion and activation in presidential campaigns: The random walk and mean-reversion models. The model you suggest above, “that the candidate preference of an individual voter is basically stable over time unless acted upon by outside forces,” is approximately the random-walk model as described in that paper, but it does not always fit the data.
If you are an actor capable of *affecting the outcome* and who wants to make a plan to do so, it’s important to get a measure of the state of reality that doesn’t incorporate your future actions. And a now-cast represents approximately that, with a few other things thrown in.
Hello Alex!
Yes, political campaigns use polls to try to gauge the electorate’s responses to position statements and policy proposals! A now-cast isn’t perfect, but it is a very useful tool.
The politics of polling: why are polls important during elections? was written by a statistics professor at the London School of Economics who was asked to investigate why polls during the 2015 UK election were so incorrect: “Polls’ main use is prior to elections, where politicians use polls as a tool to inform their campaigns and to craft messaging.” He describes polls as “not independent of the political process”.
I’m with Daniel here, I think. I still find the whole idea of polls regarding who will win disturbing. Let’s assume the polls are actually accurate. As a result, if party X is ahead or trending that way, then party Y will probably make adjustments. Does this mean that party Y will actually govern differently if they win? Does it mean they really change their beliefs? Or does it just mean that they attempt to “sell” themselves differently to the public? Once you add in the uncertainty about the accuracy of the polls, then the same issues arise, except that the changes in strategy now are driven by both the poll results and the analysis of the poll results. I still don’t see a meaningful or credible shift in actual policies, only a change in strategy to manipulate public perception.
To be a bit more concrete, there is all the talk about which president or party will cause more inflation or do more to reduce it. The reality is that the president has little effect on inflation. The largest effect of political party on inflation is through the size of the budget deficit and both parties now appear to believe the deficit is irrelevant – they love to spend money that isn’t theirs. But they do differ on what they want to spend that money on. That is a real difference in policy, but with little impact on the overall inflation rate. So, what can polls reveal? They can tell us something about the public’s belief in which candidate will lead to more or less inflation – a belief that is largely divorced from reality. And, then the parties will respond to these polls by shifting their message – but not really shifting their positions or policies.
Forgive me for being skeptical and disillusioned. Voting seems to me to be more and more a game (admittedly with serious consequences) and polls are a game about that game. Entertaining (at least to some) but largely divorced from intelligent policy making. Why is the messaging important if it doesn’t reflect any real changes in policy? (I don’t deny the analytical issues associated with polls and election forecasting and their methodological value – I am lamenting their relationship to actual public policy)
So maybe the odds are 50/50 because of potential big swings in public opinion? I doubt it. I think people have their minds made up in advance, more than any previous election. Both candidates have presidential records in office. Both are polarizing, for different reasons. The electorate is more partisan than ever. This should be the most predictable election.
Roger:
You might be right, and that’s pretty much what’s being assumed in our Economist model. As noted above, I think the Fivethirtyeight model is leaning in the direction of being more open to larger uncertainties (e.g., the possibility of 1988-style opinion swings), and the point of the above post was to connect these modeling decisions to the forecast outcomes.
Roger,
If you’re so sure, you should be willing to offer at least 2:1, right? Offer 2:1 on either the Democrat for president or the Republican, and I’ll take the there side of the bet. How about $200 vs $100?
Every betting site pays better than 2:1 for Democrats winning: https://www.oddschecker.com/politics/us-politics/us-presidential-election/winning-party
If I understand what you mean I could offer you $200 against $100, bet $85 elsewhere to get $215 if the Democrat candidate wins and make $15 in profit with either a Democrat or Republican victory.
Nevermind, I got confused with the odds. I could break even betting the full $100 with the site that pays three dollars on the dollar. But to lock in a gain I’d need better odds.
I think the biggest uncertainty is who will go vote and who will just answer polls but not be willing to or able to actually go vote.
You’ve got leftists who think Biden is arming a genocide and are considering staying home.
You’ve got “center right” people who think Trump is dangerous but can’t bring themselves to vote for a Democrat and may just stay home.
You’ve got a number of people whose mind is made up but will be disenfranchised by active attempts to suppress voting, such as laws described here:
https://en.wikipedia.org/wiki/Republican_efforts_to_restrict_voting_following_the_2020_presidential_election
So the uncertainty comes down to who votes and who chooses not to and who is suppressed.
None of these models address this concern as far as I know?
Things like that happen in every election, these are just more reasons the polls don’t perfectly predict the actual vote. So, to the extent that they are approximately the same magnitude in this election as in previous elections, they are part of the noise terms in the models. I’m sure you are right that most of these issues are not _explicitly_ included; I think that would be very hard to do. Or, rather, it would be easy to do in the sense of adding those terms to the models, but very hard to assign parameter distributions so that you would actually improve the predictions. (That said, pollsters do _try_ to capture the effect of lack of enthusiasm for one candidate or another, in their ‘likely voter’ models).
Phil:
One challenge with the likely voter models is that turnout in the general election is around 60%, whereas fewer than 10% of people respond to polls. Anyone who responds to a poll is then already more politically involved, in some sense, than the average voter. So a screen for likely voters can overcorrect.
Andrew,
But if you know it’s likely to overcorrect, you can try to correct for that overcorrection, right? Try to reach a situation in which you don’t know which direction your error is likely to be in.
Phil, if you mean by “things like that” people choosing not to vote… I agree they happen all the time. If you mean people in a big wave passing laws designed to disenfranchise certain groups across GOP dominated states… no, that’s a particular thing that happened this cycle in ways that are fairly different from other cycles.
You mentioned that prediction markets’ predictions are circular because the bettors are “informed by economic conditions and by the latest polls.” However, Manifold Markets has high calibration (https://manifold.markets/calibration) even though most of its questions lack external information sources. For example, a market on self driving cars doesn’t have any outside information from polls; the users are using their own hunches and prior knowledge to make predictions. I think this suggests that much of prediction markets’ accuracy has to do with the “wisdom of the crowd,” and even if they are partially an aggregation of polls and economic conditions, they are relatively accurate.
Anon:
All these markets are based on some outside information. For upcoming elections, opinion polls are a key source of outside information. For self-driving cars, the outside information is coming from some combination of technology developments, media reports, etc. I agree that markets can be an efficient tool for information aggregation (the “wisdom of the crowd”); the information still has to come from somewhere.
I agree with Sethi that we can learn a lot by looking at prediction markets. Also, these prediction markets are informed by poll aggregators, which are informed by polls, etc.
I think there are a couple things about the Polls especially the National ones, The first one is stranded voters, who are voters that favor the opposite party than the one that usually prevails in their state, The biggest one is the 6+ M Trump voters in California & a smaller number in NY. No matter how much better Trump does in these states he will not win them yet increases in their numbers may enough to move National Polling toward Trump without affecting the actual national map. After all the reason the Republicans have a 5 seat majority in the House is that the mostly non existent pre-election 2022 Red Wave did actually hit in both states & resulted in enough close losses to allow it.
Every time I see this type of discussion about which probability is “right” or “wrong”, I’m reminded of de Finetti’s wise words: “PROBABILITY DOES NOT EXIST”.
I know subjective Bayesian is not really that popular, but to think that probability is an objective measure that can have something like a true value is a bit puzzling to me.
Perhaps probability exists in the combinatoric sense. Eg, if you work out the possible outcomes of 10 flips of a fair coin, there are more sequences that consist of 5 heads/tails than anything else. This is how the binomial distribution is derived.
However, working out all the sequences for a trillion flips (or whatever the limit is with modern computers) is impossible in practice. Then, what if instead of a binary outcome it is trinary, or an even higher dimensional problem? Eg, the quantum state of all the molecules in a baseball stadium during a pitch.
Essentially the probability does exists but is unknowable in practice. It is impossible for us to work out all the possible combinations. So instead we use estimations/approximations and call that “probability”, which indeed does not exist. Very similar to the initial condition problem in chaos theory.
Which is a great explanation of how probability kind of might exist for a very simple contrived (and to humans meaningless ex the super bowl) event with only two possible outcomes like a coin flip.
This is the basis for the concept of probability. Take three flips, here are the combinations:
HHH
HHT
HTH
HTT
TTT
TTH
THT
THH
The probability of x heads:
3 H: 1/8
2 H: 3/8
1 H: 3/8
0 H: 1/8
This is how it was originally thought of back in the 1700s:
https://archive.org/details/doctrineofchance00moiv/page/1/mode/1up?view=theater
De Moivre, of course, almost immediately extends this to approximations/estimations which do not strictly meet his definition.
But that really is the basis for quantifying probability.
“However, working out all the sequences for a trillion flips (or whatever the limit is with modern computers) is impossible in practice. ..”
This isn’t actually true. You can compute reasonable estimates.
Let me clarify what I believe de Finetti meant with his provocation: probability does not exist as an objective physical measure, like length or mass, which you can physically measure. Instead it’s a measure of one’s uncertainty, and therefore, will vary based on one’s beliefs and information about an event.
Take the coin flip example. What does it make a “fair coin”? Is it the coin’s physical properties, the way it’s tossed or both? Of course, there is an element of its physical constitution: a coin with two heads or two tails will never be fair. However, even a so call “perfectly balanced” coin with a head and a tail can be tossed in such a way that you almost always get one of its sides, as Diaconis has shown. So, even on this very repeatable kind of experiment, saying that the probability of a coin landing of heads or tails exists as an objective physical measure sounds a bit like an illusion.
This is correct, Probability isn’t a quantity you can measure, it’s a quantification of information that you have about things.
To paraphrase Jaynes, measuring probability by measuring the world is like trying to quantify a boy’s love of his dog by measuring the dog.
The fair coin(flip) is a modelling assumption. Assuming symmetry allows effects due to the rest of the universe to cancel out, so we no longer need to consider all those combinations of molecules.
If this symmetry is broken, it becomes impossible (in practice, not principle) to calculate the actual probability (work out all the combinations). We can only estimate it by, eg, measuring frequencies.
This combinatorial probability exists just as much as saying “there are 5 apples out of 10 fruit”. But if you have a billion different fruit its no longer practical to count and classify all of them, so approximations/estimations are used instead. That doesn’t mean the number of apples stops existing.
“PROBABILITY DOES NOT EXIST”.
badabing.
Raphael:
Probability exists in the same sense as the English language exists. It’s not something you can touch; it’s a tool that allows us to better reason and communicate.
Some of my views on the topic are in the post, What is probability? and chapter 1 of Bayesian Data Analysis.
Andrew:
Sure, I like that analogy, t’s an abstract measure. My point here is that, as a measure of one’s uncertainty, there isn’t a “right” or “wrong” probability. Not sure if you would agree with that though.
I’ll re-read chapter 1 of BDA to remind me your views on this topic. Thanks!
Nate Silver has just posted thoughts on the 538 model. His criticisms sound reasonable to someone who doesn’t know anything about the inner workings (me) but I’d be curious what others think.
https://www.natesilver.net/p/why-i-dont-buy-538s-new-election
Michael,
I’m glad to see Nate looking into another group’s forecast in detail in that way. I find this sort of outside look to be very helpful. Back in 2020 we did something similar looking at Nate’s Fivethirtyeight forecast—for example, one of our posts was called Reverse-engineering the problematic tail behavior of the Fivethirtyeight presidential election forecast, and it featured lots of graphs and code—and I was frustrated that Nate did not seem to look at or address our criticisms. I get it—he’s a busy guy, also if he were to agree with us about the merits of our comments, it wouldn’t be so clear how to fix his method, so maybe it made more sense for him to just dismiss what we wrote without at the time addressing the problems with his forecast. To be fair, the problems we identified were not major—they were artifacts in the tails of the probability distribution and did not directly affect win probabilities or other headline numbers—and it was during the campaign season when it would not have been easy for him to overhaul his model. Nate writes that Elliot Morris is “too busy to provide a longer explanation” now, which makes sense given that Nate was too busy back in 2020. I have time to write all these blog posts and comments, but that’s part of my job—as a Columbia professor, I have the time and inclination to compose endless explanations, but these guys are in the business/media world and are always hitting urgent deadlines.
In any case, I think it’s great that Nate is offering specific criticisms of the Fivethirtyeight model, and I hope the Fivethirtyeight team can make use of these criticisms and make improvements in their method. I’m also happy to see that Nate’s putting all this on a blog, which allows him to give all the details he wants. Much better than twitter! Nate writes, “statistical models like these are complex and can very easily go wrong. . . . it’s often hard to detect these design flaws through backtesting alone — usually you only learn the hard way once a model is stress-tested under real world conditions.” I agree completely.
Regarding the specifics of Nate’s comments: I see him making two main points.
Nate’s first point is a disagreement with Fivethirtyeight’s fundamentals-based prediction. He writes, “I also think their model gives Biden too much credit for being an incumbent in a polarized era where the incumbency advantage has considerably diminished. . . . My [Nate’s] fundamentals model has Biden favored in the popular vote by roughly 2.5 points, whereas Morris’s has him ahead by 3.3.”
This first point is not such a big deal; as Nate says, “this isn’t that large a difference”—a difference of 0.8 points in the lead corresponds to a difference of 0.4 percentage points in the two-party vote share—and its importance in the forecast reflects the general phenomenon that, when predicting a close election, small shifts in the expected vote translate to large shifts in win probabilities. When Clinton was running against Dole in 1996, for example, a shift in his predicted vote share by 0.4 percentage points wouldn’t have changed the status that he was a strong favorite to win reelection. Recent elections have been very close, though, and 0.4 percentage points can make a difference. There’s not too much more to say here except that, yeah, I guess the Fivethirtyeight team should look carefully at how they include incumbency in their predictive model. The current incumbent has low approval ratings, so it could well be that you’d want incumbency to be a negative predictor in this case.
Nate’s second, and larger point, is the relative weighting of the fundamentals-based prediction and the polls. He writes that the Fivethirtyeight model “treats the fundamentals as a strong prior and I [Nate] treat them as a weak one that you should be pretty eager to discard once you get enough polling. And I think one should be wary of strong priors in data-poor environments (only one election every four years) like election forecasting.”
From a Bayesian perspective, I don’t think there’s much daylight between any of us in general terms. It should always be the case that the importance of your priors diminish as more data arise, and, yes, when data are sparse, inferences will necessarily be more sensitive to priors and you’ll want to examine them carefully.
The disagreements come in the specifics, and they relate to what I wrote in the above post. To say that the Fivethirtyeight forecast overweights the fundamentals-based forecast and underweights the polls is to say that it’s expressing a model in which there can be large swings in the polls between now and November (that’s A!=B in the terminology of my above post) and that the polls can have a systematic bias (that’s B!=C).
Nate’s specific disagreement is with the Fivethirtyeight model’s implicit claim that there can be large swings in the polls between now and November. Nate writes, “their estimates of polling movement are derived from polls since 1948 — but polls now are much less ‘swingy’ than they once were . . . in a time of extremely high polarization, ‘drift’ is much less than it once was: the polls hone in toward their final margin earlier since few people’s votes are actually up for grabs.”
So, yeah, that’s the crux of it! The Fivethirtyeight model expresses a lot of uncertainty because it’s allowing for large, Dukakis-versus-Bush-in-1988-style swings in public opinion, whereas the Economist’s model and Nate’s model are making stronger predictions by assuming that swings during the campaign will stay in the narrow range that we’ve seen in recent national elections.
Nate frames his differences with the Fivethirtyeight forecast of 2024 as a disagreement of how much to trust the fundamentals, and that’s part of it. The other part is the model’s uncertainty about potential changes in public opinion.
As Nate points out, Fivethirtyeight’s wide uncertainty about national swings translates to wide uncertainty about state forecasts, for example, ” in Pennsylvania, 538’s 95th percentile forecast covers outcomes ranging from roughly Biden +18 to Trump +17.”
One “sociologically” interesting thing to me here is that the criticism that Nate is making about the Fivethirtyeight model in 2024—its predictions are implausibly wide—line up pretty closely to criticism that were made of the Fivethirtyeight model in earlier years when he was running it. For example, on 27 Aug 2020, I took a look at forecasts for Florida. The Economist’s 95% predictive interval ranged from roughly Biden +16 to Trump +6. Meanwhile Fivethirtyeight’s 95% predictive interval ranged from roughly Biden +18 to Trump +14. At the time, I felt that Nate’s interval was too wide, and it seemed to me that this wide range in the state predictions was there to allow enough uncertainty in the national forecast. Nate presumably believed our interval was too narrow. Fair enough; that’s why there’s room for different forecasters.
Anyway, look at this. In August 2020, Nate’s Fivethirtyeight forecast for Florida had a 95% interval of [Biden +18, Trump +14]—that’s a range of 32. In July 2024, Nate criticizes Fivethirtyeight for producing a 95% interval of [Biden +18, Trump +17]—that’s a range of 35. OK, 35 is bigger than 32, but not by much, and we are talking about a forecast that a month earlier in the cycle.
This is not intended to be a “gotcha” on Nate. It’s perfectly legitimate for him to say that a wide interval for Florida was appropriate in the unprecedented political environment of 2020, while he prefers a narrower interval in the gridlocked rerun election of 2024. As discussed above, these different interval widths correspond to different assumptions about the probability of large, 1988-vintage swings in public opinion. 2024 is different than 2020.
Here’s something interesting. In 2020, the Fivethirtyeight forecast gave wider uncertainties for state and national vote predictions, leading to win probabilities that were closer to 50%, compared to other prominent forecasts such as the Economist’s. In 2024, the Fivethirtyeight forecast again gives wider uncertainties and a win probability that’s closer to 50%. So, in both campaigns, Fivethirtyeight is giving the cautious forecast—even though it has changed management!
This suggests to me the possibility of some sort of “institutional effect,” and that’s what I was getting at in my above post and comments by saying that Fivethirtyeight’s forecast in 2024 is “playing it safe, saying that anything can happen, which is in the tradition of past Fivethirtyeight forecasts.” When moving from the Economist to Fivethirtyeight, Elliott Morris has moved to giving wider, Fivethirtyeight-style forecasts. From the other direction, after leaving Fivethirtyeight, Nate Silver has moved to giving narrower forecasts, more like what Elliott was producing for the Economist in 2000.
I’m not saying here that Elliott and Nate are explicitly setting up their forecasts with their institutional affiliations in mind. This is more of an offbeat hypothesis on my part that, just maybe, moving to Fivethirtyeight gave Elliott a feeling of increased responsibility that motivated him to think more carefully about uncertainties and where things could go wrong (in particular, the risk that without a large enough potential error term in the national swing, his forecast could too quickly go to one candidate or the other reaching a 99% win probability), while leaving Fivethirtyeight could’ve given Nate a feeling of freedom that could motivate him to think more carefully about sources of information beyond poll aggregation (for example, Biden’s age) which would make him more confident to restrict the range of his forecast.
To conjecture that they could be influenced by their institutional structure is not an insult to either Nate or Elliott; forecasting involves lots of choices, and we are all subject to incentives regarding accuracy, calibration, etc.
Hello, Professor Gelman. I see you read the informative post that Nate Silver wrote, and to which Michael Weissman kindly linked us. I have two minor thoughts. On 19 July 1:59 AM, Daniel Lakeland said,
“The only meaningful way to discuss probability of a single unrepeatable election is using Bayesian probability. There’s no frequency involved.”
Daniel seems correct, although I read Nate Silver’s footnote 4, and am curious if you have any thoughts or experience doing this, and whether it can be informative:
“If you had a sample of 1,000 presidential elections, maybe you’d find that candidates who are over 80 years old underperform the fundamentals by 3 points. With a smaller sample size, there really isn’t any good way to do that. Although maybe you could use data from Congressional races.”
Nate concludes by saying, “But if you can’t, it’s at least a reason to trust the polls more than the fundamentals.” My curiosity is about using other elections as proxies.
Secondly, and I know I am on unsteady ground already by being here, you might want to briefly preface this post and the 8 July 2024 post. Remind readers that the current 538 model is not the same as Nate Silver’s 538 model from 2008 to 2022. In 2022, Disney purchased the 538 website. Nate left, and took his model with him as intellectual property. The current 538 model was developed by Elliot Morris. That’s why Nate is unfamiliar with it.
Ellie,
1. Regarding the sample of 1000 elections: indeed we don’t have that, which I guess is Nate’s point. Data are sparse, and we have to do what we can. Nate says this should make us trust the polls more than the fundamentals, which is fine; it still leaves the question of how much the polls might swing during the next few months, which is a modeling choice.
2. Yes, I discuss the different versions of the fivethirtyeight forecast, and Nate’s and Elliott’s roles, in my follow-up post.
> In 2022, Disney purchased the 538 website.
Disney acquired FiveThirtyEight in 2013.
https://www.politico.com/blogs/media/2013/07/how-espn-and-abc-landed-nate-silver-168888
I think it’s at least worth mentioning somewhere — so I’ll do it here — that we aren’t even sure who the candidates will be in November.
Biden is in his eighties, has COVID as I write this, and seems like he is starting to sundown. He is getting a lot of pressure to step aside, and I would put the odds of that happening at somewhere above 50%. I suppose Harris is likely to be the Democratic nominee but it could be Whitmer or someone else.
Trump is very likely to make it to Election Day, but it’s not guaranteed: he’s an obese man in his late seventies, and someone just tried to kill him.
Dang it, I had planned to write something like “yes, it seems actually pretty likely Biden *WON’T* be the candidate” but now it’s too late to have that thought on record before he dropped out… this morning.
In any case, that’s hardly a major prediction on my part, people have been talking about this for weeks and the pressure was on pretty hard.
Andrew- Thanks for that detailed response. It’s interesting to see the backstory.
Given the anomalies in 538 that Nate points out (e.g. that the broad distribution of errors of fundamentals still leaves them more heavily weighted than the polls, with a narrower error distribution) I think the Economist model and Nate’s are sturdier than 538’s.
I’d love to see you run something on Lichtman’s “model” now- as in within the next couple of days. It’s playing a big role in public discourse. It’s hard to decide how to criticize it- everything looks so bad.
Michael:
Regarding the different 2024 forecasts, I think you have it backward. Nate’s criticizing the current Fivethirtyeight model for having too broad an error distribution, not too narrow. Indeed, Nate’s criticism of the 2024 Fivethirtyeight model (error distribution is too wide, forecast win probabilities are too close to 50%, some artifacts relating to between-state correlations) is pretty much the same criticisms that I had of Nate’s Fivethirtyeight model in 2020.
I wouldn’t say that any of these models are sturdier than the others. I think they’re all reasonable and all imperfect, with the key differences between them being the different allowances made for possible opinion swings between now and election day. When setting up the Economist model this year, we set that possible swing at a moderate level, saying that swings could be high compared to recent elections but nothing like what was happening back in the 1970s and 80s. I think that Nate did something similar with his model settings this year. Meanwhile, it looks like Elliott set up the Fivethirtyeight model to allow large possible swings, very much like Nate did with his model in 2020.
So the issue is not the sturdiness of the model so much as this choice of hyperparameter. Nate and I chose a hyperparameter different from Elliott’s choice, and Nate offers good reasons for that choice (modern elections are polarized and campaigns have had less swing in recent years), but I don’t think Elliott’s choice is indefensible either—indeed, it’s essentially what Nate chose in 2020. That in turn made me think about a kind of institutional effect, by which Fivethirtyeight is associated with caution and forecast probabilities closer to 50/50.
Regarding Lichtman’s book, yeah, that’s always been a joke. I’ve posted on it a couple times over the years:
in 2007: Some thoughts on “the keys to the White House”
in 2011: Nooooooooooooooooooo!
Andrew- I understand that the big difference is the bigger uncertainty in 538. But doesn’t it also look, from the direction of their weakly informative results, that they must somehow, directly or indirectly, be putting more weight on their D-favoring priors than on their R-favoring polls? As Nate says, that would be odd given the relative widths of the distributions.
I do think a brief featured blog on Lichtman would be useful, even if it’s just a one-liner with old links. I doubt many people see our exchanges down here in the comments.
1. No, I don’t think that the Fivethirtyeight model is putting more weight on D-favoring priors than on R-favoring polls. I think they’re just being super-cautious and allowing for large potential swings (recall Nate’s observation about the Florida forecast, which happens to be very similar to my observation on his Florida forecast four years earlier), and it just happens that, because of where the polls and fundamentals are, that moves things toward the Democratic column. Take the same model and put it in a situation in which the Democrats were leading by a lot in the polls (which, a few months ago, seemed like a plausible possibility) and the Fivethirtyeight prediction would be favoring the Democrats less than other models.
To look at it from the other direction: in setting up his 2024 model, Nate made the decision to allow for smaller swings, and in his post he gave solid arguments for that choice, and that’s fine, indeed it’s similar to what the Economist has chosen to do. If the Democrats were leading by a lot in the polls right now, I think that Nate’s model would be giving the Democrats a very high win probability and the Fivethirtyeight forecast would be closer to 50/50.
Nate has a lot of (well-deserved) credibility, and so when he slams the Fivethirtyeight model, we should listen—and I did, hence my post. I just don’t get the impression that Nate has fully thought through what’s going on here from the standpoint of modeling. In some ways, he has thought it through very well—if you read his post, you’ll see that he picks up on the difference between the models being the different allowances for future swings—but then he turns on the heat in some attempt to discredit the Fivethirtyeight forecast rather than to just analyze how it differs from others. I guess part of this has to do with Nate’s annoyance about his brand being controlled by others. I’d probably feel the same way if someone else wrote a book called Bayesian Data Analysis that was full of things I disagreed with.
2. Also, sure, I can re-up the post on Lichtman.
This isn’t right. A 50-50 forecast might also express the idea that the actual odds are 50-50, that if we were able to run multiple copies of the election, Biden would in fact win 54% of such elections and Trump would win 46%.
Confusing the actual chance of a stochastic event with how much we know about the event is an ongoing problem in this area, not something we want to actively endorse.
Yes, and if pigs could sing they might have hung out in the Rat Pack with Frank Sinatra and Sammy Davis Jr.
If we get to invent alternative realities then we can say anything we want about those alternative realities.
The only meaningful way to discuss probability of a single un-repeatable election is using Bayesian probability. There’s no frequency involved.
Michael:
Agreed. In the example of the election, the 50-50 odds express ignorance; in the case of a coin flip, the 50-50 odds express a lot of knowledge. Our interpretation of the odds depends not just on the current probability but on how they might evolve over time.
Another complication is that “ignorance” is not a precisely defined concept. To return to the coin example: that 50-50 odds expresses complete ignorance about the future state of the coin (heads or tails, after it is flipped) while also expressing a lot of knowledge about the underlying physics and some strong assumptions about the coin itself and the flipping process (as discussed in our paper, You can load a die but you can’t bias a coin).
Professor Gelman, at the risk of motivated reasoning about “unskewing” polls, I’d be interested to read your thoughts on whether there is any effective method to assess the embedded assumptions regarding composition of the electorate in both individual polls and averages. Is there any poll aggregation model that measures the degree to which the crosstabs of the polls match or depart from known prior presidential elections/midterms/[July] polls? It seems to me that that the 538 and Economist models, in the role of data summary, could be more transparent on this point. If there is a systematic electorate model shift that pollsters are using, how large is it?
Pretty ironic that Nate is criticizing 538 for including too much “fundamentals” and not enough “polls” when literally four years ago he shared a methodology in which he acknowledged his model used more than 50% “fundamentals” for early forecasts.
There’s plenty of good reason for people to argue about the best way to model. But unless Nate comes out and says “yeah, I was wrong to do it that way because…” I’m not interested in his hypocritical bluster to convert an audience.
He’s made plenty clear he is not a consistent or even good analyst (see 2012 probit regression when he says at a 2-3 point “margin” lead candidates achieve 80% win probability, 2020 giving Trafalgar an A- grade, 2022 concluding the partisan poll flood signalled things must not be going well for Ds, because Dpartisan polls weren’t releasing things too, and that “says something.”
Moreover, the idea that someone is “ahead” in the polls (even if granted that the polls are accurately detecting a lead among decided voters) that they, therefore, must be considered a favorite is both bad science and bad math.
2020 forecast methodology (written by Silver): https://fivethirtyeight.com/features/how-fivethirtyeights-2020-presidential-forecast-works-and-whats-different-because-of-covid-19/