Here’s our current forecast for Florida:
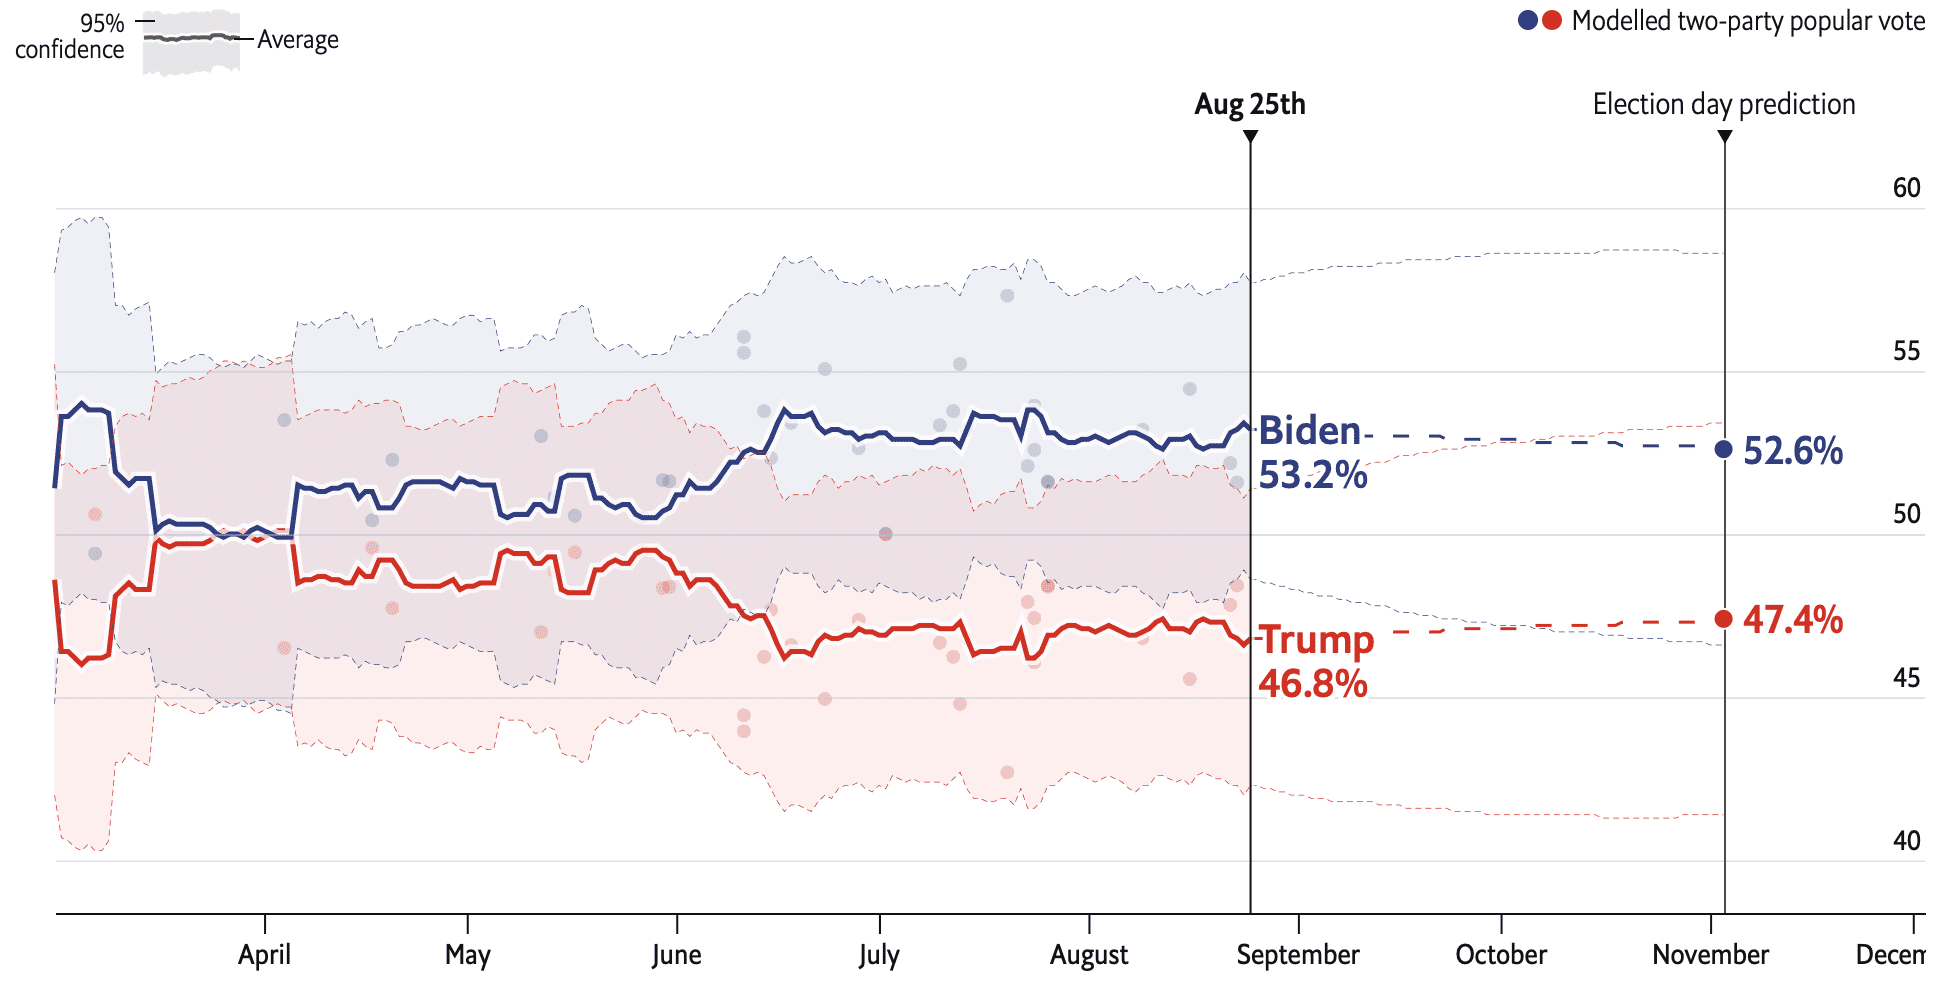
We’re forecasting 52.6% of the two-party vote for Biden, with a 95% predictive interval of approx [47.0%, 58.2%], thus an approx standard error of 2.8 percentage points. The 50% interval from the normal distribution is mean +/- 2/3 s.e., thus approx [50.7%, 54.5%]. Yes, I know these predictive distributions are not exactly normal, but it’s close enough for our purposes here.
What about the forecast at fivethirtyeight.com, which we discussed a couple weeks ago? Here’s where they are today:

They’re forecasting 51% of the two-party vote for Biden, with an 80% interval of approx [46%, 56%]. The 80% interval for the normal distribution is mean +/- 1.28 s.e., so the standard error from the fivethirtyeight Florida forecast is about 3.9 percentage points. This gives them a 50% interval of approx [48.4%, 53.6%] and a 95% interval of approx [43.2%, 58.8%].
Alternatively, we can go with fivethirtyeight’s uncertainty visualization:
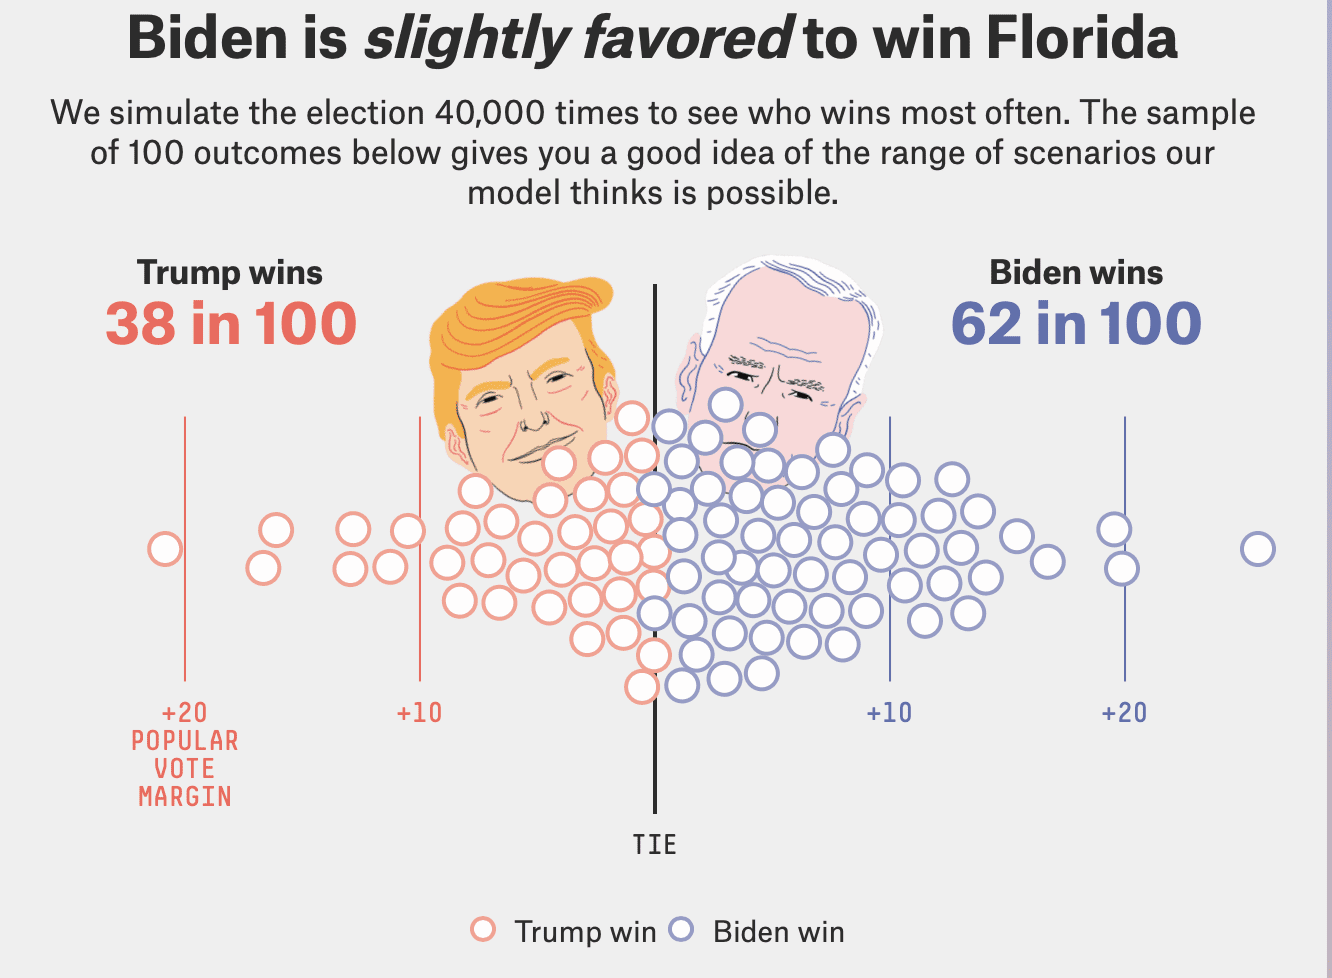
The 50% prediction interval for Florida is roughly (+4% Trump, +8% Biden), i.e. (0.48%, 0.54%) for Biden’s two-party vote share. Taking the middle 95% of these dots gives something like [+16% Trump, +20% Biden], which corresponds to an approximate 95% interval of [42%, 60%] for Biden.
Comparing the two forecasts
The Economist and Fivethirtheight forecasts differ in their point predictions for Florida. I assume that the big difference here is that we’re using different fundamentals-based predictions, so we’re partially pooling toward a prior of Biden getting 54% of the national vote, while their prior is something more like 52%.
The biggest difference, though, is in the uncertainties. Our forecast standard error is 2.8 percentage points; theirs is 3.9 percentage points. That’s 40% higher!
I was going to say that this increased uncertainty comes from the Fivethirtyeight model assuming that 2020 is a particularly unpredictable election, but I guess not, because here’s Nate saying, “this year’s uncertainty is about average, which means that the historical accuracy of polls in past campaigns is a reasonably good guide to how accurate they are this year.” So now I’m really not sure where that big uncertainty in the Florida prediction is coming from. Maybe their between-state correlation in forecast errors is too low, so they need artificially high uncertainties in the individual states to get the right national error?
The difference between the uncertainties in the Economist and Fivethirtyeight really shows up in the 95% intervals: ours is [47%, 58%]; theirs is [42%, 60%]. Their interval seems way too wide to me: do they really think Biden might only get 42% of the two-party vote share in Florida?
It can be hard to visualize 19-1 odds, though, so we could also compare 50% intervals. Ours is [50.7%, 54.5%]; theirs is [48.4%, 53.6%]. Again, these are all approximate, based on reading numbers off some graphs.
I find our intervals more plausible. That is, I think it reasonable to apply 25% probability to the event “Biden gets less than 50.7% of the two-party vote in Florida this year,” 25% probability to “Biden gets more than 54.5%,” and 50% to the in-between. In contrast, I’d assign quite a bit less than 50% probability to the event “Biden gets less than 48.4% or more than 53.6% of the two-party vote in Florida this year.”
You might disagree. That’s fine. I guess you could bet on some of these numbers; as I’ve discussed earlier (also here), I don’t take the prediction markets so seriously.
Making predictions, seeing where they look implausible, and using this to improve our modeling
My point here is not to come up with bets. Rather, my point is to use these probabilistic predictions to get a sense of how the models work. This is central to our workflow, to make all sorts of inferences and predictions from a fitted model and focus in on what looks wrong. This was the sort of reasoning that motivated us to fix our model last month. Open code is great, but it also helps to look at some specific predictions.
Looking at specifics has worked for me before. After the 2008 election I made some maps (posted on the Fivethirtyeight site, actually) using poll data to estimate how different people would vote. The next day, I got slammed by blogger and political activist Kos for some implausible estimates from my maps. And Kos was right! It was good for me that I plotted a bunch of maps—not just, say, some regression coefficients—because that gave enough information for an outsider to catch problems with what I was doing. After a couple months of retooling, I posted some improved maps based on a better model. (Since then we’ve done more; see for example here.)
One of the advantages of the Bayesian approach is that it allows granular predictions of . . . everything in your model. These predictions can be a great way to understand how your model works and diagnose problems with it. This is a strong point for the Fivethirtyeight forecast as well as our Economist model: we’re all using predictions as tools for model understanding and model criticism.
Bounds of applicability
One challenge when interpreting these forecasts is that they don’t represent all possible outcomes. Everything we’re doing is in terms of the share of the two-party vote, so, if there’s any serious third-party challenge, all bets are off—or, maybe I should say, our bets are off. Also, both forecasts are framed as Biden vs. Trump, so if either candidate dies or is incapacitated or is otherwise removed from the ballot before the election, it’s not quite clear how to interpret the models’ probabilities. I mean, sure, we could just take them to represent Dem vs. Rep, and that probably wouldn’t be so far off, but this possibility does not seem to be included in either model.
None of this is such a big deal when considering 50% intervals, but when we start talking about 95% intervals, we need to be careful about what’s being conditioned on.
And what if the votes never get counted because of a mega-version of the 2000 Florida dispute over vote counting? Again, it’s not clear how this would be handled in a hypothetical bet, but I guess that some adjustment would be necessary. Elliott Morris estimates that we should reduce Biden’s win probability (that’s win probability, not vote share) by about 7% if we want to include higher-than-usual ballot rejection rates in the model. I’d say that the existing models do implicitly account for the possibility of small disputes (such as those 30,000 votes that were never counted for Gore in Florida) but nothing huge such as 20% of the ballots in the state getting lost or ruled invalid.
Other unlikely outcomes, though, are implicitly in the model. Outbreaks of wars, stock market crashes, a new pandemic, hurricanes, a cure for cancer, shark attacks, shocking revelations about lax email security, etc., they seem to belong more in the “error terms” of the models.
As is often the case in statistics, there’s no sharp line on what is being conditioned on in these forecasts. That’s just the way things are, and we just have to be open about it.
Aren’t the fairly rapid changes in the 538 forecast recently due to their assumptions about how polls should behave during conventions? This blogpost doesn’t appear to mention that.
Km:
In this post I wasn’t looking at changes in the forecasts; I was just looking at the forecasts themselves. The Fivethirtyeight forecast interval for Florida has been very wide the whole time, I think.
Such a great post Andrew thank you. Please do a podcast or zoom with Nate. He’s been subtweeting and trolling on twitter for months but it would be great to hear you all discuss this person to person. I think it would also help the overall debates going forward.
Anon:
I’m happy to do so but I don’t know how likely this is to happen, as I’ve invited Nate to comment on the blog or to elaborate on statements such as calling MRP the Carmelo Anthony of election forecasting methods, and he hasn’t really followed up on it.
Really is a shame for so many reasons that it hasn’t happened, esp. since you’ve written papers together.
Anon:
I guess it’s ok. I’ve been enjoying working with Elliott and Merlin. It’s kinda Nate’s call on how he wants to interact with us. I was disappointed in the whole Carmelo Anthony thing.
The more general question, maybe, is how journalists and academics can interact. A traditional model is that the academic does the research and the journalist writes about it. Or the academic does the work and the journalists writes about it with a critical eye, Felix Salmon style. A different model is that the journalist and the researcher are the same person: that’s what Nate is doing. Maybe a better way to put this is that the “journalist” and “academic” roles have been erased and replaced by the analyst, who does both. Bill James was a pioneer in this. Finally, there’s the model in which the academics and journalists collaborate, which is what Merlin and I are doing with Elliott. At this point, you might ask, why do Merlin and I need Elliott at all: why would a forecast by two political scientists be improved by a journalist? The immediate answer is that the Economist forecast is Elliott’s baby: he came to us to ask for help. The longer answer is that 3 people are better than 2, and the distinction between academic and journalist is not always so clear. I do a lot of writing, Elliott does a lot of programming, and we both have thought a lot about politics. I’ve found that collaboration almost always makes things better, as long as the collaborators can get along.
Anyway, Nate seems pretty set in his go-it-alone, don’t involve academic researchers approach, and I really like to collaborate, so maybe that’s one reason we’re having difficulty communicating.
Also, unrelatedly, Nate is a public figure and so he suffers from what I’ve called the David Brooks or Paul Krugman problem: he gets so much low-quality criticism from randos on the internet, that he’s developed a way of pattern of ignoring or firing back at criticism, rather than engaging with it directly. It can be hard to have a conversation, public or private, with someone who’s gotten into the habit of considering outside criticism as a nuisance rather than a source of valuable input.
I’d add that I for example have little knowledge of American Politics. I for example learned that DC has electoral college votes…
So insightful. I can only say for myself that you, M and G have a ~tremendous~ amount to offer the public domain on these topics and I think it would benefit public discourse for it to get out. Working with a journalist helps to amplify. So does joining podcasts and other venues. I really hope you, G, and M do more work getting the word out on your perspectives as I think it’s refreshingly transparent and honest in a way that 538 has not been…
I think you are underselling the importance of the point projection here vs. the uncertainty.
The numbers you derived here seem consistent with 538 probabilities. A two-party vote share of 51% and a standard deviation of 3.9% yields a win probability of 60% for Biden (assuming normal distribution). 538 is reporting 62%.
Economist has a point prediction of 52.6% and 2.8% standard deviation, which implies an 82% chance. The Economist is reporting 79%, so again it is consistent.
But what if we apply the point predictions and standard deviations differences one at a time?
If we used 538’s point prediction and Econ’s standard deviation, the probability only increases from 60% to 64%.
If we use Econ’s point prediction with 538’s standard deviation, we 60%->74%.
So while the 40% increase in standard deviation sounds large, I think it is more the differences in the point projections that is the primary driver for the probability difference.
Justin — Good point. Our national prior is Biden +6-7 today. Nate says his is much closer to 50/50. I do wonder what it would be if he included presidential approval in his fundamentals model, like we do, or if he didn’t go all the way back to the 1800s with it (which seems irrelevant, a move looking for more data when you could just acknowledge the small-n problems).
Thanks, I’d been meaning to ask what margin the Economist prior is showing.
Also, I agree that it is questionable that raising N by brining in really old data. Assimilating more data only reduces uncertainty if the underlying data you are adding is really representative. The world was pretty different 30 years ago, let alone 100. I think there is just no way around the small N problem (in terms of final outcomes, at least).
Has there been studies about whether it is right to treat 1980 as an outlier due to the presence of John Andersen’s 3rd party campaign that fell apart largely right before the election??? I you’re going to include a lot more years, it seems it would be right to look for and assess outliers or to trim the final results some…
David:
We don’t consider any elections as an outlier, not even 1968 where a third-party candidate won 5 states. We’re just working with the two-party vote.
The top-line odds and the swing states are naturally what everyone looks at, but for the 95% interval, it’s also worth looking at fivethirtyeight’s predictions for safe states: as of today, their model gives Trump a 5% chance to win Jersey, and Biden a 7% chance of winning Arkansas.
Assuming the model’s prediction for both happening is small (and I imagine it is), that’s a 1-in-8 chance of an outcome which I think most political observers would rate at more like <1-in-100, like the Economist model does. And then 10% is a high enough number that you could go to modern presidential elections and ask how often something like that has happened. It then gets subjective, of course (does Nixon winning 49 states count, or were people expecting that?) but it gives you a comparison point.
“Their interval seems way too wide to me: do they really think Biden might only get 42% of the two-party vote share in Florida?”
“Making predictions, seeing where they look implausible, and using this to improve our modeling”
So, I think about my models in this way as well. But, where is the line between “implausible” and tweaking the model to make it what you already believe to be correct? Like, what about 43% or 44% or 45% or 46% for Biden? Where does implausible stop?
This isn’t really like “implausible” in the sense of the prior predictive checks example of air particulate matter in the visualization paper where implausible was actually technically impossible (air as dense as a neutron star; if I am remembering the example in the paper correctly).
Do you look at spoiled/rejected ballots? I saw over 520k were rejected in the primaries. Could be a large number.
My ‘theory’ is that Trump believes his chances are better if more people vote by mail than by showing up at the polls, if only because the mail ballot introduces multiple possible errors, while most people who show up managed to fill out the little circles. I assume he’d then rather Democratic efforts be aimed at mail, reducing their energy for actual turnout.
Nate Silver actually had a nice little twitter thread about this issue. Basically the idea is that you have to consider both the higher rejection rate, but also the potentially higher turnout with mail in ballots. The idea is that it’s a lot more convenient to turn a mail-in ballot, then it is to go to the polls. So you also have to consider the “rejection rate” of people who decide to go the polls on election day, but run out of gas, or forget, or are too hungover, etc.
52.6? Are you sure it isn’t 52.587013?
Bjs12:
Ordinarily I round to the nearest percentage point but I wanted more precision here because I was comparing the two forecasts.
Andrew:
Just because you *want* more precision doesn’t mean you *have* more precision.
Don’t be the guy who digs his heels in (the guy you often lament on this blog). If there is a scientific reason why you think you have 1 decimal of precision for a vote share 2 months from now, then make that case. If there isn’t, then you might want to consider updating your display for the forecast.
Bjs2:
It’s a tough call. On one hand, 52.6% is too much precision in the sense that this last decimal place doesn’t mean anything. On the other hand, if we just say 53%, then you’ll get this big apparent jump from 53% to 52% if the forecast drops from 52.6 to 52.4. So I could go either way on this one.
0.1% is something like 140,000+ people. Less then total number of votes Trump won Wisconsin, Pennsylvania and Michigan by in 2016 and less then the total number of people who died from COVID-19 in the United States. I think the precision is warranted.
Dalton:
I agree with you 0.1% is consequential. But it’s not really measurable.
Andrew:
For me, “doesn’t mean anything” would be enough to break the tie. But your call…
Nice comparison and civil writeup. Much more refreshing than the increasingly unhinged NKTOB Morris on twitter continually attacking 538.
I hate twitter.
Is there a good way to think about the elastic-net regulatization in a truly Bayesian fashion, e.g., having some truly prior probability over all possible actual law-like regularities that could hold in the world which favors the simpler ones as more likely? Could one derive something like this model starting with a probability measure over all possible theories of political fundamentals that favors ones with lower Kolmogorov complexity or something?