Political scientist Brian Schaffner writes:
If you’ve paid any attention at all to the news recently, you have probably seen more than a few stories about how the economy is weighing down President Biden’s reelection hopes. Many of these stories are based on data from polls that ask people about their own economic situations and also ask them what they think about Biden or how they plan to vote in 2024.
Such an analysis may look something like the following graph, which plots responses to a question we asked on the Cooperative Election Survey about how each person’s household income has changed over the past year and their approval rating of President Biden. . . .
But we also see a potential red flag when we look at this data: more Americans reported that their incomes decreased rather than increased over the past year despite the fact that government data indicates that wages and salaries are on the rise. . . .
Republicans were much more likely to report that their incomes declined during the previous year compared to Democrats. 35% of Republicans reported a decline in household income compared to 19% of Democrats.

Schaffner continues:
Is it really true that Republicans are struggling significantly more than Democrats when it comes to their household incomes? Or is this another example of a pattern that survey researchers call “expressive responding” — a phenomenon where individuals strategically provide dishonest answers to survey questions in an attempt to make their party look good or the other party look bad?
A Republican answering our survey might consider saying they are doing worse economically than is actually true as a way of supporting the narrative that the economy is struggling under the Biden presidency. Likewise, Democrats may report that they are doing better economically than they are to undermine that same narrative.
What can the data say? Here’s Schaffner:
It is often hard to detect survey respondents who are engaging in such expressive responding because we don’t actually know when someone is giving dishonest survey responses. (Though see here for work I did with Sam Luks where it was pretty clear). But in the case of income change on the 2022 CES, we actually do have data that allows us to get a good sense of this because it just so happens that 11,000 of our respondents were individuals we had previously interviewed back in 2020. Each time we interview a respondent, we ask them to report what their household income actually is. So for each respondent we know what they said their household income was in 2020 and what they said it was in 2022. Since these questions provide precise response categories and are buried among other demographic questions, it is unlikely that respondents would think to be dishonest when answering them in the same way that they might for the more vague and politically relevant question about income change.
So what do we see when we explore what people reported their income was in 2022 compared to what they reported it was in 2020?
In the 2022 survey, “17% of Americans reported that their income decreased somewhat in the past year while another 10% said that their income decreased a lot. Only 19% of Americans reported an increase in their income.”
But when comparing to the past survey: “only 18% of Americans gave a lower household income in 2022 than they did in 2020, while 35% reported a higher income level. Additionally, the partisan differences on this metric are much smaller — 21% of Republicans reported lower incomes in 2022 compared to 2020 while 18% of Democrats reported the same.”
Shaffner continues, “these two questions are not completely comparable since the self-reported change question asks about the past year but this second approach compares incomes reported over a two-year period. Nevertheless, it is doubtful that too many people will have suffered a decrease in income from 2021 to 2022 if their income had increased from 2020 to 2022.”
After comparing responses of Democrats and Republicans, Shaffner states:
The unfortunate effect of this pattern is to exacerbate the kind of relationship we saw in the first graph, making it look like income change is having a major effect on Biden’s approval rating when in fact it is just as likely that how somebody feels about Biden is affecting how they answer the question about income change. I [Shaffner] can show this most clearly by recreating the first plot, but this time using the measure of how each respondent’s self-reported income actually changed between 2020 and 2022 rather than how they said it had changed during the previous year. Using this approach, it turns out that the relationship between income change and Biden approval almost entirely disappears.
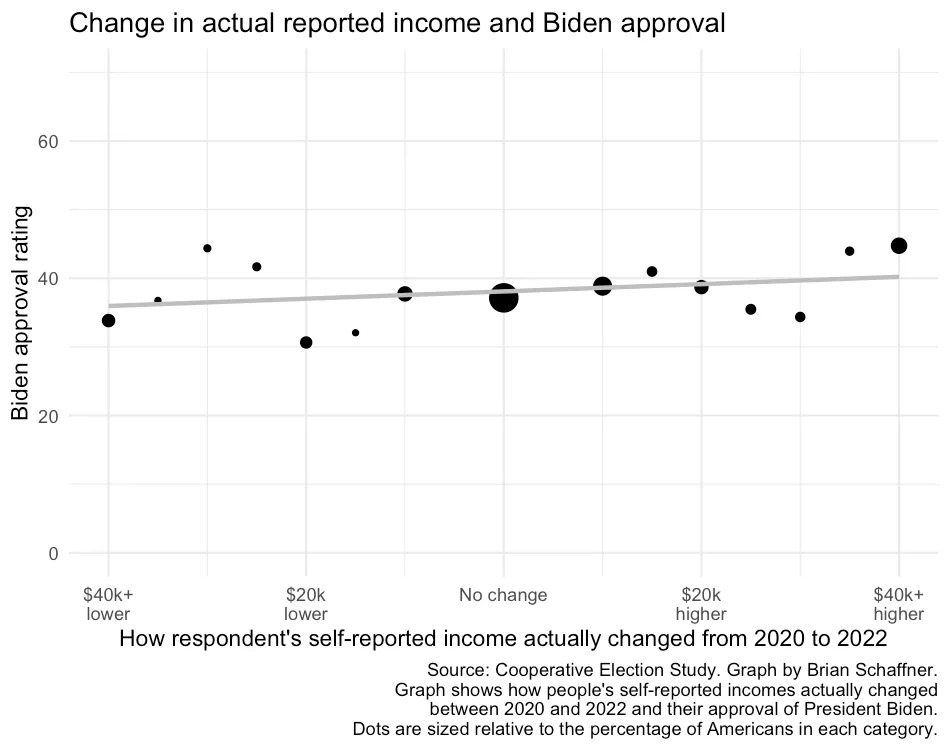
He concludes:
This is not to say that the economic picture is completely irrelevant to Biden’s relatively low approval rating or his reelection chances next year. It is reasonable to suspect that some swing voters are being persuaded by high inflation. But what this analysis shows is that simply asking people how inflation is affecting them and then comparing that to how they might vote in 2024 is not a good way to establish an accurate picture of that relationship. Ultimately, we cannot always take at face value what people tell us in polls to support a narrative that is circulating in the news.
Good point. I have nothing to add.
P.S. Schaffner and his colleagues also have a post on the claim that liberals are happier than conservatives, or the other way around. Regarding such statistics, let me point you to this post from a few years ago with further context here. It’s not just survey respondents who say things that aren’t true but fit their political ideologies.
Lake Wobegon. People don’t know what their income is/was, don’t tell the truth (expressive responding – such a great term), don’t know what inflation is nor how it is measured nor how it relates to their own spending patterns, and media reporting and selective listening distorts the data further. A few more graphs would undoubtedly be revealing: the price of a dozen eggs vs Biden approval ratings, perceived rank in the income distribution and actual rank vs Biden approval ratings, etc. While we’re at it, let’s see what people recollect about their economic positions during the Trump years.
I’m actually glad to see this type of data since it suggests just how distorted many perceptions have become. And, since there is no truth any more, we can “educate” people as to what the reality is. From a purely data point of view, the authors should consider COVID impacts – for many people, there were COVID payments that ceased during the period they are discussing – that could easily distort the picture. But I find the overall picture not surprising but utterly depressing. Democracy isn’t such a great system after all – except compared to all the other systems we know of.
Is the change in income adjusted for inflation? I feel like that would be a major factor.
I have little doubt that the main point – that ideological orientation largely predicts how people will report views on the economy – I think there’s a bit of a disconnect here:
But what this analysis shows is that simply asking people how inflation is affecting them and then comparing that to how they might vote in 2024 is not a good way to establish an accurate picture of that relationship.
Asking people about their income =/= asking them about inflation.
Looks like the sample design page is down:
https://cces.gov.harvard.edu/book/sample-design
Im always interested in who is responding to these surveys. From clicking around I gathered they got 60k to answer an internet survey and 10k returned to answer again two years later.
Are these the top 15% most enthuiastic political survey takers out of the .1-10% who would bother to begin with?
” But what this analysis shows is that simply asking people how inflation is affecting them and then comparing that to how they might vote in 2024 is not a good way to establish an accurate picture of that relationship. Ultimately, we cannot always take at face value what people tell us in polls to support a narrative that is circulating in the news. ”
==================================
… that seems an exceedingly obvious, banal conclusion for this audience — so why post it ?
… because it’s a veiled slam at Republicans specifically in a big election season… a trivial cherry-picked ‘issue’ by a politically biased “analyst”.
The major deficiencies of opinion polling are well known here and the daily news is always full of faulty polling data presented as FACT by most everyone.
Bias certainly simplifies the sorting/reporting/indicting process.
Vosse:
It’s a banal point that statistical measurement is important and that measurements can go wrong.
But the details of the individual cases can be interesting.
Consider the example that came up a few years ago, that foolish project that claimed to find that North Korea had “moderate” electoral integrity. It would be fine to say that democracy is hard to measure, all measures are flawed, etc.—but that’s an empty statement. Content is added by looking at the details.
Similarly with Schaffner’s post quoted above. You might disagree with Schaffner politically—that doesn’t really matter to me, one way or another. The relevance to us reading this blog is in the details. Yes, it’s obvious that we cannot always take at face value what people tell us in polls, so, sure, Schaffner is guilty of including an obvious sentence in his post. Most of the post is not obvious; he brings data to the table in an interesting way.
FWIW, there is data from the CPS showing that low income workers (at least the lowest 10 percent by hourly wage), and particularly low income men, have experienced consistent decline in real hourly wages.
https://www.epi.org/publication/why-americas-workers-need-faster-wage-growth/
Not sure why academics are so quick to assume poor people are so stupid they can’t even realize they are better off despite their lived experiences telling otherwise.
2014?
https://www.epi.org/publication/swa-wages-2023/
Real wages of low-wage workers grew 12.1% between 2019 and 2023. Wage growth among low- and middle-wage workers over the pandemic business cycle has outpaced not only higher wage groups over the same period, but also its own growth compared to the prior four business cycles.
Not sure why academics are so quick to assume poor people are so stupid they can’t even realize they are better off despite their lived experiences telling otherwise.
I’m not sure why some people are so quick to assume “academics” assume poor people are so stupid…
Your link appears to be for data 10 years ago. Using data from 1Q 2022 to 1Q 2024 (https://www.bls.gov/data/home.htm#wages) for the first decile of workers, average weekly earnings increased by 11.9% while the CPI increased by 8.6%.
CPI all items is a really problematic measure, both because it’s used officially for “purposes” and so has political pressure put on it, and because richer people buy a wider variety of goods and so the importance of the full basket is different for different people.
My own preference is to look at an equally weighted CPI component measure… I dont’ think the individual components are nearly as gamed as the overall weighted average. I’m not sure exactly what components are best but I certainly think : rent of primary residence, food at home, childcare, transportation are really important, healthcare and education could be good things to include.
Anyway, here’s CPI (rent+food+childcare+transport)/400 with 2019-01-01 as the index date…
https://fred.stlouisfed.org/graph/?g=1nTPu
The graph shows that since 2021-01-01 inflation has been about 25% cumulative.
Here’s median household income divided by the same index:
https://fred.stlouisfed.org/graph/?g=1nTPy
In 2019 median household income according to this measure was 68700, it declined every year and in 2022 it was 64291 a decline of about 6.4%
Daniel: Household income is a poor measure of income because the number of people per household has been in decline in the US for over a century until the last few years. Also it shouldn’t be surprising if overall household income declines in a population in which the percentage of retired people rising. Alot of people are switching from relying on wage income to relying on pensions or savings.
We could postulate that the number of people per household has started to swing back up is the price of housing, which is controlled by a labrynth of city, county, state and fed land use and permitting regs in addition to the broader economic environment.
Last but not least – as is relevant to Brian Brian Schaffner’s question – people may have many different sources of (gig jobs, stock investments, property), but only certain sources are classified formally as “income” (e.g., wages). In an informal sense, some people may view their entire financial portfolio as their “income” while others may specifically refer to there wages / salaries.
I guess it would be surprising of Schaffner isn’t aware of these distinctions among types of income, but it’s not clear from his discussion what is specifically meant by “income”.
Dale: I can’t figure out specifically which data you used from the link. Just the same, most of the charts available by googling – most of which end in mid-23, so earlier than your data – show inflation outpacing wage growth. It’s not clear why the end points you picked are relevant. Just the same, i’m not really sure if aggregate wage growth means much on a short term basis. By that I mean you need to dissect it to find out where the growth is and if it’s modest and widespread or focused on small group of workers – e.g., UAW workers seem like a good candidate.
Also as we’ve discussed before housing is a big part of rising prices and we know housing varies dramatically throughout the country, so a dip in the growth of the price of housing in a major market could cause a short-term flattening of inflation. So, again, dissection required.
Chipmunk: pensions and 401k withdrawals and IRA withdrawals are all included in income for the purposes of the median household income calculated by Census as far as I know.
Although there’s some variation in the size of households in the timeframe of interest, it’s in the 3rd decimal place for avg household size https://www.statista.com/statistics/183648/average-size-of-households-in-the-us/ and for median household it may not even be that. It simply isn’t particularly relevant to these questions for the time period 2005-onward
Dollar incomes of households *increased* throughout the period, it’s only purchasing power relative to those important fixed CPI components I mentioned that declined. In other words, things people spend a lot of their money on went up a lot and typical people are notably poorer than they were in 2019 in terms of their ability to afford stuff they buy routinely every single day.
This is very much in contrast to the propaganda that economists are putting out in the mainstream press about how “people say they’re poorer but they’re not”. I’ve come to the conclusion that for about 75% of economists the purpose of being an economist is to be a shill for rich statists. I’m not the only one saying this, after all Angus Deaton came to the same conclusion in the last 6 months or so.
You’re right though that geographic variation is important. I undertook a major attempt to create my own measure of poverty in 2017, downloading the entire microdata of the american community survey, fitting a massive Bayesian model that estimated the cost of very basic housing and food and utilities for every household size in every public use microdata area (about 100k people). It was hard to get it to fit because of computational issues, but when I did get samples they made sense… It didn’t show the US doing super well, in fact in my opinion it’s the case that we elected Trump because a lot of people are doing way more poorly than Economists want to represent using their unsophisticated measures. The Supplemental Poverty methodology also showed a similar thing, with up to 25% of black people in the country in poverty back in 2012 ish.
It may be that when a couple with 2 kids moves in with one of their parents so as to keep their kids fed and housed, that they’re “not in poverty” but they sure as heck aren’t going to be talking about how well they’re doing and how happy they are about policy and the presidential candidates on offer.
I’m with Raphael K when I say that typically if you interview a few hundred middle or lower middle class people and they tell you they’re doing poorly, you should believe them rather than saying some crap about how they don’t really know what they’re talking about… There’s been a lot of “people don’t really know what they’re talking about” in the news. That is 100% in my view propaganda in an attempt to keep Trump out of the whitehouse. I approve of keeping Trump out of the whitehouse, but I don’t approve of gaslighting people and it is likely to backfire.
In this section of the comments, bear in mind that I was responding to G’s comment about the lowest 10% of the income distribution. The data I referred to included the latest available from the BLS and it shows that income for this group outpaced inflation. Joshua’s update shows the same thing from a different source. To be sure, there are many issues with how income and inflation are measured. But I believe the picture that the lowest decile of the income distribution has experienced wage growth that outpaced inflation is correct. Please provide contrary evidence if you don’t believe that. Median earnings are quite a different thing. Contrary to the knee-jerk reaction that often manifests itself, the idea that the poor always lose is something I don’t believe is supported by the facts.
Dale, here’s income after taxes measured by my suggested CPI index for the bottom 10% of pretax income
https://fred.stlouisfed.org/graph/?g=1nUz5
It goes up and peaks in 2021 declines significantly in 2022, no further data but inflation was high in 2023 so I’m guessing it went down in 2023 is the right guess.
Daniel
You are determined to prove what you want to. I won’t quibble about these numbers – there was an increase and perhaps it decreased most recently. The fact remains that the bottom 10% had incomes that outpaced inflation post-COVID (loosely defined). What is absolutely true is that the poor are still poor. It is also true (though somewhat debatable) that the poor are worse off relative to the rich than they were previously (wealth is notoriously hard to measure). I don’t deny those facts, but they do not mean that income of the poorest 10% also declined relative to prices. Those are 2 different things. Yet you seem determined to “prove” that incomes of the poorest 10% rose less than the inflation rate by redefining either prices and/or incomes. I’m not buying it – and I think it is unnecessary to argue that income distribution is a major problem and that big policy changes (like the UBI) are appropriate.
Dale, my point is just this: Economists use the term “real income” and they mean “income as measured the way we say it should be” and this is a heavily politically charged thing.
I’m just saying “maybe they’re wrong?” maybe instead of saying “people don’t know what they’re talking about their lived experience doesn’t matter we have the numbers to prove it” we should be saying something like “our choice of measurement maybe doesn’t correspond to a real thing in the world and we should measure things differently because people are telling us stuff that contradicts our measurements?”
If you measure income vs “what people spend most of their money on” (rent + food + transport + childcare gets pretty close to it) then people’s incomes went down.
If you measure it against “all the things any people bought, including especially a whole bunch of things that middle, upper middle, and upper class people bought” (ie. CPI all items) then yeah maybe you’d conclude incomes went up… except all those people who are hurting aren’t buying all that stuff included in all-items and if they are, some significant fraction of those all-items items are very much “disposable” which they will quickly stop purchasing when they can’t make rent or eat food anymore. For example lumber came way down from a couple years ago, but a working mother of 2 kids in chicago who rents an apartment isn’t buying any damn lumber.
It’s not “moving the goalposts” it’s saying “you idiots couldn’t find a goalpost with both hands and a metal detector because the average economist has never been a working single mother of 2 relying on “food stamps” and you are completely out of touch” more or less (please remember, I’m not talking about *YOU* Dale Lehman i’m saying the profession of economics’s norms)
There is no one single “real income” but what is absolutely 100% the case is if you live outdoors for even one evening when the temp drops below -20F you will die, and if you don’t eat something between 1200-2500 calories every day you will starve to death in a month-ish, and if your children run into the street they will get hit by a car and die and you can’t escape that physics and so those particular expenses: shelter and food and childcare are at a FUNDAMENTAL law of physics way completely different from books, movies, fashion, cell phones, washing machines, curtains, perfume, paint, counter tiles, fancy shampoo… whatever.
Measured against strictly the goods that are fundamental laws-of-physics needs for the maintenance of the naked primates we call humans, incomes went down.
If your income is high enough that you afford all those fundamental needs plus more… then what went down is how much you can spend on perfume, but when your income is low enough that the marginal dollar cuts into your physical maintenance of your body’s metabolism and health… then you’re hurting.
“a working mother of 2 kids in Chicago who rents an apartment isn’t buying any damn lumber.” But the rent she pays is determined by inputs like the cost of lumber, because someone has to build and maintain the building (and if she is looking for a different apartment, its rent will be shaped by costs like that).
Things like restaurant meals so people don’t have to cook 29 days per month, or flat-pack furniture so people don’t need to buy lumber and learn basic carpentry to furnish their apartments, are good examples of how a luxury in the USA in 1980 has become expected today. One problem with high inequality is that as expectations rise the lowest-income people can find that nobody is selling things they can afford to meet their basic needs.
Sean, and in a functional economy I would say yeah the price of rent is partly determined by lumber prices… But in a world where we haven’t been making housing in quantity for decades while population is going up, the reality is rent is determined almost entirely by other factors related to scarcity of housing not marginal extra costs of lumber. Even if lumber comes down… Rent is still going up.
But your point about stuff not being available for the poor to buy is very good.
Childcare is a good example because its generally outside the cash economy. In most societies someone in the extended family watches small children and does work compatible with that such as spinning; some post-industrial societies provide carers at taxpayer expense. So childcare can feel like a necessary expense to many parents in the USA, but that reflects how US society is organized and not just universal laws of biology.
Daniel, the cost of lumber is totally one of the factors which developers consider when deciding what to build and how much to charge for the finished building. And that cost will influence rents for existing buildings (which also need to be maintained or the value they provide will decline even if the rent stays the same).
Sean,
Childcare *itself* is a non-optional good/service.
Whether you need to pay out of pocket in cash for it is a question that can vary from place to place based on how it’s provisioned. But, in the US today for single mothers of 2 children, it’s not an option, if it goes up it hurts those people a lot.
Whether lumber affected the provisioning of houses in the past is a good question… Here’s (people) / (housing starts per year)
This is a number in dimensions of time, units of years. The value of this statistic averaged over time is roughly related to the duration that a dwelling needs to remain viable as an active dwelling (housing lifetime) in order for housing to not become scarce. For 1960-2005 shi number was between 100 and 200 years… It then shot up to 600 years and declined back down through time to 250 or so… for 15 years we’ve been relying on every home in america surviving for 1-3x as long as america has been around in order to keep housing from getting scarce… Almost *none* of that time did lumber costs enter into the equation.
https://fred.stlouisfed.org/series/WPS081
Lumber prices spiked after 2020, but from 1995 to 2020 they were basically constant in **nominal** dollars (so declining in purchasing power terms).
Whoops I missed the graph link for the housing duration graph. here it is:
https://fred.stlouisfed.org/graph/?g=1nUCz
> shelter and food and childcare are at a FUNDAMENTAL law of physics way completely different from books, movies, fashion, cell phones, washing machines, curtains, perfume, paint, counter tiles, fancy shampoo… whatever.
For what it’s worth, shelter and food account for 50% of the CPI basket. Childcare for less than 1%.
(By the way, what you called “childcare” in your equally-weighted thing is mostly college tuition… but considering current events it may be appropriate.)
Carlos, yeah I was under the impression that college tuition was a separate category. I should look more carefully at that, but certainly higher ed has become an important part of what people with kids are paying for. I wish the BLS had better more accessible information about those individual series easily linked from the CPI front page… but you really have to kind of be an expert in the topic to know where to look to find out what percentage of the tuition, school fees, and childcare is what. In any case, spending something on your children’s maintenance or future is pretty much an everyday experience for all parents.
Daniel Lakeland: all kinds of costs shape where and what people decide to build. Some are larger than others. It would be good if someone created a way to consider all of these different factors and produce a rough weighted average for different countries, we could call it an index, an index of prices, an index of prices for consumers … a better name is on the tip of my tongue …
Both policy and academic economics get into trouble when they try to track non-market goods and services such as domestic cooking, cleaning, and childcare. Everything is hard to track, economies look very different, and a lot of things we encourage people to do for cash look negative-sum. So while children need to be cared for (we can debate how much) that care does not necessarily belong in the economic realm.
> So while children need to be cared for (we can debate how much) that care does not necessarily belong in the economic realm.
If you think that, you and I have a very different view of the meaning of “economics”. This may not be surprising to either of us, considering that I’m not even sure that Economists really know what economics is about anymore.
But to me a thing is “in the economic realm” if, roughly, it’s a thing that isn’t available cost free in quantities that far exceed the maximum quantity everyone could possibly want to use, and you have to make choices between it and other things.
So, childcare is an economic good because it requires people’s time, and people have to decide whether they will be doing childcare or doing say… computer network administration with their time.
Anyway, as Carlos points out, my “childcare” index may be mostly “and education, especially higher ed” but that’s appropriate as well.
The problem with CPI all-items for me, is that it mixes two concepts that *I* care about.
On the one hand, in the presence of certain causes *most* prices will increase mostly together. This we might think of as “inflation”, and another concept of interest is “what is the cost of maintaining your life against the basic threats of death and bodily harm and despair/suicide/drug addiction/decline?” in other words “the cost of bare living” or even we might go a little higher “the cost of adequately meeting all basic needs without fear”. Roughly a person has met that standard for me if they go to work, come home, eat, can pay for their transport, can pay for their rent, can pay their taxes, can buy and cook their food, buy clothing at replacement rates, and save enough so that when emergencies occur like a damaged tire or they need a brake job or replacement cooking pans that interfere with their transport to work or their ability to cook their food etc they can meet those needs, and basically nothing more. No entertainment, no nights out with their friends, no fancy cell phone plan or 3 different streaming services or gourmet ingredients or dinners out… ever.
If inflation causes all goods to rise and you’re a person who makes well above the cost of bare living, then it’s an annoyance. You must give up your gym membership or not take a trip to the beach or eat out at fewer restaurants…
If the cost of bare living goes up and you are barely living, then you must maybe ask your kids to steal extra helpings of the free lunch at their school to eat secretly or yourself go to bed hungry because you’re giving your kids most of the dinner, or maybe even worse but for some people, letting your kids go to bed hungry… Maybe you start to drown your sorrows in cheap alcohol. Maybe you stop being able to perform adequately at your job and lose your job… a spiral downwards starts.
Those are just vastly different consequences and they result in vastly different societal outcomes. When we ask “are people doing well” and we answer it by saying “more restaurant meals are being eaten” ignoring the fact that this is because people at the 75%tile are doing well and are eating out more than before the pandemic, while also ignoring the fact that people below the 35%tile are literally sending their kids to bed hungry and were never eating restaurant meals anyway or whatever… we do a terrible job of analyzing the situation.
So I want to emphasize the distribution of outcomes, and the cost of the critical things at the base of the hierarchy of needs, and ask if we look at incomes relative to things that are very basic in those hierarchy of needs, have incomes gone up or down? And consistently what I see is that people in the middle to lower half of incomes are seeing *declines* relative to the costs of those needs. Restaurant meals and airplane tickets and vacation costs and luxury handbags and bathroom remodels and gaming computer upgrades and soforth are just *not relevant* for the question at hand in my mind.
The uniform-weighted CPI index I created isn’t perfect, but it’s more relevant to the question of how well people near the limit of basic needs are doing in my opinion. One thing uniform weighting does is emphasize that there’s certain minimum quantities of most things and you *can’t* substitute between them, whereas people doing much better *can* substitute between many of the things they buy which leads to “market weighted” indexes being more relevant to them.
The fact that many economists act as if there were *one true* index of inflation that answers all “real” questions is a strong indicator that they are not really serious people. It’s worse than that, because if you ask them detailed questions about the CPI during Econ 101 lecture they’ll all bring up all the difficulties of measurement and etc… but then when you ask them at a surface level “are people doing better” in a Washington Post op-ed they will immediately look to the “official real median income” or whatever ignoring all the caveats they put in during their Econ 101 lecture in the 5th week.
IMHO to be a serious economist you have to consistently take into account:
1) The full distribution of the human condition matters
2) The fact that everything that matters must be a dimensionless ratio
3) The fact that everything occurs dynamically through time and different effects occur over different timescales, some of which are literally milliseconds (high frequency trading) and some of which are literal decades to a century (the effect of the housing production rate curve I linked earlier)
4) Because of (3) the world is *never* in equilibrium
5) Geography and spatial variation matters
6) Policies and politics affect different groups very differently. Just because a policy is supposed to do X to group Y doesn’t mean it is doing it, and doesn’t mean it’s also doing X to group Z.
These are just some of the problems that I see in Econ articles every day in the news.
Daniel Lakeland: this thread is about whether the US Consumer Price Index is a good metric for poor Americans’ cost of living. I think that once we consider non-market goods and services the CPI is not a great measure, because by definition its for the prices of goods and services in the market realm. But if we were trying to consider changes in all kinds of resources available to low-income Americans, this would be an even more complicated thread! Its a very common observation that increasing your cash income can make you feel worse off if it takes away time you devoted to activities outside the market (or comes with expenses like the need to maintain a car and buy and clean nice clothes).
In the case of your single mother in Chicago, her life will be very different depending on whether she lives close to relatives who can help with childcare outside the market. People often migrate between places with lots of opportunities to earn cash and places where they can access support outside the market as their needs change.
Sean, I don’t disagree with any of what you said. It boils down to “if you can get childcare provisioned without cash you are less sensitive to the price of childcare”. Yes. True.
Many people do get their childcare through intergenerational households and care. Others though don’t. If you are the single mom buying childcare, and then its price goes up you may choose to quit your job and “move back home with mom and dad” and take a worse paying job. When you do this, the number of households goes down by 1, the average size of households goes up, the avg income of households goes *up*. The GDP goes *down*. Grandma may enjoy the time with the kids, or may feel stressed and tired and have a shortened lifespan. Mom may be able to save a little more money and maybe feed the child more, but may have worse mental health and maybe worse prospects for finding a partner who might help take care of the children and household. Lots of things could change. Whether it’s a good thing or not is more or less up to asking the mom and grandma and grandpa what they think. When they tell you “we’re stressed and feel like it’s the best we can do of a bad situation, things are just so damn expensive these days” for you to then write an op ed saying “Gee people are dumb they don’t even know when they have it so good, eating out at restaurants is UP!” would be bad form and intellectually dishonest. Yet, this article seems to hit a different news outlet every 3 to 5 days for the last 4 months.
I rarely come to the support of my fellow economists, but I think they deserve better. If you review the various papers produced by economists at BLS, you will see that they have grappled with measuring and including non-marketed goods (such as home child care) in price indices. They are not blind to the realities, but it is not a simple problem.
Daniel, I find your comments far too broad and generalized. It’s fine to talk about wanting to measure “the cost of bare living” but I think you have invented an alternative reality. The Consumer Expenditure Survey has some very interesting data about household expenditure patterns by different demographic and economic characteristics. I wish it were more granular, but you will find that the poorest 10% of households still spend considerable sums (on average – of course there are exceptions in Lake Wobegon) on entertainment, cable TV, etc. I don’t deny that all people should have an opportunity to recreate, but it is misleading to paint a picture that the poorest households only spend money on “bare living” though some surely do just that. But there are also poor households spending money on things well beyond “bare living.” So, I think you are inventing an index that does not represent the reality, but instead is a straw (wo)man designed to prove that the poor can’t keep up with inflation. I do think you are guilty of knowing the answer you want and then inventing measures to prove that.
Don’t mistake me for saying that the poor are doing fine. I’ll leave such things for chipmunk et al to say. I share concerns about inequality, concentration of economic and political power, and the difficulties faced by many people in our rich society. But I don’t think it is constructive to paint the extreme picture – despite all of the efforts that go into trying to develop meaningful measures of prices, income, and wealth – that economists are blind to reality and that their attempts are totally meaningless.
If you want specific references, you could start with https://www.bls.gov/cex/consumption/research-on-consumption-related-to-home-production-activities.htm. I’m not advocating that these efforts are ideal, but they do paint a picture that the economics profession is not buried in the sand and ignoring reality (though I still think credit cards are part of the money supply).
We don’t have to choose between the (basically strawman) depiction of economists as arrogant elitists who erroneously say that people are too stupid to know what they’re really experiencing, and, people being too stupid to really know what they’re experiencing.
I think more likely it’s a combination of many people being affected by various distorting influences in their perceptions, economists being influenced by their own biases, and an inherently difficult task of measuring a complex reality.
Dale mentioned one of the biases somewhere above – a negativity bias. That’s not some obscure or rare phenomenon. It happens a lot with most people. Clearly the strong political signal in perceptions of the economy suggests a role for ideological biases to come into play. And certainly we have tons o’ evidence of analysists being overly confident in the validity of their metrics for understanding reality. I don’t know if there’s a named bias to describe the pattern where people get overly confident in a metric basically because it gives a number which gives a feeling of being able to measure reality, but if there isn’t there should be, because it’s ubiquitous.
> (though I still think credit cards are part of the money supply)
Do you consider non-bank loans in general to contribute to the money supply?
When Apple sells bonds for several billion dollars to investors does the money supply increase?
Carlos
I don’t pretend to know answers to questions such as you ask here. My inclination would be to say that when Apple sells bonds to investors that the money supply has not changed. The existing money supply is just being transferred from one party to another. I view credit cards as different because the credit card holders have considerable discretion over how much of their credit they use (albeit being loosely constrained by interest rates). Nonbank loans, as a category, I’m not sure of. The thing about bank loans that is unique is that fractional reserve banking is what allows banks to expand the money supply or contract it (although one limitation which has always been recognized is that banks have discretion over how much of their ability to “create money” limits the effectiveness of traditional monetary policy – for example, if the economy is in a recession, loose monetary policy is supposed to lead to expanded economic activity, but if banks can’t find credit-worthy entities to loan money to, then such policy may not be effective).
So, my summary would be that the money supply is best thought of as what is available for people/businesses to use to make purchases – clearly currency counts, bank deposits count, I’d say credit cards count to a degree, and non-bank loans may also count (depending on the particular instrument and how it is being financed). The Apple example doesn’t strike me as a good candidate. But, as I say, my confidence in these things is rather low.
When they use the credit card existing money supply is just being transferred from one party to another (unless the lender is a bank bringing reserves back into the money supply).
It seems though that you are talking about unused credit being part of the money supply. Then maybe we should consider as well the hypothetical personal loans that each person could get, the value of all assets that could be mortgaged, etc. as part of the money supply.
I believe the traditional answer that credit cards are not part of the money supply stems from viewing credit cards as a transaction technology that allows the money supply to be used more efficiently – but no new money is created since the balances need to be paid off. My divergence from that view stems from the fact that people can easily choose to use more of their credit lines or less, depending on their feelings and needs: so, for example, if the FED uses tight monetary policy to try to reduce inflation, but people are optimistic and want to spend, they can undermine the FED’s efforts by running up higher credit card balances.
I suppose other credit lines might be treated similarly, as you are suggesting. I do think there is some difference, however. Using a home improvement load, for example, is a discrete decision that is made with full awareness (I believe) of the interest rate involved. So, such decisions are directly impacted by FED policies. But making credit card purchases that you may not pay off at the end of the month seems much more continuous to me and made at arms length from the prevailing interest rate. So, I view these decisions as less tightly linked to FED policy.
That’s my take, for what its worth.
> no new money is created since the balances need to be paid off
The question is not whether the balances need to be paid off. Bank loans need to be paid off and they add to the money supply.
You can of course define money as you wish but it’s interesting that with your definition making use of the credit line would destroy money (unless the lender is a bank).
Bank loans need to be paid off, but the reason they are key to the money supply is due to fractional reserve banking – the bank only keeps a portion of any deposits and by loaning out the rest, that becomes bank deposits somewhere in the system and part of the money supply. Similarly, if I use my credit card to make a purchase that I don’t pay off at the end of the month, then that purchase becomes part of somebody’s bank accounts that is not offset by a reduction in my bank balances (at least not immediately), thereby becoming part of the money supply. If I purchase a bond issued by Apple, my account is depleted upon the purchase, so money is not created by transferred.
For me, the ultimate question is whether the overall ability to make purchases of goods and services is increased. Fractional reserve banking allows that to happen. Non-bank activities may also allow that, though I think it depends on the particular activity in question. I only single out credit cards because I see large unused credit lines, many credit card balances that are not paid off each month, and a large discretionary element to their use – that may deviate from what the FED is trying to do.
Dale,
Measuring an index of “bare living” doesn’t mean “the poor” are all universally at that level, it just means we now know about where that level is. Someone who can get that bare living level and then also eat out occasionally or stream movies or play video games or whatever is living *just a little above that level*. They’re still poor, but they’re not desperately poor. But also, relevant to your point a lot of people rather than saving the required amounts to be able to afford the “shocks” (which is built into my concern of bare living) utilize credit cards to absorb shocks. So they’re subscribing to cable TV and buying video games or eating out or whatever, but when they didn’t budget for that brake job suddenly they’re paying $800 off a credit card and carrying a balance at 19% interest or whatever so they can get to work. Americans carry around a trillion dollars in credit card debt https://fred.stlouisfed.org/graph/?g=1nVBI that shows just “large banks” and it’s at 920 Billion.
The thing I’m raging against most… is not really what academic economists say deep in academic papers, it’s stuff like what the Ronald Coase Chair in Economics at the LSE said in Newsweek this week: “It’s ironic, because, compared to other advanced countries, the U.S. is doing fantastically well in terms of growth”
https://www.newsweek.com/economy-america-outlook-biden-1896902
This kind of cheerleading is super common. Here’s the FT doing it:
https://www.ft.com/content/ec6686ce-0b8b-4d21-a75f-a26e353fe587
“Such doubts over the economic record of the administration are surprising. Comparatively, the performance of the US economy has been a triumph. According to the IMF, GDP per head in the US will rise by 8.3 per cent between 2019 and 2024, despite the pandemic. This is far better than in any other large high-income country. In the UK, the comparable figure is minus 0.2 per cent. (See charts.)”
Not even a whit of humility about the idea that **maybe just maybe** the GDP/capita doesn’t measure what matters to everyday Americans? And maybe just maybe in the presence of an M2 money supply that grew 31% since the pandemic hit that 29% nominal GDP per capita growth isn’t much to be excited about?
The problem I have is that economists keep making absolutely meaningless cheerleading soundbites or even entire op-eds when an intellectually honest take would be something along the lines of:
“People are really upset about the economy, and aggregate measures we’re used to quoting in the news don’t really explain why. We should probably be looking at things like changes in median checking account balances, number of people who are moving in to their parents houses, number of people who are out of the workforce due to having to provide childcare at zero monetary income, and a 50% rise in total credit card balances since 2021 as signs that the economy that everyday people experience is not necessarily performing in the way that aggregate statistics intended to measure the well being of industrialists, bankers, and other rich investors would have you believe”.
But I dare you just try to find that kind of statement in the news anywhere.
This is getting to be a long post, so I’ll comment on the credit card / apple loan money suppply issue separately.
Carlos asks the question: “When Apple sells bonds does it increase the money supply?”
Let’s just define the money supply as M2 to see what happens to that measure when Apple sells bonds. https://en.wikipedia.org/wiki/Money_supply has a checklist of what’s in each money supply statistic.
Apple sells bonds to banks, they use reserves to buy the bonds transferring Reserves into Apple’s checking deposit accounts. M2 doesn’t include reserves and does include Apple’s demand deposits. So, yes, the money supply goes up. Namely, there’s more money available to consume goods and services (one assumes that banks don’t consume things with reserves, they only invest them in various investment vehicles which is why they don’t count as “Money supply” in the M2)
Ok, now, Alice buys new brakes for her car with a credit card and pays only the minimum this month. Did the money supply go up?
The car repair place has cash in their deposit account from Alice… so that went up. Did any deposit account balance of Alice’s go down? No. So Alice’s credit card lender *manufactured money* which was transferred to the repair place. So the money supply went up.
Am I missing something? Is this not just as straightforward as “did the volume of water in the sink go up when I turned on the tap?” kind of calculation. And why on earth is it even the slightest bit controversial or do literal Economics Professors have to have any confusion about this idea?
Now, you might want to argue that M2 isn’t the right measure of money, and maybe we can have that argument a bit… But if we agree that “money is what individual people and firms can use to make final payment for goods and services” then it has to include checking accounts obviously and it has to NOT include bank reserve balances used exclusively to transfer between banks or between banks and the central bank.
Some assets are very clearly NOT money. You can’t take an Apple bond certificate and directly buy an iPhone with it at the local Apple store. So a bank which owns Apple bonds in its assets doesn’t have money… But **it is allowed to use the Apple bond as an asset** for the purposes of deciding whether it can write loans. So when it says “hey no problem you need $10,000 we have lots of Apple bonds backing our lending, and you just signed the loan papers so here’s $10,000 in your checking account” they *manufactured money supply* from Apple bonds. They made M2 go up…
If they get into a liquidity crunch they can either sell Apple bonds to another bank and use the proceeds as reserves to transfer to other banks, or they can sell the Apple bonds to The Fed who will give them newly manufactured reserves.
Now, let’s take a look at a relevant dimensionless ratio for consumers:
lifetime * GDP / M2
Where lifetime is an avg lifetime, for our purposes let’s call it 80 years, although it’s changed dramatically since 1900, it hasn’t changed dramatically since 1960 and that’s as far back as the data I’m going to link goes.
First, is this dimensionless? Yes years * (dollars/year) / dollars = 1
So it has a chance of being relevant unlike many things quoted by Economists, like GDP which has dimensions of dollars/time.
What does it mean? More or less it’s the total count of transactions that a dollar goes through in a person’s lifetime, so it measures a kind of total spending that’s going on of the available money. If money accumulates into wealthy people’s hands and sits their “exercising political power” but not actually being used to produce or pay for economic goods and services, then we will see this thing decline. Since the 80 years is just a constant I’m going to leave it off, and throw up the fred graph, I probably shouldnt’ do that if I get more data and can project this back to 1800 or something when lifetimes were much shorter.
https://fred.stlouisfed.org/graph/?g=1nVFI
Now between 1960 and 1990, a period widely considered to be a productive period for the American economy when everyday people got richer, this number was essentially 1.8 plus noise… During the Clinton administration this number rose to about 2.15 because Clinton ran surpluses and the money supply stayed more or less constant while GDP increased. Then from 1995 to 2000 this stayed constant at a new level. Then Bush was elected 9/11 happened and the dot com bubble burst, and we started printing money. The money we printed didn’t go towards increasing economic activity that led to production and consumption of goods and services, it led to financialization of friking everything. Sure, for a few years between 2003-2006 we built some houses and caused some activity, but in a very unstable way and in 2008 we took a big hit, and then printed money like nobody’s business causing a long decline from 2010 to 2020 where things fell off a cliff stayed constant for a little while, and started to recover in 2022-2023 back to the horrible level they were at before the pandemic.
Meanwhile, while smoking an enormous blunt on TV Elon Musk, the worlds richest man (in public wealth, Putin and Xi are a different question) puts together 46 Billion dollars to buy Twitter and run it into the ground as his personal propaganda machine, Donald Trump actually ran the damn country, some rich fucks are tracking the literal GPS location of every single american in real time, and you can’t buy anything if it isn’t imported from China and delivered through Amazon.
Now, the velocity of M2 money isn’t exactly everything, but it’s not exactly nothing either. It’s objectively the case that if a person is growing their own food and providing their own childcare and manufacturing their own clothes on a homestead in the middle of nowhere and holding $10k in the bank, that their money is not being utilized in a way that enables exchange to improve efficiency. They may be very good at a lot of stuff, but they can’t possibly be as good at all of it as a group of 100 people exchanging that money between them while each one does a specialized task in a more efficient manner.
So M2 velocity measures something, and more of it is generally better for everyday people than less of it at least within the range we’ve seen in the last 65 years. And we have suppressed that velocity for my entire adult lifetime, and now we have Vladimir Putin, Elon Musk, Jeff Bezos, Bill Gates, Saudi Princes, etc etc all sitting on piles of assets utilizing their wealth as bargaining chits to control geopolitical and geo-economic policies rather than production of goods and services.
But according to London School of Economics named-chair professors things are all right, this is fine!
https://knowyourmeme.com/memes/this-is-fine
Economists should be ashamed.
Daniel
Carlos asked “when Apple sells bonds to investors…” and my response envisioned those as private investors who wrote a check from some account in order to purchase the bonds. Your example of selling bonds to banks is different and I agree with your discussion about that (although I’ll admit that I have no idea whether banks can purchase corporate bonds or not). So, I think we agree about both examples – Apple bonds and credit cards. The reason the latter is controversial in economics textbooks is – I believe – because there is an implicit assumption that the credit card balance is paid off in full every month. The usual case of economists believing their assumptions rather than reality.
To continue this subthread a bit more (perhaps more than anybody wanted): Daniel, you say economists should be embarrassed. I probably agree, but for completely different reasons than you seem to suggest. Your concern seems to be on the interpretations that the US economy is doing well in terms of growth while surveys keep showing deep malaise in the population. Concerning those two observations, I think I agree with the economists. I would prefer not to use the word “well” since the US economy doesn’t work well for a large number of people, and hasn’t for a long time (perhaps forever). Not that I can easily think of an economic system that works better (although the Nordic model has a great deal of appeal for me). But in terms of the COVID and post-COVID era, the US economy has been relatively healthy (notwithstanding the fact that it has been and remains highly unequal). I really don’t think the surveys are revealing that economists and their measures are out of touch with reality. I think the surveys are picking up things other than reality – tribal alliances, misperceptions, media influences.
The examples you love to point to – households barely surviving paycheck to paycheck, basic needs eating up more than available income, unrecorded economic activity, never-ending debt cycles, expanding wealth at the top end of the distribution – are all too real and bother me greatly. But I don’t believe these things have generally gotten worse over the past 4 years. The things that I think have gotten worse: gun violence, global security, environmental protection (globally), American (and probably elsewhere) politics. In fact, the economy is a relative bright spot compared to those. Now I’m starting to sound like chipmunk (so I’ll stop).
> So Alice’s credit card lender *manufactured money* which was transferred to the repair place. So the money supply went up.
It did if the credit car lender is a bank. It didn’t if the credit card lender is not a bank. If the transfer went from the lender’s account to the repair place’s account the money supply has not changed.
> And why on earth is it even the slightest bit controversial or do literal Economics Professors have to have any confusion about this idea?
I don’t think that’s controversial! Is that what you meant by “the standard theory not accounting for credit cards”?
Apparently the problem of Dale Lehman with the standard treatment of credit cards is not about the impact on money supply when they are used – it’s about the impact on the money supply when they have not even been used yet.
> Similarly, if I use my credit card to make a purchase that I don’t pay off at the end of the month, then that purchase becomes part of somebody’s bank accounts that is not offset by a reduction in my bank balances (at least not immediately), thereby becoming part of the money supply.
Where does the money that appears in somebody’s bank account come from? (Hint: Somebody else transferred that money from some account to that somebody’s account.)
Carlos
You raise a good point, but I think it is far from clear. Say I charge something from my credit card – issued by a bank – to make a purchase and I don’t pay off the balance at the end of the month. The credit card issuer (the bank) put that money in a vendor’s account. Where did it come from? You are suggesting it had to come from someone else’s account, so it is a transfer. What I believe happens is that the vendor’s bank account suddenly shows a credit for the amount of my purchase. That vendor can then write checks on that account to make other payments – the bank only need hold fractional reserves based on the liabilities which have now increased. So, money has been created. This is how fractional reserve banking works – it is impossible to withdraw all the money from all these accounts at the same time – there isn’t enough money to do that. But as long as banking system withdrawals and deposits are roughly in balance, there is no need for my purchase to have been withdrawn from an account – it becomes a balance that I owe and don’t pay off at the end of the month. In a sense, it is coming out of my account – but not until I pay it off. This is why I believe economists take a view that credit cards are not money – eventually, they have to come out of an account. My point is that in the short run (shorter than eventually), people have discretion (via the use of their credit cards) that might undermine FED efforts to control the money supply.
Dale, your defense of economists relies on a very short duration timespan… the last 3 years say. Whereas what I’m talking about is the major problems created starting at some point between 1995 and 2001 which have accumulated into a hellscape for many people.
Here’s an economist I consider to be a hero… https://www.politico.com/news/magazine/2021/12/28/inflation-interest-rates-thomas-hoenig-federal-reserve-526177
“In 2010, Hoenig was president of the Federal Reserve regional bank in Kansas City. As part of his job, Hoenig had a seat on the Fed’s most powerful policy committee, and that’s where he lodged one of the longest-running string of “no” votes in the bank’s history. ”
“But this version of history [that Hoenig was mainly an inflation worrier] isn’t true. While Hoenig was concerned about inflation, that isn’t what solely what drove him to lodge his string of dissents. The historical record shows that Hoenig was worried primarily that the Fed was taking a risky path that would deepen income inequality, stoke dangerous asset bubbles and enrich the biggest banks over everyone else. He also warned that it would suck the Fed into a money-printing quagmire that the central bank would not be able to escape without destabilizing the entire financial system. ”
Hoenig was right, he was right about everything and it had already been going on for like 10 years when he was complaining about it…
You may be right that people perceive themselves worse off now and complain even though maybe for the last year or two things have been actually improving… but what you fail to really acknowledge is the true thing that Economists (other than Hoenig) should be ashamed of, which is that they almost unanimously drove us into decades of crap policy through control of The Fed and advising the federal govt and policy in general in ways that directly stoked inequality and drove the standard of living *downward* for median and below income people for much of the period from 2000-onward
I’m not sure where I’ve posted this particular graph but here’s another dimensionless ratio of interest:
Population /(k * housing_starts_per_year * house_longevity)
Let’s say that k is family size, which has been fairly stable it 2.5 people/house ish for about 20 years, and that houses are built to last about 80 years without major repairs…
This is a dimensionless ratio, so let’s take a look at it. If this number is below something near 1 then more houses are being built than are crumbling to dust and housing stock is rising. If it is at around 1 it’s staying constant (per person), and if it’s above 1 then houses are crumbling (or people are being born more quickly) faster than they’re being built, so houses per person are going down…
https://fred.stlouisfed.org/graph/?g=1nVOl
For the entire period from 1960 to 2005 this statistic was at or slightly below 1. We can guess that maybe 80 years is just a guess and maybe it should be closer to 70 or whatever, and the steady state average in 1960-2005 was probably a fairly healthy situation.
And then 2006 hit, and things dried up, and 2008 there was a massive jump… and this went to 3.0 which means that housing was getting scarce at dramatically faster a rate than **ever before in history* maybe 2x as much as the next highest peak in this statistic. and then over the next 15 years or so it’s exponentially decayed back but to a new trend that seems to be above 1.0 meaning we’re still basically losing housing.
Now what this means is that we had more or less equilibrium plus fluctuations for 45 years, and then we had a massive transient which has taken more than 14 years to even begin to equilibriate…
“BUT EQUILIBRIUM” the economists will shout… And they should be ashamed.
> The credit card issuer (the bank) put that money in a vendor’s account. Where did it come from? You are suggesting it had to come from someone else’s account, so it is a transfer.
The lender could be a non-bank – the money that the vendor gets could be already part of the money supply. Or it may be a bank that it’s “creating” the money giving you a bank loan. And maybe they later take that loan out of their balance sheet, securitize it and sell it to investors.
My point is that whatever is the impact on the money supply (as usually defined) is already taken into account in its definition. If there is a deposit where none existed the money supply has increased. If the aggregate amount of deposits stays the same the money supply has not changed.
Credit card loans are indeed complex but do not seem different in this regard from auto loans or mortgages.
Lines of credit are not the only thing “missing” in money supply (and if you care about what is available for people/businesses to use to make purchases essentially any asset that can be sold or pawned counts!). Non-bank lending and loan securitisation also distort this “transmission mechanism”. In the end the Fed doesn’t seem to care that much about money supply and – for better or worse – it abandoned years ago the search for broader measures.
Wow this subthread is getting really long. Here’s some info on the Apple Bonds question, and some on the credit card question:
I had a question as to what assets banks actually hold. I mean in theory they could hold on to anything, but in practice there are regulations and the regulators also would value different assets differently. Volatile ones would not make you eligible to lend against the full current dollar value presumably.
It’s shockingly hard to find this information, like a list of what kinds of assets banks can invest in. The best I could do was interpreting stuff by looking at this and all the footnotes.
https://www.federalreserve.gov/releases/h8/current/
In Table 2 I’m going to list some values from the first column April 2023 because it’s easy to read them off looking back and forth between two windows.
There are a total of 5.25 trillion in “Securities in bank credit” which basically means securitized loans.
Other securities is 1.12 trillion. This includes in “non-mbs” footnote 7: “…investments in mutual funds and other equity securities with readily determinable fair values”
Other assets including trading assets 1.83Trillion: (line 32) which I think is things like ETFs and stock held in trading accounts
There are a number of other interesting tidbits in the footnotes.
I’m really not clear on whether corporate bonds are something banks can hold directly. Perhaps in their “trading assets” or whatever that’s allowed. But they are definitely allowed to hold Asset Backed Securities (a general term that includes Collateralized Debt Obligations). Essentially that’s a combined group of bonds put together. It makes some sense to have banks only holding these diversified assets rather than building their own diversified bond portfolio. So basically bond trading firms are creating these ABS and selling to banks.
1.56 Trillion in non-MBS asset backed securities are on the books of banks.
So, as far as I can tell, when Apple sells bonds they can be converted to money via a chain:
Apple — Bond traders — Asset Backed Securities sold to Banks — Lending by banks against ABS assets on the books of banks — Cash
In addition during panics etc some central banks have had regulations allowing them to buy up corporate bonds in exchange for “base money” created out of thin air.
https://www.marketplace.org/2020/06/16/the-fed-starts-buying-corporate-bonds/
Dale’s question of whether *available credit* on a credit card “is money” is answered by asking “what is money” in terms of a formal definition. For the most part M2 is what is meant by money, so when you *buy* something with a credit card issued by a bank, that bank lends you money and it winds up in a deposit account at the vendor, and so money is created at that moment.
What happens when you take out a credit card and they give you $10k available balance? Clearly you can buy up to $10k with that, but that $10k isn’t “circulating” until you do buy the goods. It’s reasonable to me to say that credit card available balances are not yet money, but it’s also reasonable to me to say that they “are money” in some broader definition. Presumably if a pandemic hit or whatever and everyone tried to max their credit cards and buy stuff or gold or banknotes, banks would just refuse the transactions, and so it’s definitely not *all* money.
Daniel
Well you’ve strayed far from the original post. The original post had to do with recent events – the state of the economy and public perceptions of it. Bringing in long-term issues with economic policy muddies the waters, in my mind. I may not disagree with you about the long history but I don’t think this is the place for a lengthy discussion of that.
For those still interested in these topics we can say that the money multiplier theory of banking has been demolished empirically, here is “the money multiplier” a quantity that standard economic theory treats as a fairly constant quantity that allows The Fed to control the money supply by retracting or adding reserves.
https://fred.stlouisfed.org/graph/?g=1nW3K
Pre 2008 this number ranged from 100-180, it dropped like a step function to about 10 after 2008
Now, you could convince me this was a change in definitions or a data quality problem I suppose, but I doubt it. Money multiplier theory is a bankrupt idea.
@Daniel
What is the relationship between the data in your chart and this one: https://fred.stlouisfed.org/series/TOTRESNS
> “the money multiplier” a quantity that standard economic theory treats as a fairly constant quantity that allows The Fed to control the money supply by retracting or adding reserves
I don’t know about “standard economic theory” but even the wikipedia knows that the Fed doesn’t try to control the money supply using that “money multiplier”: “Historically, some central banks have tried to conduct monetary policy by targeting the money supply and its growth rate, particularly in the 1970s and 1980s. The results were not considered satisfactory, however, and starting in the early 1990s, most central banks abandoned trying to steer money growth in favour of targeting inflation directly, using changes in interest rates as the main instrument to influence economic activity.”
This is from a speech by the chairman of the Fed in 2007: https://www.federalreserve.gov/newsevents/speech/bernanke20070615a.htm
“Historically, monetary policy did appear to affect the supply of bank loans (at any given level of interest rates). In the 1960s and 1970s, when reserve requirements were higher and more comprehensive than they are today, Federal Reserve open market operations that drained reserves from the banking system tended to force a contraction in deposits. Regulation Q, which capped interest rates payable on deposits, prevented banks from offsetting the decline in deposits by offering higher interest rates. Moreover, banks had limited alternatives to deposits as a funding source. Thus, monetary tightening typically resulted in a shrinking of banks’ balance sheets and a diversion of funds away from the banking system, a phenomenon known as disintermediation. The extension of credit to bank-dependent borrowers, which included many firms as well as households, was consequently reduced, with implications for spending and economic activity.
Of course, much has changed in U.S. banking and financial markets since the 1960s and 1970s. Reserve requirements are lower and apply to a smaller share of deposits than in the past. Regulation Q is gone. And the capital markets have become deep, liquid, and easily accessible, either directly or indirectly, to almost all depository institutions. Although the traditional bank-lending channel may still be operative in economies that remain relatively more bank-dependent, as recent research has found for some European countries (Ehrmann and others, 2003), in the United States today it seems unlikely to be quantitatively important.”
Anoneuoid:
My graph is M2 divided by that quantity you mentioned. And yes, you can see the govt basically bought up crazy amounts of bonds converting bonds to “reserves”. In the “fractional reserve” theory of banking, where “banks take in loans, keep some fraction of them in reserves and lend out the rest”, through time by multiplying reserves by a factor of 10 like what happened in 2008, you would have seen eventually M2 increasing by a factor of around 10. You might expect a transient, with banks deciding when to loan out stuff at different times and different amounts but “money in the system” would always be “some fairly constant multiplier times the reserves” if the “money multiplier theory of banking” which is taught in **every macroecon textbook** were true.
Carlos, the above is a real theory of “standard economics” it’s right there in Mankiew’s Macroeconomics textbook on page: 486-487 in which it discusses the “money multiplier” theory and continues to discuss “three instruments of monetary policy” after that. Presumably in this theory the money multiplier is something kind of closely related to the reserve requirements imposed by the Fed. Presumably because most banks would lend until they were fairly close to the reserve, not keeping very much “extra reserves” because they’d be leaving profit on the table so to speak.
Further discussion which is in line with what I’ve read in general is available at the wikipedia article on the money multiplier theory https://en.wikipedia.org/wiki/Money_multiplier
You’re right that The Fed doesn’t target particular quantities of M2 anymore, it targets interest rates. Part of the reason for that is that **The Fed has little to no control over the money supply** a fact which also goes completely against “standard economic theory” which says that “the fed creates money” primarily through the open market operations which increase or decrease reserves and that would eventually through some transient increase or decrease money supply. But that’s false, as seen in my graph where reserves changed by a factor of 10 and nothing comparably important happened to the money supply it smoothly increased for another 14 years until the 2020 pandemic.
This is all nonsense. It’s **Deficit spending** that creates “latent money” in the form of Govt Bonds which is converted to deposits by bank lending. In essence, banks that have govt bonds on their assets can lend against them, creating money in deposit accounts. Also people who have bonds can put them up as collateral and then banks can lend to them. Ignoring the time delay between the deficit spending and the lending, in essence Deficit spending creates money. Which is why The Fed has no control over the monetary quantity. In fact, what has a “fairly constant” ratio is M2 to total public debt (the sum of all deficit spending). That’s this graph which is between 0.6 and 1.6 since 1980 (the whole range of available data)
https://fred.stlouisfed.org/graph/?g=1nWdQ
Does The Fed even control interest rates?
https://fred.stlouisfed.org/graph/?g=1nWej
Before 1991 the bank prime rate minus the federal funds rate was kind of a random walk averaging around 1% difference plus or minus 1, after 1991 it’s essentially a constant 3% difference to 2 decimal places. What exactly happened I’m not sure, but the most reasonable prior guess on my part is regulatory capture and collusion. At some point banks figured out they didn’t need to compete because they could all get rich by charging the same exact 3% above the cost of borrowing from the fed to keep their reserves up. This was probably especially made easier by consolidation. How many banks do you have to put together before you’ve got a majority of the assets? It’s probably like 5?
https://en.wikipedia.org/wiki/List_of_largest_banks
Largest american banks listed are:
JPMorgan Chase,BofA, Citi, Wells Fargo, Goldman Sachs, Morgan Stanley, Those put together make up 14 Trillion in assets. According to https://www.federalreserve.gov/releases/h8/current/ the total bank assets are about 22.8T so 61% of bank assets are in 6 companies…
Or to put it another way, because childcare is mostly a non-market service, I think treating it as a fundamental component to a Lakeland Price Index would mix up some quirks of US society in 2024 with those basic biological needs. The amount of childcare which people buy on the market varies much more than the number of calories they consume.
There are books which try to estimate incomes in world history in liters of barley, but I never read one which tried to include the cost of childcare because its a different kind of production and consumption.
Sure, now I think I see your point, Childcare purchased via the market is way more elastic because of the possibility of substituting with childcare provisioned by non-market, than calories consumed or square footage of climate controlled housing or transport to and from school + work. In some sense then, Carlos’ point about much of the childcare portion of the index actually being education is relevant. I don’t think we can quite as easily just say “heck with it, let’s not teach kids anything”. Especially at the moment, with higher ed being practically required to get even basic jobs, and the cost of higher ed needing to be saved for earlier and earlier if the parent will provision it, or being paid over long terms via loans if the child pays…
an interesting question is how does “childcare+education” compare to the other three components… heres’ cpi childcare + education / (rent + food + transport)…
https://fred.stlouisfed.org/graph/?g=1nUUd
In fact, childcare+education declined relative to the other three since 2020 so is not responsible for the recent decline in “real income according to Lakeland”
https://fred.stlouisfed.org/graph/?g=1nUUI
shows all 4 lines with the reference date 2019-01-01. Education/childcare really climbed most over a long duration (like since 2000), but relative to 2019, the ones that are impacting people today that would make them say “things hurt right now” are rent, food, and transport, all of which spiked rapidly starting right about the point in time Biden took office (not because of him I don’t think, more because of decades of conditions piling up and then getting triggered by Pandemic issues, but people will associate it with that timescale).
So, I think we’ve come to a consensus here that childcare is the least important component for the explanation about why people’s perceptions and economists perceptions in the mainstream media have diverged.
Rent and mortgages (but that is even more complicated because the USA has those crazy long fixed-rate mortgages, and a carpenter in small-town Tennessee who got a fixed-rate mortgage in the USA in 2018 is sitting pretty unless they had to move outside commuting distance; so is someone who owns their home free and did not borrow to buy another property)
Yeah, I chose Rent specifically because mortgages are more complex. Also because the people we’re more concerned about, people living “on the edge of solvency” etc are mostly renters I believe.
Ok, I did not know that you were focused on the poorest 10% of the population. It seems to me that the condition of the poorest in a rich country will be more influenced by the social safety net than the buying-and-selling market economy, just like the condition of the richest will be more influenced by taxation.
I don’t think of it as a fixed percent. I think of it as a scale of income significantly below which you are “certainly in trouble”, then you can measure Income / Scale as a dimensionless ratio, let’s call that I* for “dimensionless income” and you can ask questions like “what fraction of people are I* below 1” or “in the last 6 months, how did the distribution of I* change and how many people moved below 1” or similar.
I found this:
‘Americans were miserable in 2023. The University of Michigan’s consumer sentiment index sat one standard deviation below its historical average in December. This happened while inflation declined significantly over the year, and the unemployment rate remained low, which would traditionally have presaged an uptick in sentiment (Figure 1A). Instead, there was a two standard deviation gap between predicted and actual consumer sentiment. Economists, the authors included, raced to find reasons for this discrepancy. Explanations for this anomaly have ranged broadly from arguments about the lagged effects of inflation to suspicions that partisanship and “vibes” lay behind this startling gap (e.g. Cummings and Mahoney, 2023a). Others have highlighted the importance of “salient prices” – especially grocery and gasoline prices, which behaved erratically over the Covid era – to explain consumers’ disappointment with the recent positive economic numbers. Many of these hypotheses and others have been absorbed into the “referred pain” hypothesis, which suggests that non-economic concerns may now drive economic sentiment.
In recent work (Bolhuis et al., 2024), we argue that many of the recent explanations overlook a crucial mechanism that was better appreciated by economists and policymakers in the past: increases in the cost of money…
Thus, last year as interest rates jumped to 20-year highs, with the mortgage payments, car payments, and other credit payments required to finance everyday purchases rising substantially, consumers felt the financial squeeze. In the US, home prices are up almost 50% since the start of the pandemic, while the 30-year mortgage rate has tripled since the historic lows of 2021. Consequently, the interest payment on a new 30-year mortgage for the average house has increased more than threefold since 2021, and the payment on a new car loan has increased more than 80% since the start of the pandemic. As a result, the interest payments made by households grew by about 30% in 2023, the fastest growth rate on record (Figure 5A).
None of these increases, however, enter directly into the US Consumer Price Index (CPI)…’
https://cepr.org/voxeu/columns/consumers-regard-cost-money-part-cost-living
Full working paper available at https://fairmodel.econ.yale.edu/ec439/summers1.pdf
I do not know how many people perpetually rely on credit, and I have not delved into the methodology of Bolhuis et al. I was confused when they wrote about ‘principal components’ when (by my understanding) they used a factor analysis. I cannot comment on the veracity of their findings one way or the other. However, I prefer the attitude ‘There is something that I do not know yet’ to ‘People are just irrational, incompetent, deceived, and/or liars’ every day. Of course some people are irrational, incompetent, deceived, and/or liars, but I do not think this is usually true of most people.
Economists apparently define inflation as the rate of increase in prices, rather than the cumulative increase in prices.
Powell said it at an FOMC ~2 years ago, expect prices will never go back down to to where they were.
‘Economists apparently define inflation as the rate of increase in prices, rather than the cumulative increase in prices.’ Correct. The money supply M0 always increases. Only in cases of hyperinflation do governments introduce new currencies or cut a few zeros off the old one. There is a huge economic cost associated with changing the currency, e.g. repricing all goods, changing electronic payment systems… (that is, if the new currency is actually accepted by the people).
I am not sure how you would define cumulative price increases. Let me explain how CPIs are calculated: A bunch of statisticians with expertise in pricing, and very little government funding, use surveys to determine what goods people spend their money on. It changes a bit every year: In 2000, nobody could buy a smartphone, but now smartphones are part of the CPI. Other goods are kicked out when they become irrelevant. Then the statisticians collect data (for example, by sending someone to a shop to determine the shelf price of good x), weight it and add it all up. Out comes a price tag (e.g. $1565.42, IDK the exact order of magnitude). What we know as the CPI is the change in that price tag, i.e. how it has changed relative to either the previous month or the same month in the previous year.
you left out a few (thousand) steps. There are market baskets of goods typical for different demographics – each consists of a large number of items whose prices are then sampled. There are some attempts to measure and adjust for quality (e.g., a smartphone today has far more capability – that I never use – than it did 10 years ago). While it is easy to criticize the CPI, it is a monumental effort. It bears all the faults of any average measure. One thing of particular note is the treatment of housing. House prices are not directly part of the CPI – the price of a house represents an exchange of one sort of asset for another. It is the operating cost of the house that represents a “cost.” This includes maintenance, rent (or an estimate of the rental “price” of the house), insurance, utilities, etc. Many people talk about the massive increases in housing “costs” as “inflation” but it is not, and is not measured as such.
To be sure, house prices are a problem and unaffordable for a growing segment of the population. But we shouldn’t mistake that for inflation. It is an increase in one particular type of asset price – and policies aimed at reducing these prices would not be the same as policies designed to fight inflation. Rather than trying to use the money supply to reduce house prices, changing zoning laws, construction standards, or ownership concentration would be better avenues to pursue, in my opinion.
I guess I cut out the above relevant line from my quote. I’m suggesting they try to get at cumulative inflation rather than only the rate. A model using that to make predictions would perhaps have better predictive skill.
Anoneuoid, the CPI index is basically “cumulative inflation” no?
https://en.wikipedia.org/wiki/Consumer_price_index#/media/File:US_Consumer_Price_Index_Graph.svg
Apparently it is defined as the red line. The blue line is something else.
The red line is “percent change in index” basically (index(i)-index(i-1))/index(i-1) the blue line is the index itself.
https://fred.stlouisfed.org/series/CPIAUCSL
When I think “the CPI index” I think of that link. When they say “inflation was 8%” what they mean was cpi now is 1.08 times what it was a year ago.
The way I interpret the blue line / cpi is that it’s 100 times the price of some basket of goods divided by the price of that basket at a given fixed point in time. Now the fred site will let you decide which timepoint to use for the reference time. The officially published data uses some particular date as the reference date and its value will be 100 on that date.
Of course it’s not quite like that, the basket changes through time, but they make some effort to move things in and out of the basket in a way that makes the index continuous… it’s a bit sketchy, I would prefer to utilize a set of “core expenses” that don’t change through time. Hence “rent, food at home, childcare, transportation”. of those, transportation might change most through time, but basically they are all things people continuously need forever by basic biological limitations of being a primate.
I was responding to this:
Lets just call them red and blue lines.
I say try putting the blue line values in their model (or the deltas since last survey/whatever) rather than the red line ones.
Eg, maybe the red line went down since the last survey but the blue one went up. Consumers are responding to the blue line while economists are (apparently) looking at the red line.
Someone should try it.
Yes I sort of agree with you. The CPI as an absolute value isn’t particularly meaningful, since it can be adjusted arbitrarily by changing the reference time point… But I think people respond to something like the average of (blueline(t) -blueline(t-k))/blueline(t-k) for a certain probability distribution of k values… Basically they look backwards at recent years and see how expensive things are now relative to some relevant “timescale” which is fuzzy. If you used that kind of average over different time scales in understanding sentiment you’d get a lot farther. Instead economists use very noisy and arbitrary “one year ago” measurements.
> I am not sure how you would define cumulative price increases.
That would be the price (tag).
> What we know as the CPI is the change in that price tag
What we know as change in CPI is the change in that price tag.
“The Consumer Price Index for All Urban Consumers (CPI-U) __increased__ 0.4 percent in March on a seasonally adjusted basis, the same increase as in February, the U.S. Bureau of Labor Statistics reported today.”
(By the way, “The money supply M0 always increases” doesn’t seem correct. It went down more than 10% in 2022 and in 2018, for example.)
@Dale Lehman: Thanks, I fully agree.
@Anoneuoid:
‘Eg, maybe the red line went down since the last survey but the blue one went up. Consumers are responding to the blue line while economists are (apparently) looking at the red line.’
In my experience, people often talk about the ‘blue line’ when they complain that everything is getting more expensive (‘Everything was cheaper 50 years ago…’). But we always need a reference point. If I did not live 50 years ago, I am unlikely to use it as a reference point. Inflation rates use the last year as a reference point, as Daniel Lakeland points out. I think this is the most reasonable choice, given that the measurement of the CPI is constantly changing.
In the past, actual inflation seemed to reflect perceived inflation sufficiently well. I doubt that the reference points are the reason for the present conundrum – why should they have changed so drastically? But generally speaking, I like your idea: People just do not compare prices from year to year, even if economists do.
@Carlos Ungil:
Perhaps I was a little careless in my statement. M0 usually refers to ‘hard cash’, i.e. coins and banknotes. But it can also mean other forms of money (notably deposits). I’m not sure which of the many FED charts shows M0, so let us go with M1 (= M0 + deposits) instead: https://fred.stlouisfed.org/series/WCURRNS
M0 and M1 can theoretically decrease, but usually they do not.
I neglected to write earlier that nobody really cares about M0 or even M1. It is a tiny fraction of the total money supply. (‘Money supply’ has no common definition. But whatever precise definition is used, everyone agrees on how unimportant M0 is.) The *total* money supply can fall, and it can fall a lot. The graph you looked at probably used a broader definition of money.
Earlier, I tried to simplify the discussion by avoiding the money market, and ‘ever-increasing money supply’ was a convenient excuse to ignore it.
However, if we want to fully immerse ourselves in the discussion of the goods market, we cannot ignore either the money market or the asset market. They are closely related. It is important to take them all into account. But my comment was already so terribly long, and now this one is too…
> The graph you looked at probably used a broader definition of money.
I found a random site that provided a series for “United States Money Supply M0”. Now that I look at the accompanying text I see that it clarifies it’s the monetary base.
> M0 usually refers to ‘hard cash’, i.e. coins and banknotes. But it can also mean other forms of money (notably deposits).
I’ve never seen M0 including deposits but it’s true that in the US there is some ambiguity and it can be hard currency but it can also be the monetary base:
“The smallest and most liquid measure, M0, is strictly currency in circulation plus commercial bank reserve balances at Federal Reserve Banks; M0 is often referred to as the “monetary base.”
https://www.richmondfed.org/publications/research/econ_focus/2019/q1/jargon_alert
The lack of agreement about the definition of M0 may be why it’s not provided by the Fed or available in FRED.
> I’m not sure which of the many FED charts shows M0, so let us go with M1 (= M0 + deposits) instead: https://fred.stlouisfed.org/series/WCURRNS
Not that it matters but I’m not sure if you intended to show M1 (which you didn’t) or the currency part of M1 (which does not includes cash in vaults though it may be part of what you meant by M0).
> I neglected to write earlier that nobody really cares about M0 or even M1.
Well, nobody cared about M0 in this thread until you brought it up :-)
Raphael –
> People just do not compare prices from year to year, even if economists do.
Hmmm. I think it’s not an either/or. People say “when I was a kid, I could get a hot dog and a coke for $X.”
But generally, when they’re considering inflation they’re saying “this bill at the supermarket seems much higher then it would have been last year,” or “eggs were $X per dozen last year” or “it costs way more to fill up my gas tank than it did last year.”
I wonder if there is an asymmetry in perceptions when prices go up versus when they go down. I’d speculate that they are more attuned to increases than decreases – pure speculation, so if anyone knows of any relevant research I’d be interested to see that. It strikes me as akin to the Kahneman/Tversky prospect theory where gains are valued differently than losses. If I look at my own behavior, I am well aware when a price goes up, but not as much when it declines.
@Carlos Ungil:
You are right about the graph. Here is the correct link: https://fred.stlouisfed.org/series/WM1NS
And probably you are right about unimportant monetary definitions, too😉
@ Joshua:
It seems to me you are saying that even a single person can use different reference times for different goods (e.g. fuel prices from 30 years ago, eggs from some time last year when I took the time to check how much they cost, the price of a cinema ticket before Covid/ Donald Trump’s inauguration/ the Great Recession/ the bursting of the dot-com bubble/ any other more or less memorable event…). If so, I do not disagree. Which makes the divergence between perceived and estimated inflation all the more interesting.
How about… assume cpi = (1 + r)^t, where t is years and r is the (constant) inflation rate. When r is small (~ 0.01) you can approximate with cpi_a = 1 + r*t.
The rates of change are then:
dcpi = log(1+r)*(1 + r)^t
dcpi_a = r
Economists look at “% change in cpi”, ie diff(cpi)/cpi[1:(n -1)]. In the idealized (constant inflation) case this equals dcpi_a = r.
On the other hand, “Consumers” look at diff(cpi) ~ dcpi. That is only approximate due to a small “discretation” (better termed “continuization”) error.
Essentially, by looking at % change, economists are using an approximation that works when r ~ 0.01. But this breaks down at, eg, r ~ 0.1.
Raphael –
> Which makes the divergence between perceived and estimated inflation all the more interesting.
It is intersting, but I think to really assess the divergence you need to specific and control what’s being compared.
I think when someone says “I remember that gas was $0.30 cents a gallon in the 60s” they’re not really reflecting so much on the impact they feel from inflation as being nostalgic. That difference from the 60s is effectively mirrored in wage increases, and it wasn’t necessarily less of an impact at $0.30 then on living standards than gas prices would be at $3.00 a gallon today.
I think when people think about inflation they’re more thinking of a shorter term price increase that outstrips wage increaes in that shorter term.
So to assess the divergence between perceived and estimated and actual, you need to make the effort to specify the time frame and explicity hold the time frame constant across the comparison.
My guess is that in general, however, if you ask someone about their perception of inflation as compared to actual inflation the reference is how much more do eggs cost this year over last year (or some other unspecified shorter time frame that wouldn’t likely be mirrored in wage increases). It’s like asking how far do your wages grow, (or how far does your dollar go, thinking of your dollar as a constant value).
Joshua, Raphael, and others:
I agree that people think of inflation in terms of the difference between prices now vs in the “not too distant past” but they most certainly don’t think “12 months ago exactly”.
Any measure of these things is noisy. But what people are responding to is a smoothed version of that noise.
In the limit of frequent measurements (let’s say going from annual to monthly to weekly to daily to inter-day) plus independent normal measurement error on the measurements (noise) the graph “converges” to a schwartz distribution, not a function. This is because at every infinitesimal increment of time there is measurement noise which is unrelated to other time points, so each time point is distinct and a little delta distribution. Of course in reality we just get weekly or daily data at the most often, but the point is that differences nearby in time amplify the noise and this is what gets reported in the news, and it fluctuates from month to month and the economists all go crazy over it “inflation is down from 5% per year to only 1.8% this month” or some bullshit… it’s completely meaningless.
The only way you can measure a Schwartz distribution is via convolution with an infinitely smooth compact test-function kernel. so instead of “the value of the function at time t” you have to do integral(distribution(x)bump_of_width_w(x-t) dx) that is, place a little incredibly smooth function that is zero everywhere outside a narrow region and infinitely smooth within that nonzero region around t, and then spatially average the schwartz distribution over that region/window.
Once you do this averaging, you get a smooth function… Economists already know this when they do “seasonally adjusted” but they think of it as a way to damp out month-scale oscillations, they don’t consider the importance of measurement-error because they’re steeped in a “we sampled millions of data points, there is no meaningful measurement error” but the measurement error is as much in the validity of the measurements to represent the underlying concept as it is in the sampling.
The only way to meaningfully describe peoples “feeling” of inflation is to do basically local average over the last 6 months of the CPI value, minus local average over a spread including the last 5 years with varying weight, divided by the expected difference in times taken from the two local averaging kernels… This is a kind of “smoothed derivative”… but I’m guessing out of 1000 economists maybe 3 of them know what a Schwartz distribution is or have taken a course from an Electrical Engineering department on signal processing or have read Richard Hamming on digital signals or anything like that. So we continue to hear in the news complete BULLSHIT which is 100% noise chasing.
Just ran across this:
Contrary to the story CNN is pushing, of cash-strapped families being unable to afford restaurant meals, the government data shows a picture of rapid growth, in spite of the impact of the worldwide pandemic. And just to be clear, this is spending after adjusting for the impact of higher prices, so people actually are buying more meals at restaurants than they did before the pandemic
So people may say “Yikes, restaurant meals have spiked so much. They’re unaffordable!” even as they spend more after adjusting for the higher prices, presumably to some extent because their wages increased faster than the prices did.
I’m not advocating a particular belief so much as saying clearly, ideological persuasion and other biasing factors play an important role here.
https://cepr.net/cnn-needs-to-buy-its-economic-reporters-access-to-the-internet/
Joshua.
Here’s a comment where I graph income of the bottom 10%tile measured against my favorite type of CPI index, equally weighted (rent + food at home + childcare + transportation). You can adjust it a bit by adding healthcare + higher ed for example but whatever… it’s a decent measure.
https://statmodeling.stat.columbia.edu/2024/05/11/is-it-really-the-economy-stupid/#comment-2372113
The bottom 10%tile unlike Dale’s assertion had declines in this measure of income from 2021 to 2022 and probably into 2023 as well but the data is not available yet. Also I showed decline for the median.
People complaining that individuals don’t know what they’re talking about the numbers show they’re doing well are so deeply committed to the TRUTH of their chosen measurement methodology that they can’t POSSIBLY IMAGINE that maybe just maybe their measurements are the problem…
https://imgflip.com/i/8ptpat
When people are asked about their income, perhaps they’re thinking of an expanded net income, i.e. after expenses, basically how much they have left over to save and spend on non-essentials. And I imagine expenses have gone up for most or are perceived to have gone up given how often inflation is discussed in the media.
“… Or is this another example of a pattern that survey researchers call “expressive responding” — a phenomenon where individuals strategically provide dishonest answers to survey questions in an attempt to make their party look good or the other party look bad?”
I think there is a much more likely explanation. People have models about how the world works and usually fit new information into their existing mental framework rather drastically changing their thinking about how the world works. Confirmation bias where people give greater weight to observations that fit their existing views is an example of this. So people’s pre-existing views of whether a liberal or conservative President will be good for the country will color how they see their administration. This tendency is amplified by another human tendency which is to go along with group opinion. So if liberals and conservatives mainly associate within their group they will tend to adopt the group view.
So the respondents aren’t deliberately lying, they are mistaken in ways that justify their political beliefs.
“So the respondents aren’t deliberately lying, they are mistaken in ways that justify their political beliefs.”
Or, maybe, the respondents – the people who are really out there feeling the economy – actually know what’s going on and it’s the academic political scientists, totally insulated from the impact of the economy, are just making up simple ad-hoc explanations for complex phenomenon that fit their own biases? Would it be the first such instance?
Why even do research? The answer to all research questions in social science: Cognitive Bias! People don’t understand anything, they’re just victims of their cognitive bias, it’s only we, the Great Social Sceintists, the towering intellects who brought you the Replication Crisis, that can actually explain whats **really** going on.
That’s how primates went from being arboreal leaf eaters to computer engineers, right? All due to the illusion of cognitive bias!!!
Chipmunk:
Read the above post. Respondents’ retrospective evaluations of their economic status were not consistent with their earlier responses.
Survey respondents are just people; they make mistakes just as academic political scientists and everybody else make mistakes. Putting someone in the role of survey respondent doesn’t make them infallible.
Experts know everything. Experts know nothing.
In my view of the world, reality is somewhere in between. Unfortunately that means we have to think carefully. We have to strive to recognize our own and others’ biases and account for these. We have to appeal to analysis when it is appropriate. It is all such a messy business. It is certainly easier to just pick one of those first 2 options, despite the fact that both are likely too extreme.
Dale –
> Experts know everything. Experts know nothing
Could be my own bias, but I think the first belief is pretty much non-existent (although often it is claimed that it commonplace) and the second is pretty commonplace (because it’s easy to scapegoat “the experts” to justify one’s osn views).
However, I think it’s likely that for many the validity of “the experts” is overestimated.
It’s a mess.
Dale, to me the most dangerous experts are the ones who “know stuff” but that stuff is wrong. This is why all the emphasis I’ve been putting on monetary theory in the last week or two. When we “know how it works” but we’re wrong, we wind up doing stuff that’s harmful because we confidently predict stuff which turns out not to be true and something else happens instead. In my view that is what has happened in the last 25 years. The economists at The Fed and advising people like Clinton, W Bush, and Obama said essentially “we understand the theory here, you should do X” and it just so “randomly” happened that X was great for powerful people and that the theory was vastly wrong, and led to the oligarchy we have today.
Basically X was, deficit spending is fine no worries keep it up, anti-trust regulations don’t matter as long as inflation is low, monopolies are efficient, and The Fed can control the money supply to keep inflation low so it won’t be a problem anyway.
None of that was true, NONE of it.
Oh also “we can lift people out of poverty by lending them money in large quantities to get higher educations”. That was key too.
I’m pretty skeptical that people are responding to “strategically” manipulate a survey. If someone asked me how my income had changed, I would say it has gone down because of inflation. I don’t need a CPI or any report from the Fed to tell me that. Just going to the grocery store or restaurant or where ever is enough. “Self reported income” probably means many things to many people without someone attempting to intentionally manipulate survey results. This all seems pretty silly to me.