David “should have a regular NYT column” Weakliem writes:
The Columbia Journalism Review recently published a long article by Jeff Gerth on media coverage of Donald Trump. In the introductory section, Gerth says: “Before the 2016 election, most Americans trusted the traditional media and the trend was positive, according to the Edelman Trust Barometer….Today, the US media has the lowest credibility—26 percent—among forty-six nations, according to a 2022 study by the Reuters Institute for the Study of Journalism.”
Weakliem continues:
Confidence in the media has been in general decline for decades, according to the data I’ve seen, so the first sentence surprised me.
Indeed. That claim surprised me too! It turns out it’s not true.
I have three interests in this story:
1. As a political scientist who studies American public opinion, I’m interested in examples where journalists get things way off. Mistakes of reporting can be important in themselves and also can reveal deeper misunderstandings.
2. As a statistician, I’m interested in how people get confused by data.
3. As a Columbia professor, I’m interested in what’s happening with the Columbia journalism review.
I’ll share Weakliem’s story and then go through those three issues.
0. The story
Weakliem takes a look:
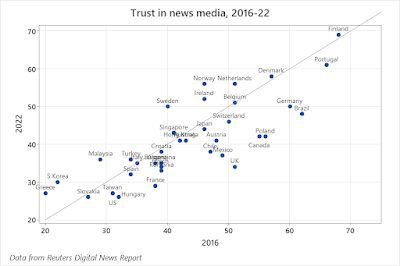
I checked the Edelman Trust Barometer and noticed that they have continued to survey trust, so you can look at how trust has changed since 2016. The following figure shows trust in the media in 2016 and 2023 for nations in which both are available:
Trust in the media fell from 47% to 43% in the United States over the period. Among all 25 nations in the sample, average trust fell from 49.3% to 46.9%. So the US was a little below average at both times. As far as change, the United States had a decline of 4%, which was not unusual—the mean change was a decline of 2.4%. As far as the “positive trend” in 2016, the report says that trust in the media was higher than it had been in 2015. The Edelman Trust Barometer apparently goes back to 2001, but there doesn’t seem to be a convenient place to look up the data, so I didn’t pursue that. The main point is that it doesn’t suggest that the American media suffered a particularly large decline in trust after 2016.

What about that 26% claim? Weakliem checks it out:
Now for the Reuters study (the Digital News Report): the United States did rank lowest, at 26%. The Reuters data go back to 2016, so they can also be used to measure change. A figure showing trust in 2016 (or the earliest year available) and 2022:
The United States has fallen in both absolute and relative terms, but the change wasn’t that large–a decline of 6, when the average change was a decline of 2.5.
The question then arises: why did the two surveys give such different results? Weakliem writes:
The samples are different, but about 20 nations appear in both. Neither the scores nor the changes in the scores are highly correlated (the correlations are a little less than 0.2). Perhaps that’s because of a difference in the questions: Edelman asks whether you trust the institution to “do what is right,” while Reuters asks if they think you can “trust most news most of the time.” But both give the same conclusion about whether there’s been a decline in trust in the American media: some, but not an unusually large amount.
He summarizes:
The comparison in the Gerth article is misleading—it treats the difference between two different questions as a change over time.
1. The mistake in reporting of public opinion
How did the article get it so wrong? The quick answer is that there are a lot of statistics running around, and it’s easy to mess up. The Columbia Journalism Review probably ran the article by an editor, but editors are busy too, and there’s no reason the editor would be better than the reporter when it comes to looking up and understanding statistics.
Ideally you’d hope the reporter or editor would have enough numeracy to be suspicious of a claim that trust in the media dropped by at least 25 percentage points during a six-year period—but, no, they didn’t seem to notice.
It’s not that a 25-percentage-point drop would be impossible. It’s just so big that if you make such a claim, you should check it carefully. Which they clearly didn’t.
The other question, though, is why did they make this particular mistake, and here I suspect there were two things going on:
(a) The article was all about how things had changed so much after 2016, so this supposed big change in public opinion was consistent with that story.
(b) The Columbia Journalism Review is often critical of journalists—that’s one of its missions!—and so it would be receptive to a claim that trust in journalists has plummeted.
In short, they got it wrong in a way that fit their existing narratives. Which happens sometime.
To be fair, they did get the sign correct, and a decline in trust of 5 percentage points isn’t nothing. There really is a story to be told about the decline in trust of journalism in America and elsewhere—or, flipping it around, asking why trust in journalism and other institutions used to be higher.
2. The statistical error
The key mistake was to compute a difference, X – Y, where X came from one data source and Y came from another. We’ve seen this happen before, with a claim about Jewish students at Harvard that was using a numerator and denominator that came from different sources.
For a quick sense of how these comparisons can go awry, recall our post from a few years ago, What is Russia’s GDP per capita?. We looked up several authoritative-seeming sources and got numbers varying by more than a factor of 5. Even restricting ourselves to numbers from the World Bank, we got the numbers $7,600, $9,100, $14,700, $4,500, $14,400, $9,100, $3,200, and $2,621. All of these were in units of 2006 or 2007 US dollars. My point here is not that GDP is hard to measure or even to define, but that if you’re comparing different countries, or comparing a single country at different time points, you better be careful to use the exact same source. One might naively think that comparing two World Bank numbers would be ok, but, no, that’s not enough.
3. Whassup with the Columbia Journalism Review?
As a Columbia professor and friend of various Columbia Journalism School faculty and alumni, this all makes me sad.
We have a whole department of political science here at Columbia! If someone from the J-school is going to write something about public opinion, couldn’t they at least check with us first??
I mean, sure, I get it, they’re a magazine with editorial independence, they have no requirement or expectation that they’d run stories by the university first to check for accuracy. But wouldn’t they want to get things right? Why make up numbers if you have public opinion experts right here on campus? Or, if they don’t want to check with us, they could hire David Weakliem as a consultant.
P.S. There was more going on with this Columbia Journalism Review story than I’d realized; see for example here and here. I guess that misreporting the statistics on public trust was the least of it.
P.P.S. Where did the confusion about the surveys come from? Marcy Wheeler points us to this general post about the Columbia Journalism Review article and also shares a link to this news article from last year, “Media trust hits new low,” which has this graph:
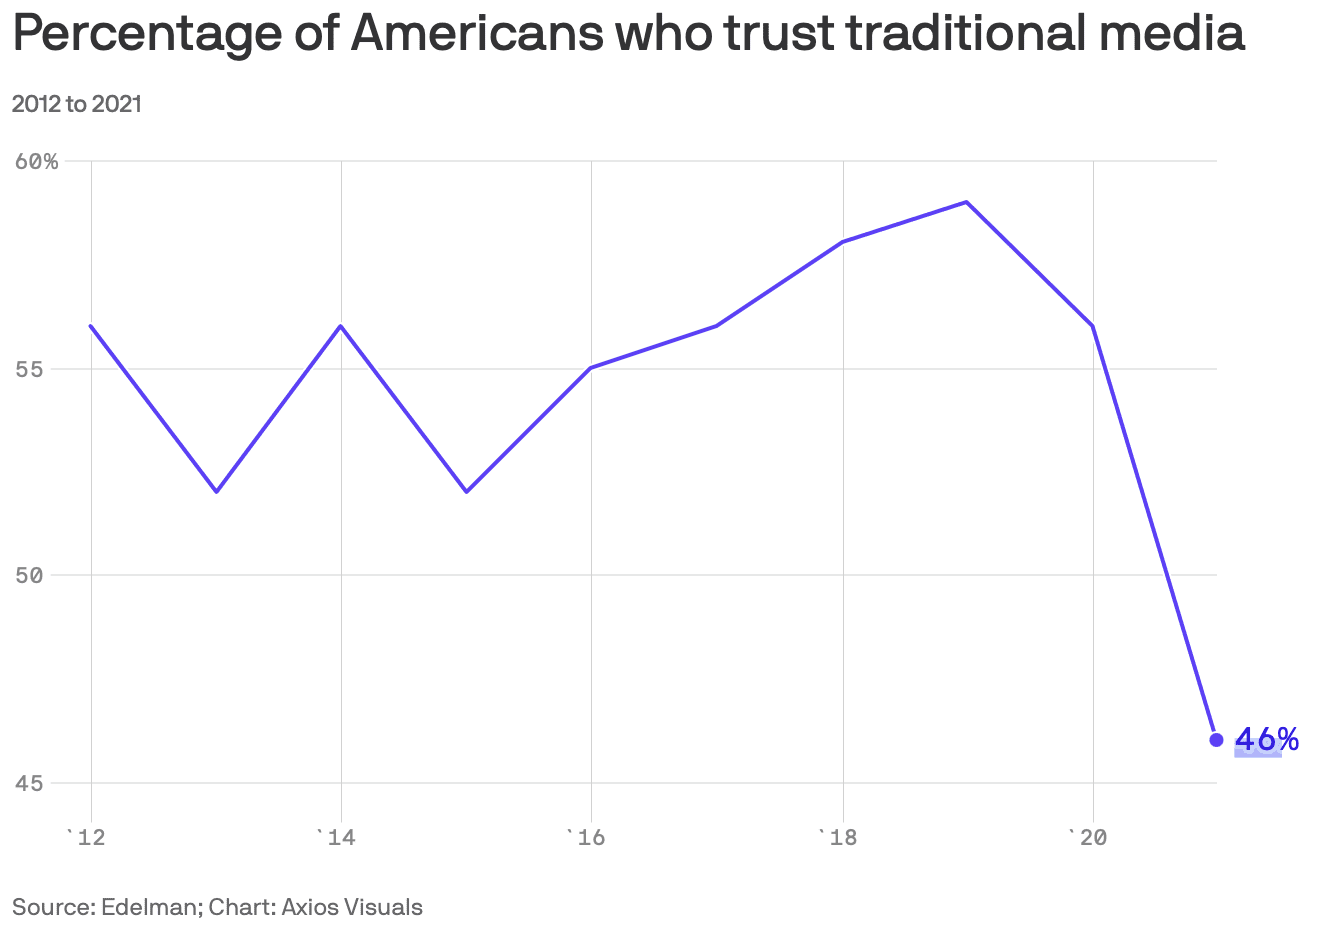
along with the following summary:
For the first time ever, fewer than half of all Americans have trust in traditional media, according to data from Edelman’s annual trust barometer shared exclusively with Axios. Trust in social media has hit an all-time low of 27%.
There’s nothing wrong with either the graph or the passage, but I guess they could be confusing for two reasons: first, the y-axis is compressed so the drop to 46% looks visually huge; second, on a quick glance the passage could mistakenly be read to imply that trust in media declined to 27% (if you don’t notice the word “social” in that past sentence).
The factual error is in support of a narrative – that the “Russiagate hoax” was merely a product of triggered mainstream media afflicted with TDS, working in collusion with censorious and intolerant Big Tech and authoritarian libruls in the government, to make Trump look bad.
Thus, a loss in confidence in the media coincides with Trump, and it’s not like any trend in trust in media reflects long-standing political dynamics.
I think it’s probably a case of banal motivated reasoning where people will filter evidence through their preexisting beliefs.
The point being, that piece is embedded in a larger context, whereby poor Donald is a victim of the “woke mob” and “fake media.”
Not to say that I don’t think there is legitimate criticism with how the “Trump/Russia collusion” was covered, generally. And not to say that there aren’t legitimate issues at hand with respect to accountability, and how problems in the coverage should inform discussions about reliability in reporting.
But the notion that we could disaggregate a single causal factor from the obviously multifactorial causality behind trends in trust in media should be a non-starter, imo. It reminds me of where climate change “skeptics” exploit errors from climate scientists (along with the explicitly identified uncertainties in the work of climate scientists), to assert that it is the unreliability of climate scientists that drives climate “skepticism.”
Confirmation bias is a powerful cognitive bias.
“the notion that we could disaggregate a single causal factor from the obviously multifactorial causality behind trends in trust in media should be a non-starter, imo. ”
Why not? What’s “obviously multifactorial” about it?
Weakliem’s and Andrew’s criticisms of the CRJ paper are sound but I confess I’m unconvinced with Weakliem’s counter claim and Andrew’s defense of it. Weakliem shows two years of different surveys at different times: before and after Trump. But there is a complete sequence for the Edelman Trust Barometer. Why not show it? Was there a dip in trust during the Trump administration? One more graph, not really alot of work.
Beyond that, both he and Andrew claim that the survey questions aren’t comparable because they’re different questions. Perhaps, but lets look. Here are the questions:
‘Edelman asks whether you trust the institution to “do what is right,” ‘
‘Reuters asks if they think you can “trust most news most of the time.” ‘
They’re not dramatically different. What really needs explaining – if you want to have any confidence in either – is the dramatic difference in scores between the two questions. But no one is offering an explanation for that. Also, asking people whether they trust “the” media is probably an increasingly irrelevant question in a world where media is increasingly partisan and people are increasingly attached to media outlets that suit their biases.
You talk about complex driving factors but perhaps there’s a simple one: Since 1920, it has become increasingly easy to have a small media outlet with a world wide reach. Like in many other fields, this globalization undermines what were once very profitable local monopolies or duopolies. As the profitability of media shrinks, it’s forced to make ever more outlandish claims to get attention and sell it’s products, thereby undermining trust.
And here we’re talking about this on a blog: Andrew is undermining the media by giving away content free; and undermining the media again by providing higher quality content; and undermining the media yet *again* by providing more reliable content. The real wonder is how the media survives at all.
Chipmunk –
> What’s “obviously multifactorial” about it?
Really? What’s multifactorial about how the public views media?
First, the model of causality is obviously too simplistic as a matter of first principles. As Anoneuoid aliudes to elsewhere in this thread, ideological orientation predicts how people assess the reliability of specifix media output. Gerth thinks that inaccurate reporting – which he thinks fabricated a Trump/Russia collusion – drastically drove down trust in the media. The obvious problem there is that prolly 1/2 the country doesn’t think the reporting was inaccurate. So his view of the impact of the reporting is obviously driven by his personal assessment of the accuracy of the reporting – to the extent that he ignores how prolly 1/2 of the public views the reporting.
Second, do you think you can disaggregate the impact of Trump yammering on for years about “fake news,” or from Fox News yammering for even longer about the “biased MSM” (as if they’re excluded from membership in the “MSM”).
Do you think that an overwhelming conviction among the public that reporting on Trump/Russia in the “MSM” was so explanatory for “trust” in the media, that in comparison the effect of constant RW messaging about the untrustworthy media has no meaningful influence (IOW, wasn’t a casual contributer and thus there was no multifactorial causality)?
> You talk about complex driving factors but perhaps there’s a simple one: Since 1920, it has become increasingly easy to have a small media outlet with a world wide reach
Perhaps that’s a factor, but now you’re offering a different single casual driver than Gerth’s single casual driver. Yours seems no more plausible as a singular driver to me than Gerth’s does. But at least with your singular driver you’re attempting to include obvious societal changes over time. Going back to Gerth’s singular concept of causality – he’s ignoring ANY other aspect of changes in the media landscape, such as the dramatic impact of social media, or the changes in how people acquire information (such as from social media). Yah, that seems obviously simplistic to me.
He has a bone to pick with how Trump/Russia was covered. OK, fine. I think there are legit arguments there to make. But we could easily predict that people who have that bone pick are going to see a contemporaneous trend in something like trust in media, and see in that correlation a causality that fits with and reinforces their bone-picking.
Again, it’s just like with climate change, where “skeptics” blame a putative “loss of trust in science” on putatively inaccurate “predictions” (which are mostly actually projections) made by climate scientists. Except the data (1) don’t really support the trend they claim to be seeing and (2) their theories of casuality don’t stand up to empirical scrutiny (e.g., there’s a ideological signal in the data which suggests that ideological orientation is what “causes” whether people think that climate scientists have made inaccurate predictions. IOW, they have the causality reversed).
Chipmunk –
Tucker Carlson and Sean Hannity discussed wanting a Fox News reporter fired after she pushed back on Trump’s election lies
https://www.businessinsider.com/tucker-carlson-sean-hannity-fox-news-reporter-fact-checking-trump-2023-2
They knew the pillow guy and the “release the Kraken” lady were lying on their shows, and pushed back on their own reporter who was fact checking. Because stock prices.
And you and Gerth think it’s plausible that the single casual factor explaining why the public (supposedly) lost confidence in the media was “Russiagate?”
Joshua:
I’ll buy that this was motivated reasoning. It just seems like such a waste, with the political science department right around the corner, that they couldn’t have checked their implausible numbers.
The first chart shows China has the most “trusted” media, at nearly 80%. I wouldn’t rely on these surveys to accurately measure public trust to begin with.
Also keep in mind the least trusting people aren’t going to be responding to these surveys. I’d guess the “non-trusters” who respond are mostly those who “trust” fox news but not cnn.
Does it bother you that the Edelman Trust Barometer calculates the margin of error as if the sample were random? I realize that this is fairly standard practice with surveys, but they don’t appear to make any mention that the margin of error is subject to that assumption. Further, they don’t provide any details (that I can find – perhaps some readers are familiar enough with their methodology to comment on this) concerning how the sample is collected – it only states that it is an online survey. If it is sent to people, then I would at least like to see the response rate. If it is comprised of those that choose to respond to an open invitation, then the random sampling assumption is a bit more palatable but I’d still like more details, such as where is the survey promoted, has it been done the same way every year, etc.
Part of my interest is the recently released CDC Youth Risk Behavior Survey – they are careful in describing their sampling procedures and response rates, but their report does not mention margins of error or sampling error (but does refer to the word “significant” dozens of times, “explaining” that it refers to p<.05). In both the YRBS survey and the Edelman Trust Barometer cases, the changes they are referring to are large – large enough to believe something has changed in the direction they indicate. Still they seem cavalier in their treatment of sampling error in their perhaps hyped reporting of results.
Dale:
I’ve never looked at the Edelman Trust Barometer—in the above post, I’m just quoting Weakliem—but your general question is a good one: What standard error should be reported by surveys?
I don’t know.
I think that standard practice is to report the standard error based on sampling alone, not augmenting it to account for possible nonsampling error. In that case, the way to interpret a reported standard error is as a lower bound on actual uncertainty (as here).
Alternatively, survey organizations could report some estimate of total error. That would make sense; it would just take more effort, along with some footnote explaining all the assumptions that went into it.
I also looked at the Reuters/YouGov poll. They report sample sizes and claim to weight their samples to make them representative. But they don’t bother calculating a margin of error (that I can find) even under the assumption of random sampling, nor do they appear (again, that I can find) to provide response rates – which should be relevant given that they construct the sample.
I’ve never been fond of surveys and have a natural tendency to distrust their results. I recognize that there may be no other feasible way to collect much of this information – information that can be important. However, the willingness to tell a story about how things are changing over time with such little humility in the potential errors, I do find disturbing.
Is what David says from an email to you, or a blog or something?
John:
It’s from his latest blog post. I added the link; thanks.
I think you’ve hit the nail on the head with the point about the interpretation of a 25 point drop in public “trust” over 6 years. This is quite basic: prior to any look at the evidence, people ought to have a sense of what sort of fluctuations are likely and which are unlikely, but if they occur, big news. Priors.
This is rarely taught formally. People who work regularly with data develop a feeling for it. It’s obvious to you and I assume all of us that the bombshell trust decline claim really is a bombshell and needs a careful look. It isn’t like some ordinary blip; it’s a sea change. A quarter of the population switches sides! All the other stuff, the sampling, the questionnaire, the response rate, come into play when you look at a number skeptically.
If this is true, it won’t be enough to say that editors should be on the case, if editors lack the same intuitive numeracy their writers are missing. For those of us who are in the teaching biz, the message is that courses for non-majors need to address these skills explicitly. I’ve known faculty who were devoted to this, in particular a physicist who taught mostly non-science people and worked a lot on plausible estimation — really extrapolation, like, if this were your estimate, what would be the consequences for x, y and z?
There will always be motivated reasoning and confirmation bias, but perhaps we can at least bring it up to a more respectable level.
Peter:
Yes, it’s a numeracy thing, the idea that people could see a claim of a 25-percentage-point drop without that raising suspicions.
It’s kinda like when Freakonomics uncritically reported that claim that beautiful parents were 36% more likely to have girl babies. At no point did they say: Hey, 36%? Really??? A more realistic possible effect size would be something like 0.2%.
Peter (and Andrew).
I think it’s more than just an innumeracy thing. I think it’s more fundamental.
The idea that a single causal factor (the press’s coverage of Trump) would cause a dramatic shift in such a complex social phenomenon should register as implausible just from first principles, IMO. It’s not only the magnitude of the change over time, or the length of time in question, that are issue – it’s also the notion that one influence could realistically be plucked out and identified as causal.
That’s not just a math misunderstanding – although I can understand why that component would jump out at people focused on statistics.
I don’t know what I’d say about how much I trust “the media”, but now I know not to trust the Columbia Journalism Review.
FYI, Jeff Gerth has a heck of a history. In the 1990s, his reporting on the nuclear physicist Wen Ho Lee and accusing Lee of being a Chinese spy was revealed to be a largely unsubstantiated witch hunt that ruined Lee’s career and let to a prominent apology from the NY Times and a $750,000 settlement for Lee to compensate him for the damage to his reputation and career.
I remembered this blog post while reading the following investigation by the Guardian into Edelman, the consulting firm behind the Trust Barometer: *Revealed: how top PR firm uses ‘trust barometer’ to promote world’s autocrats*. https://www.theguardian.com/us-news/2023/nov/24/edelman-pr-trust-barometer-uae-saudi-arabia. I thought it might be relevant to the discussion.