Ariel Karlinsky writes:
See here for our (along with 4 other letters) critique of IHME/Lancet covid excess mortality estimates which Lancet has published after first dragging their feet for almost a year, then rejecting it and then accepting it.
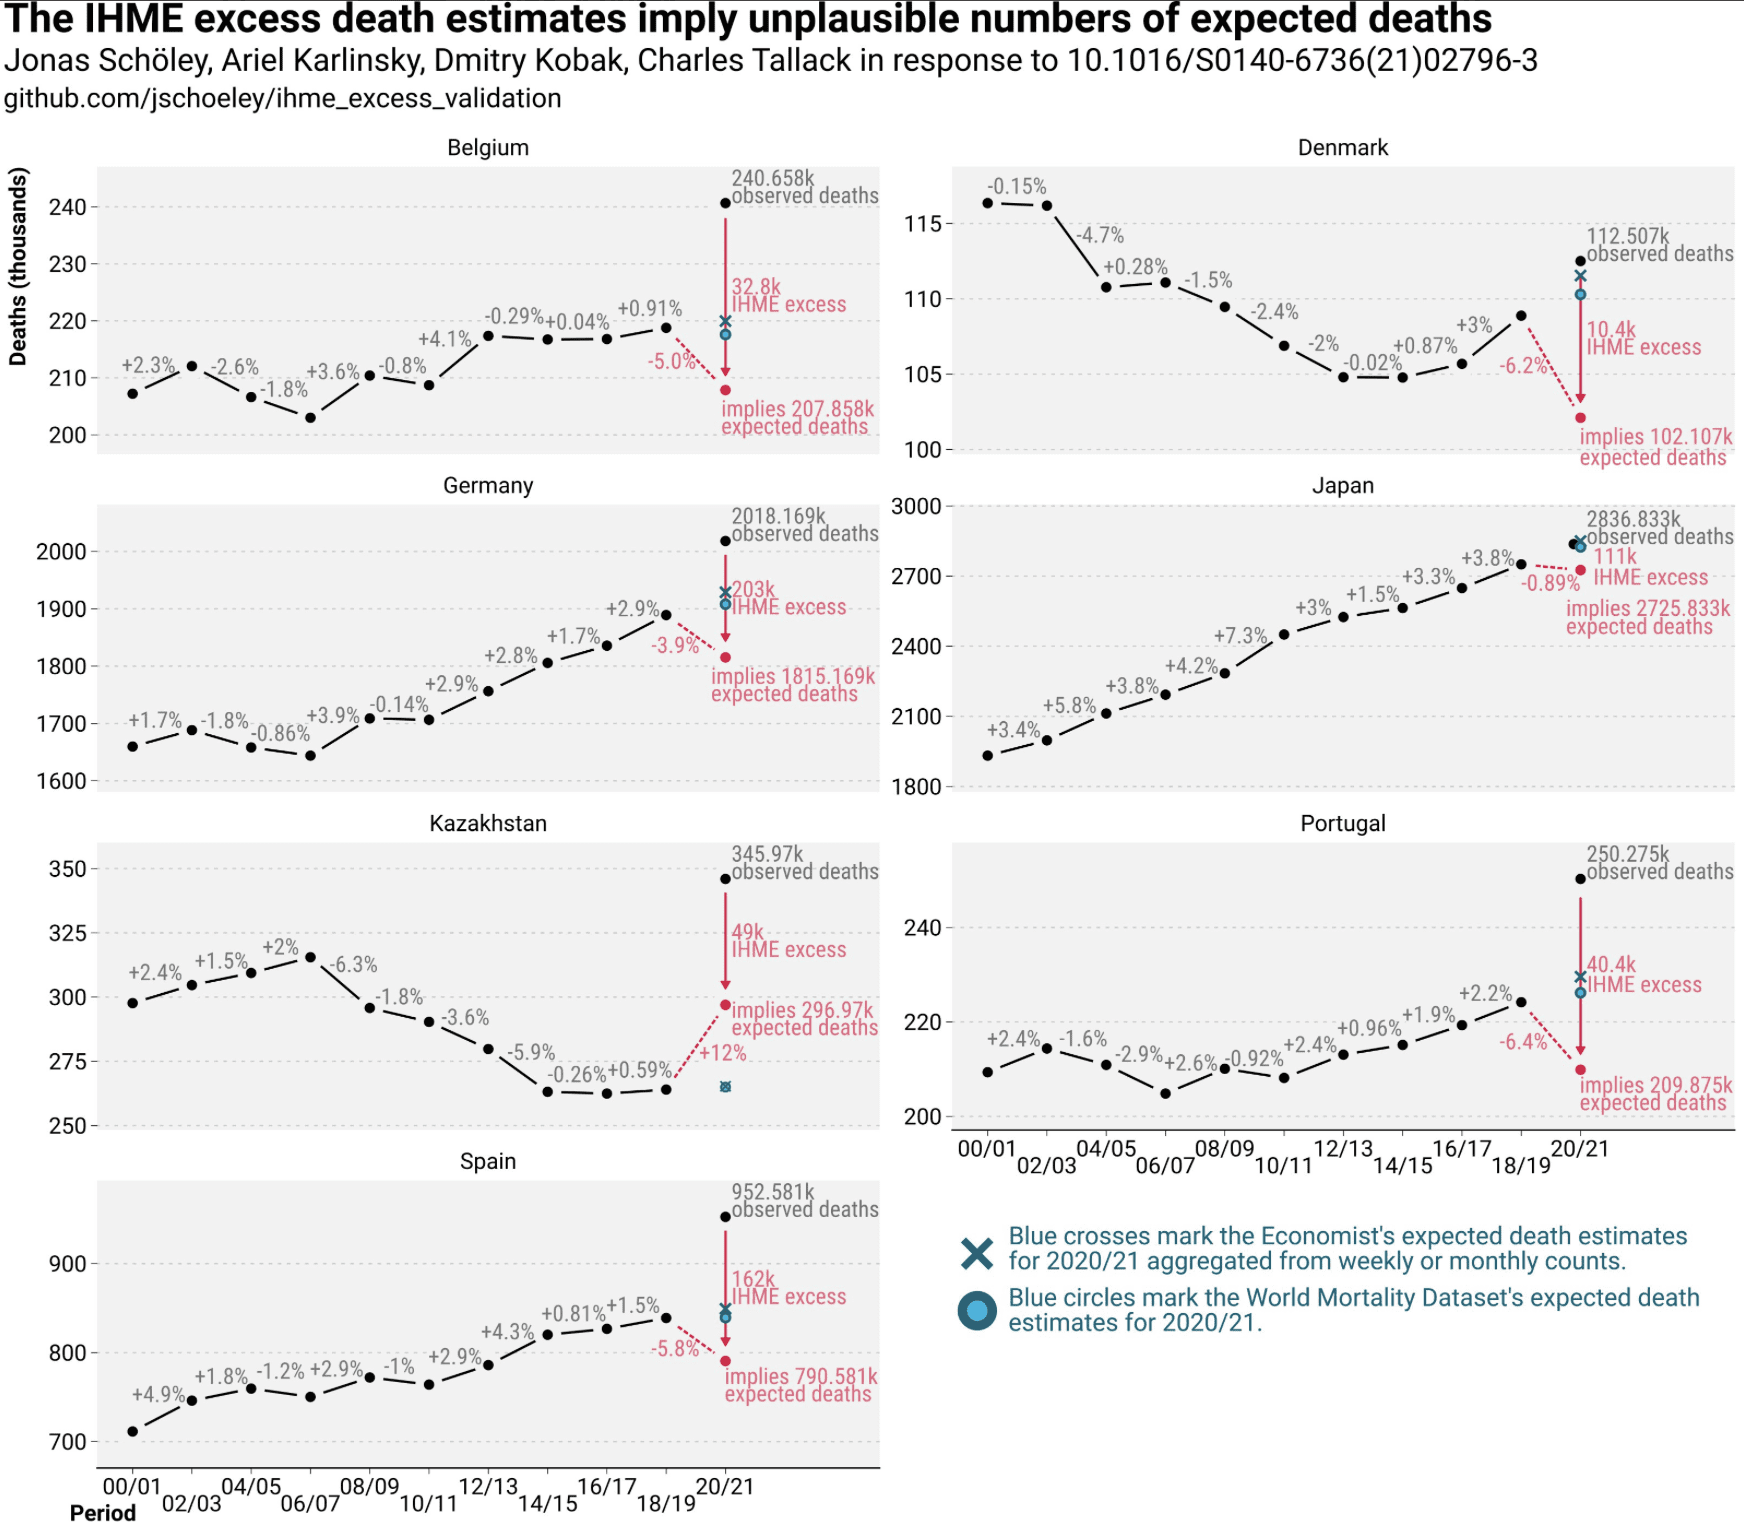
Our letter and this tweet with the above graph shows the issue best than the letter itself, and should be right up your alley as it plots the raw data and doesn’t hide it behind regression coefficients, model averaging etc.
I wonder if there was some politics involved? I say this because when Lancet screws up there often seems to be some some political angle.
On the plus side, it took them less than a year to publish the critique, which is slower than they were with Surgisphere but much faster than with that Andrew Wakefield article.
P.S. Here are some old posts on the University of Washington’s Institute for Health Metrics and Evaluation (not to be confused with the Department of Epidemiology at that university):
14 Apr 2020: Hey! Let’s check the calibration of some coronavirus forecasts.
5 May 2020: Calibration and recalibration. And more recalibration. IHME forecasts by publication date
9 May 2021: Doubting the IHME claims about excess deaths by country
19 Sep 2021: More on the epidemiologists who other epidemiologists don’t trust
I love these daily blog posts. But, I guess I am missing something. The blue crosses and blue circles seem rather close. Is that not the point?
The red circle is the IHME’s implied estimate. The blue circles and crosses come from the Economist and World Mortality Dataset, and that they agree with each other and track the observed mortality trend implies that something has gone very wrong with the IHME estimate.
Trying to understand this. So are the “expected” deaths suggested by the IMHE too low? And thus their estimate of COVID deaths too high? Or is it the other way around? or none of the above? Just trying to understand the bottom line. I get that they are “erroneous” or “implausible” but in which direction? My monkey brain sees the red dot lower and assumes that this means that they undercounted. But I also see the word “implies” which then confuses me more.
IHME did not publish their expected deaths, only the excess. But their expectation is „implied“ by the observed deaths minus the excess and should roughly be in line with historical trends. This is from our letter:
„The COVID-19 Excess Mortality Collaborators define excess mortality as “the difference between reported all-cause mortality […] and what would have otherwise been observed without the COVID-19 pandemic”. For Japan, 2 836 833 deaths were observed in 2020–21. The estimate of 111 000 excess deaths thus implies 2 725 833 expected deaths. The expected deaths are 0·9% lower than the number of observed deaths in 2018–19 (2 750 245), suggesting that in the absence of the COVID-19 pandemic there would have been a drop in death counts.
However, declining deaths are not in line with the historical trend: the number of annual deaths has been growing without interruption in the past 20 years, with biannual changes in death counts from 2000 to 2019 all being between +1·5% and +7·3% (appendix 1 p 1). By contrast, expected death estimates by the World Mortality Dataset and The Economist do not break with the past trend.
I remember early in the pandemic hearing somebody being interviewed on NPR gushing about Chris Murray. Is the guy just a good salesman, or did he do good work one point?
NPR . . .
Like others, I found that chart requires more explanation. It must assume some particular background knowledge of this issue to understand it.
But I gather the paper assumed implausibly low baseline death rates for a few countries, particularly in Europe. This would then exaggerate the apparent “excess deaths”.
From the original paper:
https://www.thelancet.com/journals/lancet/article/PIIS0140-6736(21)02796-3/fulltext
Does that mean they excluded the typical heatwave weeks for the baseline calculation as well? Because that will lower the expected mortality rates.
Overall this model seems way too complicated, and I couldn’t tell if they even accounted for basic stuff like 53 weeks in 2020 (ie, ~2% more deaths due to a calendar artifact).
Just take number of reported deaths in 2018-2019, then maybe adjust for any trends in total population. The bayesian splines and whatever are not going to be a substantial improvement on that. There are much bigger issues with this data and interpretation to worry about.
Supplementary appendix 2 for their letter is quite funny
To those that are confused about the graph, here’s how I’m interpreting it without looking at any sources i.e. just using the info in the graph and the blog post. The red dots are IHME (implied) estimates of the number of expected deaths if covid did not happen (calculated by subtracting observed deaths from their estimates of excess deaths). For all graphs, the IHME estimates of expected deaths are way off the trend lines by an implausible amount i.e. they are implying that if covid had not happen there would have been a huge jump (or decline, depending on the country) in deaths anyway.
do you mean calculated by subtracting excess deaths from observed deaths?
Yes. Spot on. The graph was designed to accompany the letter.
The author response to some of the criticisms is truly remarkable. They defend their methodology – which is fine – but don’t blink about the disparity of their predicted all cause mortality in relation to the past trends. In other words, it appears that their confidence in their methodology is so strong that no attention to the results is necessary. Given that all models are wrong (including theirs), I find that view untenable. At the very least, they should be addressing why they predict such low mortality relative to the past trends when the other forecasts are much higher – they need to say something about why their forecasts diverge, not just doubling down on their methodology.