I was talking with some people the other day about bad regression discontinuity analyses (see this paper for some statistical background on the problems with these inferences), examples where the fitted model just makes no sense.
The people talking with me asked the question: OK, we agree that the published analysis was no good. What would I have done instead? My response was that I’d consider the problem as a natural experiment: a certain policy was done in some cities and not others, so compare the outcome (in this case, life expectancy) in exposed and unexposed cities, and then adjust for differences between the two groups. A challenge here is the discontinuity—the policy was implemented north of the river but not south—and that’s a challenge, but this sort of thing arises in many natural experiments. You have to model things in some way, make some assumps, no way around it. From this perspective, though, the key is that this “forcing variable” is just one of the many ways in which the exposed and unexposed cities can differ.
After I described this possible plan of analysis, the people talking with me agreed that it was reasonable, but they argued that such an analysis could never have been published in a top journal. They argued that the apparently clean causal identification of the regression discontinuity analysis made the result publishable in a way that a straightforward observational study would not be.
Maybe they’re right.
If so, that’s really frustrating. We’ve talked a lot about researchers’ incentives to find statistical significance, to hype their claims and not back down from error, etc., as well as flat-out ignorance, as in the above example, researchers naively thinking that some statistical trick can solve their data problems. But this latest thing is worse: the idea that a better analysis would have a lower chance of being published in a top journal, for the very reasons that makes it better. Talk about counterfactuals and perverse incentives. How horrible.
Yes there is a constant shuffle of fallacies of composition & division, especially puzzling as an indulgence of expertise.
I’m attending a webinar about clinical trials (PCORI) Patient Center Outcome Research {pcori.org] that seems like a good resource for experts.
Given the academic selection process, it’s probably not surprising that publishing in top journals and getting funded are the main incentives for a lot of academics.
I don’t think the problem with this analysis is the regression discontinuity design. The problem is the unstable polynomial regression within the RD design. I actually think a RD analysis is probably more reasonable in this case than your suggestion of trying to measure and adjust for all relevant confounders, they just went about it in a silly way.
Z:
I’m not suggesting to measure and adjust for all relevant confounders, as this is impossible. I did suggest to adjust for differences between the two groups, but we have to recognize that this is just an approximation; you won’t be able to adjust for all differences.
Regarding the discontinuity analysis: the problem is that “distance from river” is only one of many differences between the groups, and I have no reason to think it’s a particularly important difference. If you look at the examples where discontinuity analysis makes sense, these are examples where the one predictor is important for predicting the outcome (for example, pre-test scores and post-test scores). If the predictor isn’t a good predictor, then you’re performing an observational study adjusting for just one predictor, and that’s problematic.
Andrew,
I honestly do not understand this criticism. The nice thing about an RD is that you do not have to adjust for those differences — observable or unobservable — that is why it such an appealing research design in some cases. (The intuition of course is that the units of observation on either side of the cutoff should be similar (on average) along any dimension.)
As it turns out, there simply isn’t an effect on life expectancy in this case (at least near the cutoff, which is the variation the RD is exploiting). You are correct that you could just control for some observables and compare North to South, which allows you to exploit more of the variation in the data, but then of course it’s very likely you are not controlling for relevant unobservables. You should at least acknowledge the tradeoff you are making here; RD is not just some “statistical trick”, it has very real benefits if done well in that it does mimic random assignment.
Further, looking at the figure above, it doesn’t appear that there is an effect even if you were to compare all of the North and South units. Of course this could change once things are conditioned on, but a priori I’m probably not going to believe that result (after all.. they are likely different along many dimensions that cannot be controlled for). This is what empirical work was like in the 70s, 80s, and 90s in economics, people just controlled for things and called it a day. And to be honest, that work sucked. There could be a point to be made that the pendulum has swung too far in the other direction towards clean identification (especially cause few people care about estimation issues, ala Garden of Forking Paths), but overall it is a good thing in my opinion.
A legitimate criticism would be this: because researchers have the incentive to produce “clean, causal identification”, this married them to the idea of using a quasi-experimental method such as RD, and so even when their initial attempts using standard polynomial fits failed, they pushed on and came up with this absurd polynomial fit shown in the figure above. Once their initial analysis failed, ya, they probably should have just done a selection on observables design. But a priori, of course this setting lends itself to an RD, and I definitely think that is the first-best method to use here. The reality is there probably just isn’t an effect, and it’s too bad the researchers weren’t comfortable publishing a null result paper. But for you to go on to criticize RD as a silly “statistical trick”.. that itself is silly and just incorrect, and it further updates my prior that you are out of touch with modern causal inference.
Matt:
You write, “RD is not just some ‘statistical trick’, it has very real benefits if done well in that it does mimic random assignment.”
“Statistical trick” is just words, so maybe we can forget that particular phrase that I used. The real point is that, no, discontinuity does not mimic random assignment in any way here! What we have is observational data with no overlap between exposed and control groups on this variable. It’s only “clean identification” if you ignore all other differences between the two groups . . . but there’s no reason to ignore all other differences between groups.
Here, let me repeat what I wrote elsewhere in this thread:
What’s funny is that in a traditional observational-study context, you want overlap. When there’s no overlap, you have to model, which is fine, but then inference will necessarily be highly sensitive to the model, which is a big deal when there is no good theoretical/substantive reason for any model. (In this case, there’s obviously no justification for a polynomial regression model, but, more generally, there’s no justification for any model which presupposes that distance from the river is the only variable that matters, or that the communities on the two sides of the river differ in no other ways than north-south distance from the river.) Anyway, it’s funny/disturbing that the very weakness of the discontinuity design—no overlap between exposed and control groups—is taken as a strength.
See my comment below. You have forgotten what the motivation is behind an RD. https://www.princeton.edu/~davidlee/wp/RDDEconomics.pdf
>Regarding the discontinuity analysis: the problem is that “distance from river” is only one of many differences between the groups, and I have no reason to think it’s a particularly important difference
Indeed, it’s just a proxy for the actual mechanistic difference which is exposure to coal combustion products. However, this exposure is mediated through complicated fluid dynamics known as “weather” and rivers cause localized weather of their own. Strong winds off the water might well make it so that people just north of the river get pretty clean air, but people hundreds of miles elsewhere not even included in the study are the ones that receive most of the coal smog… or not… but what’s really needed is knowledge of the coal smog level through time, and of the human migration patterns through the coal smog affected area (if there is enormous turnover in population for example).
So, the real problem is that this is a gimmick to get publication, not an actual analysis of a natural experiment.
Daniel… your arrogance never ceases to amaze me. An RD would work fine here, there just isn’t an effect on life expectancy and for some reason the authors felt compelled to force an effect to appear by altering the polynomials in odd ways. That was a mistake. But look at the paper… in Figure 2 they clear show that there is a change in pollution at the discontinuity. Are you denying that the existence of a discontinuity here? You don’t need to understand the mechanism underlying this to go on and estimate the effect of this pollution increase on life expectancy. That is reduced-form work, and it can be useful, contrary to popular (at least, on this blog) belief.
This is yet another example of you crashing in guns blazing and claiming the authors should be doing an incredibly complicated mechanistic modelling approach with data that doesn’t even exist. Do you ever pause to think that maybe, just MAYBE, not every single academic is an imbecile? Have a little humility, jesus christ.
I was definitely taught to act like an imbecile* by academics.
* Test a strawman hypothesis, interpret arbitrary regression coefficients, etc
ah the “arbitrary regression coefficients” hypothesis. That one never gets old. Anoneuoid can’t handle the fact that which group you omit changes the interpretation of the regression coefficient, even though the information it contains stays the same.
I would just like for there to be a little less cheap talk from you and Daniel. You both criticize everything that comes out of social science, yet you have little quality research in the area to show for yourselves. Just saying. Gets tiring.
Sorry matt, but you seem incapable of understanding that regression coefficients are conditional on what is included in the model. Change the model, change the coefficients. This has been explained to you before, but you choose to argue with a strawman.
Anyone can easily prove it to themselves by adding/dropping variables or interactions and examining the results. Unless your model is correctly specified, the coefficients are arbitrary.
*mino
What’s your point though? This is true of any model — if the model is misspecified then ya, the coefficients won’t map to reality. I don’t see why regression is any different. That doesn’t mean we shouldn’t use it, it just means we need to defend the model we are using based on theory or common sense. I ask again, what is your point good sir?
You can use any model for prediction, but it is a waste of time to attempt interpreting the coefficients/parameters unless they were derived from some principles that you are willing to accept as more or less true.
Ie, if I assume cells always undergo binary division according to a certain rate I may come up with the number of cells after time t is:
N(t) = N_0*2^(r*t)
All the parameters have well defined meaning that could be checked in other ways (which, along with the N(t) vs t curve, tells us how good our assumptions are collectively). Not the case for an arbitrary regression coefficient.
This is just an unreasonably high standard, Anoneuoid. The estimates from any statistical model will be conditional on the variables that are included in it. Even if none of the omitted variables *should* be in the model, there will be some noise that gets picked up and affects things slightly anyways due to finite samples. This is a remarkably vacuous point, the more I think about it. Which, I’ve come to expect from you.
I don’t criticize “everything that comes out of social science”, it’s unfortunate that this blog mostly discusses bad examples. I did send that study of diet, where they did a very careful job of measurement… I mean, maybe not perfect, but about two orders of magnitude better than what you see in most diet research. That was good stuff, I’m glad they’re following up with a replication and some other kinds of follow ups.
Andrew’s own research on demographic corrections to death rates was good stuff: https://statmodeling.stat.columbia.edu/2017/07/11/criticism-economists-journalists-jumping-conclusions-based-mortality-trends/
I don’t sit around reading the social science literature looking for good examples. If you want to discuss examples of what you think of as good social sciences, I suggest you send examples to Andrew.
Well that is the standard for doing science. And it only seems high to people who have been getting away with BS.
Read the literature on your topic before the 1940s or so (whenever NHST was adopted) to see what to do.
There is nothing vacuous about doing science instead of wasting your time trying to interpret arbitrary numbers. It is on the level of astrology.
Mino:
Regarding “high standards”: I think it’s fine to present inferences that depend strongly on unverified assumptions. It’s just important to make clear what these assumptions are. The problem comes when there are strong assumptions that are not understood by the authors, reviewers, and promoters of a paper.
So, just to clarify Anoneuoid.. you wouldn’t recommend doing anything Andrew lays out in his book with Jennifer? Because I believe most of that material is not derived from first principles like your cell growth example. In social science you aren’t going to get anywhere without making some assumptions. Are you against Bayesian modelling in general insofar as it involves interpreting the coefficients in any causal way? Because certainly nearly every Bayesian model will have assumptions that we don’t “all agree are true”. Again, it seems like your standard will basically never be met.
Andrew, I think it’s fine to present some assumptions and their consequences too, but some studies are better than other studies, and this study is no different than the South Central LA vs Glendale study I made up here:
https://statmodeling.stat.columbia.edu/2019/11/05/the-incentives-are-all-wrong-causal-inference-edition/#comment-1156393
It feels like the only reason this got published is because “Chinese people are all basically the same except for which side of the river they live on” was basically an assumption that everyone involved, authors and reviewers, thought was ok.
Seriously.
I finally looked at the pollution vs latitude plot in figure 2, the curve doesn’t even fit. The pollution increases for ~5-10 degrees as you go north of the river. It isn’t a discontinuity as they predicted:
https://www.pnas.org/content/early/2013/07/03/1300018110.abstract
I mean I don’t even understand why they would expect a discontinuity instead of the pollution spreading out due to the wind. It makes no sense to me…
And I see they assume no other important factor is discontinuous at the river. That is a highly questionable assumption since the Chinese government decided to use that as a geographical boundary. You really want us to believe that happened without political considerations?
Also, even if that assumption was correct how in the world does this method “remove all potential sources of bias”? Maybe driving is more common as you go north for some reason, or the equipment used to measure pollution (TSP) is more sensitive for some reason because it was deployed in a north-south fashion, etc, etc.
I don’t think this data is capable of answering their questions.
Maybe people don’t stay in one place for 50 years. Maybe north of the river there are more paint factories adding to ozone smog. Maybe there are systematic racial or regional biases that affect many other political policies, giving favoritism to the north. Maybe the access to free coal makes the north region more attractive to elderly people moving in from rural areas. Maybe a factory pollutes the ground water north of the river. Maybe south of the river there are a lot more textile factories with high levels of dust and fiber pollution on the sewing floors….
If I do a regression discontinuity on “distance north of the 10 freeway” I will find out how the discontinuity in policy created by building the 10 freeway in the 1930’s caused the difference between South Central LA and Glendale…
Yes, essentially it doesn’t stand up to the slightest bit of scrutiny. The only difference between this and something like the standard biomed paper is the methods are easier to understand and the jargon is easier to parse for outsiders.
Daniel:
I don’t think the assumption was “Chinese people are all the same.” I think the assumption was “Regression discontinuity gives causal identification and statistical significance implies that you can treat a data-based claim as representing a larger truth.”
The authors and journal editors are wrong on both counts, but it’s hard to blame them, at least when the paper was written, given that this is how they were taught. I blame the authors more, years later, for not accepting the problem now that it’s been pointed out to them. Then again, Satoshi Kanazawa has never accepted that his sex-ratio statistics are essentially pure noise, etc etc etc.
But “causal identification” If and Only If “nothing changes rapidly about these people (that can affect their longevity) except the air they breathe”
One assumption is logically equivalent to the other. No one thought it out really….
In some ways this is Jayne’s mind projection fallacy: “because I don’t know anything that’s dramatically different… therefore nothing is dramatically different”
Daniel:
I think your argument is a bit too strong here. After all, if they really had a controlled experiment with randomized assignment and a large sample size and no interference between units and a plausible measure of life expectancy, then I’d be inclined to believe the result.
Sure because if they had all that “nothing changes rapidly about these people (that can affect their longevity) except the air they breathe, and all the other things we measured and controlled for because we had experimental control and we randomly assigned them” would be true right?
I mean that’s what a controlled experiment with randomized assignment and a large sample size ensures is true…
In many ways I think this is a confusion of Bayesian vs Frequentist notions of random.
If you spend a lot of effort, like George Marsaglia’s career, to design and validate random number generators, then you actually run one of these validated random number generators and assign 30 million people to live on one or the other side of the river using it… you will guarantee through the actions of a validated random number generator, that the average of any quantity you like will be within epsilon of each other on either side of the river…
Contrast that with “I don’t know anything about these two groups of people and therefore I treat them as if they were randomly drawn from the same population”. There is nothing about the action of “treating them as if random” that actually makes it true… There is everything about running that RNG and forcing people to move that physically makes the assumption true.
Daniel:
You write:
No. The controlled experiment with randomized assignment and large sample size assures that there will be approximate pre-treatment balance between exposed and control groups. At that point, it’s ok if all sorts of things change rapidly about these people.
Obviously there would be all sorts of person to person variation, which isn’t what I meant. I don’t know how many people live in this region, but I’m going to guess it’s at least 10 million. If you took a random number generator and assigned them to be on one side of the river vs the other, any measure you like, the average would likely be the same to 3 or 4 significant figures.
It’s one thing if you have like 100 or 1000 people and you say that RNG assignment only “approximately” balances things… but with this size group everything would be balanced full stop.
like just imagine ages are uniformly between 0 and 90 years, there are 10 million people… we split them randomly in two groups… and calculate the mean and sd of each sub-group:
> ages assignments mean(ages[assignments==1])
[1] 45.00768
> mean(ages[assignments==0])
[1] 45.00057
> sd(ages[assignments==1])
[1] 25.98991
> sd(ages[assignments==0])
[1] 25.98389
everything is identical to 4 sig figs. That’d be true for virtually ANYTHING you measure…. mean height of girls age 9 to 13, number of people with toe fetishes, whatever…
dang it, blog ate the code… here using the = instead of left arrow assignment
> ages = runif(10e6,0,90)
> assignments = rbinom(10e6,1,p=.5)
> mean(ages[assignments==1])
[1] 45.00768
> mean(ages[assignments==0])
[1] 45.00057
> sd(ages[assignments==1])
[1] 25.98991
> sd(ages[assignments==0])
[1] 25.98389
Daniel:
I don’t think it’s fair to say “this is a gimmick to get publication, not an actual analysis of a natural experiment.” More accurate, I think, is to say that this is a natural experiment which is being analyzed in a conventional way without an understanding of what makes the conventional analysis make sense, when it does make sense.
I wonder, did they “not understand” or did they just do the analysis because they saw that it follows a formula that let’s them “get a paper”. Do they even care what the result is and whether it’s correct?
Daniel:
I have every reason to think they care, and I have every reason to think they used the regression discontinuity analysis with the high degree polynomial because they thought this was state-of-the-art methodology.
I guess that’s something. I mean, I’ve been in meetings where a proposed collaborator said something along the lines of “as long as we get to publish in Nature without any competitors to worry about we are on board”… didn’t matter what it was really…
To me, this kind of analysis just screams “we have the answer because Science(tm)” and it doesn’t feel like the answer actually matters, it’s the fact of having done the right process. As far as the answer goes, it’s kind of “heads I win, tails you lose”
I mean, if they find “on average 5 years lost to pollution in river region” then they can say “because Science(tm)” and claim that everyone may have known all along, but now they have a specific number that no-one else could have calculated! Heroes!
And if they find “coal pollution doesn’t cause reduced life expectancy” then they can say “because Science(tm)” this may be unexpected, but that’s what happens when you make a discovery, and now we know we’re free to burn dirty coal to power human development!
This plays into your narrative about Econ sometimes showing how people are irrational for doing something that seems “obviously” good, and sometimes rational for doing something “obviously” bad.
All the good scientists I know are constantly asking questions like “what else might have caused this? what else should we control for? What additional data could we collect that would answer those questions? What kind of modifications to our model would let us account for the effect of X…”. Those are literally like the content of group meetings.
Anyone who asks those kinds of questions quickly discovers “well, we’re never going to be able to actually answer this question here” and doesn’t publish… Or if they care enough about the problem they spend multiple years building up the evidentiary base and making sure they get as close to the right answer as possible…. Suckers… spending 20 years of their life studying the effects of pollution, they could have just run an RD regression and had a paper in a couple of months!
:-(
So, if you’re right, that this is ignorance rather than rent-seeking. Where does that point the finger? I mean how did they get so ignorant?
Daniel:
This is something I’ve thought a lot about. It seems that a lot of this sloppy science is driven by a push for rigor. Same with all those p-values: they’re supposed to represent rigorous Popperian reasoning.
Relatedly, econometricians are trained to not trust probability models. They want things to be nonparametric. When they fit the 5th-degree polynomial, it’s not because they think this is a good model, it’s because they think they’re following a robust procedure with good statistical processes.
And they’re trained not to trust simple observational studies. They demand causal identification.
The result is sometimes a careful vetting of assumptions and models, but other times it’s the “I got causal identification and I got statistical significance and I’m outta here” mentality. It’s sad: the goal of rigor leading to anti-rigor in practice.
Along with all that you have the social incentives: publication in top journals, grants, awards, professorships, etc. These people mostly didn’t get where they were by admitting they’ve ever been wrong.
Professor Gelman,
Isn’t the whole attractiveness of RDD that there is no difference between units on either side of the threshold and therefore no need to control for confounding? If that assumption is violated you’re just back to OLS with a fixed effect at some jump point, no?
Jackson:
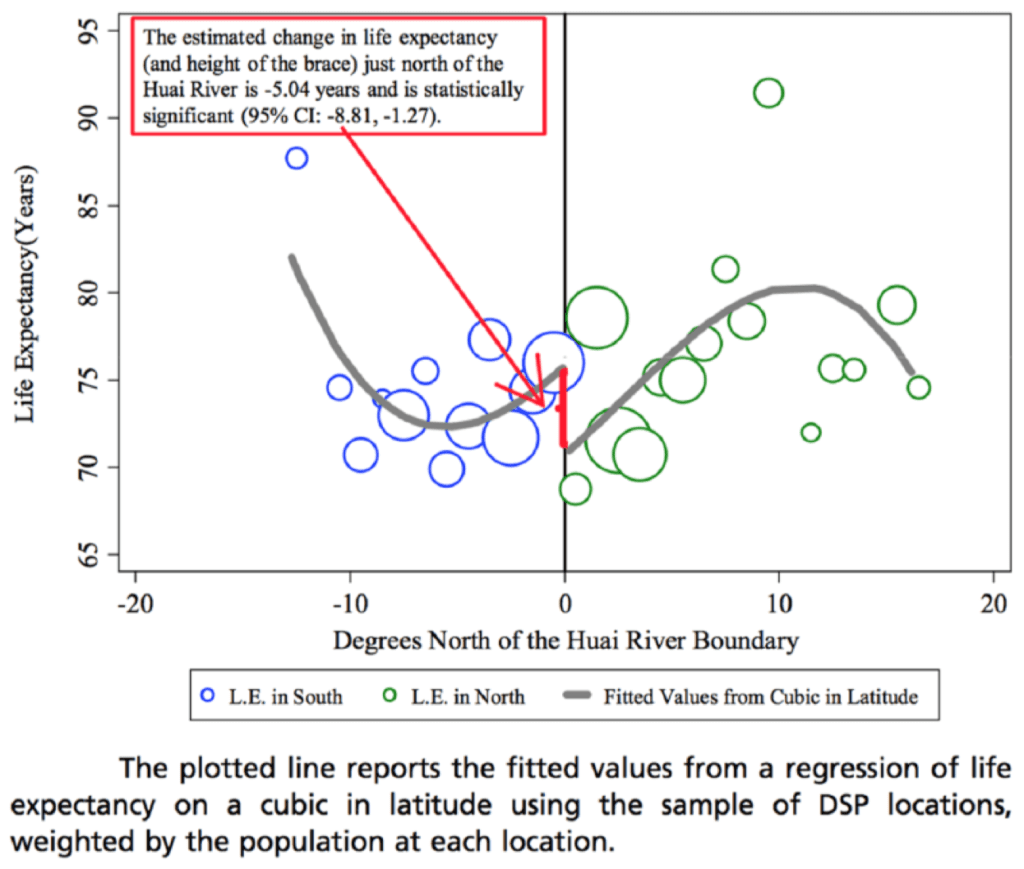
Yes, the discontinuity analysis is a regression with a jump point. It’s a model. In some settings it will be a good model, other settings (such as this one), not so much. Also there are some data issues such as the place where, according to the graph, life expectancy is 91. I don’t know if we should believe that.
There is some kind of run-on (un-closed) italics tag in the post that is converting the rest of the blog into italics…
Fixed; thanks.
It’s giving me a headache
I don’t think you’re going to change the incentives that favor novel “well identified” results, ever. What you can do is raise the bar for publication by pointing out why this RD design was poorly designed, and indeed why RD doesn’t really make sense in this context. And I think you do a great job at this and that it provides a real service to the research community in general. Maybe at some point in time, nothing will be left in the “cleanly identified” bucket and they’ll have to publish observational studies.
Gulic:
What’s funny is that in a traditional observational-study context, you want overlap. When there’s no overlap, you have to model, which is fine, but then inference will necessarily be highly sensitive to the model, which is a big deal when there is no good theoretical/substantive reason for any model. (In this case, there’s obviously no justification for a polynomial regression model, but, more generally, there’s no justification for any model which presupposes that distance from the river is the only variable that matters, or that the communities on the two sides of the river differ in no other ways than north-south distance from the river.) Anyway, it’s funny/disturbing that the very weakness of the discontinuity design—no overlap between exposed and control groups—is taken as a strength.
Andrew,
Again, the whole point of an RD design is that you do not have to control for the other things… the theory of RD indicates they should be similar on either side of this arbitrary cutoff. That is literally the whole point of an RD and you seem to have missed it, judging by multiple comments you’ve made now. You aren’t using much of the variation, if any, from units located further from the river. You are comparing those on either side of the cutoff, who should be very similar.
Matt:
You say, “the whole point of an RD design is that you do not have to control for the other things… the theory of RD indicates they should be similar on either side of this arbitrary cutoff.”
This is an assumption. There’s no reason in this case to suppose this assumption is true, or close to true. These are different cities located in different places. You write that I seem to have missed “the whole point of an RD.” I haven’t missed the point. I see the point. The point is they’re making a very strong assumption that the exposed and control groups are balanced on all other factors, and there’s no reason to think that in this case. Indeed, I don’t think the authors even tried to justify this assumption, because I don’t think they realized it was an assumption. They just seemed to think that RD allows you to get identification. But that’s a mistake. If you look at the classic textbook cases that make sense, these are examples where it does make sense to assume balance on the other variables.
I think the key word in your above comment is “arbitrary.” You write, “this arbitrary cutoff.” But it’s not an arbitrary cutoff. The cutoff is the location of a major river.
Fine, then maybe you should say this in the blog post: RD doesn’t work here because people are “manipulating”, to use the language of RD practitioners, which side of the river they live on, and so maybe they aren’t similar. Don’t just dismiss the entire method outright. And while an observational study may have been better than the RD, I don’t think that automatically makes it worthy of publication simply because it does better than an RD or whatever other identification strategy you could try. Some questions aren’t that interesting, so unless you have a way of providing very convincing evidence on it, it might not deserve publication.
Matt:
People aren’t manipulating which side of the river they live on. The cities and the river were already there.
It really seems quite simple to me. A policy was done in some places but not others. This is a natural experiment. To estimate the causal effect of the intervention, we should adjust for pre-treatment differences between exposed and unexposed places. There are lots of things one could adjust for. It’s not an easy problem. The regression discontinuity analysis adjusts for just one of these possible variables. There’s no reason to think that adjusting for just one variable should be enough, unless you have some particular theoretical or empirical reasons to justify that view, and such reasons are not present here. Indeed, the only reason given for choosing this variable to adjust for, is that there is no overlap on this variable. I agree that when there’s no overlap on a variable, it’s important to model it—but that does not imply that you can get away without considering any other variables!
I don’t dismiss the entire method of regression discontinuity analysis—indeed, Jennifer and I discuss the method in our book! I’m dismissing it in the above example because I don’t see its strong assumptions as being appropriate, and I’m disturbed because I think the authors used this apparent identification as a reason to turn off their observational-study-thinking brains.
They are manipulating it: they are able to decide which side of the river to live on. I agree manipulate is an odd descriptor, but that is the language used in RDD.
I understand your point, I was triggered by the way you wrote your post, as I think you are straw-manning RD as a method in general. You say the assumptions are strong in an RD.. but they actually are not in a lot of settings. That is why people like them. It only needs to be the case that people cannot precisely manipulate the running variable for an RD design to be valid. I agree in this case it’s violated.. I didn’t look at the paper’s context that closely.
Matt:
I guess it’s an empirical question. I was assuming that people are already living in these cities, irrespective of the policies. I agree that it’s theoretically possible that people are moving to or from these cities based on the policies, but I doubt that’s an important issue here. My main concern is that the cities were different in various ways before the policy was implemented.
I disagree with your statement that, “It only needs to be the case that people cannot precisely manipulate the running variable for an RD design to be valid.” Even if nobody had moved in or out of these cities in 50 years (so that there is no manipulation of the running variable), the RD analysis is still only adjusting for one of many possible pre-treatment differences between the cities, and there’s no good reason to think that this is the only variable or even the best variable to adjust for.
It would actually not be unreasonable to assume there’s people moving between the cities close to the river if the cutoff point (i.e. using the river as the cutoff) was determined based on factors such as political power or economic importance (cities could be different in terms of these characteristics). I haven’t read the paper so I can’t comment on that.
Matt:
Also, you write, “an observational study may have been better than the RD.” Just to be clear: the RD is an observational study. It is just a very particular observational study, designed with one hand tied behind its back.
RD assumes similarity in all other variables, which may or may not be true in reality. For this particular study, I am not sure we can simply assume that regions across a major geographical divide (Huai River) are similar.
You keep saying that other people don’t understand RD. It’s clear that you don’t understand RD
> Again, the whole point of an RD design is that you do not have to control for the other things… the theory of RD indicates they should be similar on either side of this arbitrary cutoff
No, that’s not the point of an RD. The theory of the RD does not say that. The assumptions of RD say that. From the very paper you link:
“If it is “reasonable” to assume that all factors (other than the award) are evolving “smoothly” with respect to X, then B′ would be a reasonable guess for the value of Y of an individual scoring c (and hence receiving the treatment). ”
If there are other omitted variables that are correlated in a non-smooth way with being left or right of the discontinuity point, then you don’t have clean causal identification. RD is essentially a a type of observational study where you have one covariate and a treatment variable which is determined by the split on that covariate. It allows causal identification on that indicator variable controlling for underlying smooth trends in the covariate. It doesn’t magically control for everything else.
Consider the motivating example of RD: achievement awards at a discontinuity in test scores. The classic RD goes something like
Y = achievement
X = test score
People get an award at X > 75, place an indicator there and call it Z
Suppose the true model is
Y = x b + c z
The test scores are already linearly correlated with achievement whether there’s an award there or not, so the RDD identifies the causal effect of the award.
Suppose in addition to the award if you score above 75, half the parents have decided to buy their kid a car if they score above a 75. How is an RDD allowing you to identify the effect of the award without controlling for the effect of getting bought a car?
For non-parametric identification, the typical assumption is taking limits from both sides so that the differences in potential outcomes on each side are vanishing. I would say this is the standard assumption in recent empirical economics.
An alternative is to rely heavily on a parametric model like the one you wrote down, which, as Andrew, notes, is clearly misspecified.
For elucidation of all this in spatial RD settings like this, see https://arxiv.org/abs/1705.01677
I would think that when you are using a method with fairly testable assumptions that have likely been violated the most natural thing to check is the assumptions. We could throw it all out and say “model it!” but wouldn’t it be easier to, you know, check the assumptions? Yes, the polynomial is garbage, toss that too.
I don’t see why this isn’t a case of “assumptions violated, bad polynomial gives bad fit, bad conclusions”.
Jackson:
Yes, exactly. The problem is that the researchers and journal editors seemed to be under the impression that because RD is an identification strategy, there was no need to assess its strong assumptions.
“because RD is an identification strategy, there was no need to assess its strong assumptions.”
Or we could generalize to most of science:
“because mostly no one cares if the method assumptions are met or not, mostly no one bothers to assess them at all, except possibly a little lip service to perfunctorily conclude that all assumptions are met”
Jim,
I think that’s a bit too cynical. People care. They just don’t know where to focus their attention. They end up focusing on heteroscedasticity or discreteness in test statistics or all sorts of peripheral things, but they don’t look hard at identification strategies or statistical significance because they’ve been taught that these are rock-solid bastions of rigor.
I haven’t read it but if they are attempting to interpret the coefficients of arbitrary models then that is a waste of time. As I said, such models can still be used to make predictions. ML is an extreme example of this.
Anyone with experience in ml knows how much the coefficients (or other measures like feature importance) can change by adding/dropping features.
Now, like I said I don’t know what is in that book but you can see the basic idea mentioned on the blog here:
https://statmodeling.stat.columbia.edu/2017/01/04/30805/
Also, it is pretty much just a logical conclusion if you accept the multiverse and garden of forking paths concepts as shown in this paper:
https://statmodeling.stat.columbia.edu/2019/08/01/the-garden-of-forking-paths/
In that paper they discover there are hundreds of millions of different linear model specifications that could be deemed plausible, with coefficients of interest ranging from positive to negative. Later on they say the correct model is probably even linear anyway…
So if he does it in the book, it is inconsistent with what I read on this blog.
As for “it is too hard so your standard will never be met”, I was told the same thing regarding biomed and can verify that is completely false. Here are some good example papers:
https://statmodeling.stat.columbia.edu/2017/07/20/nobel-prize-winning-economist-become-victim-bog-standard-selection-bias/#comment-530272
The problem is more the data being collected isn’t the right type to learn anything (instead it is meant to check if two groups are different), and the researchers have no idea how to formally derive predictions from a set of assumptions so they have something to test. They often are not even trained in basic tools needed to study dynamic systems like running simulations and calculus. I certainly needed to teach myself.
What strikes me is that the spread of the observed life expectancies is so wide, from about 70 to 82, even leaving out a couple of high outliers. If this was true if would be huge! (the strongest modifiable predictor of mortality is smoking, and the difference in LE between smokers and nonsmokers is about 7 years.) If really moving 1 degree North gave you 1 extra year of life (that is about the slope I discern) we should all be building igloos on the North pole.
So my guess is that the variance we see is mostly noise. Take that, and fit 6 or 7 parameters to 25 or so data points…
This recent article in he Economist (https://www.economist.com/united-states/2019/10/10/a-ride-along-chicagos-red-line) claims that the life expectancy varies by 30 years (!) from one end of a Chicago metro line to the other.
Thanks. I guess things add up – crime, drug use, lack of access to care, moving away as soon as you can afford it… Still, 30 is a lot, I wonder if that gradient replicates in other US cities. Small area analyses can be fraught.
The biggest modifiable factor affecting life expectancy at birth is probably the abortion rate.
Do you mean infanticide? I don’t think abortions count as births.
Precisely. Abortions are not counted.
Babies expected to be poor, ill, or unwanted are most likely to be aborted. So abortion lowers infant mortality, and increases life expectancy. Contraceptive use has the same effect. So does anything that will increase miscarriage rates.
The data suggest that this is indeed the case, not only for statistical methods but for methodology in general: higher ranked journals publish science with less rigorous methods:
“Prestigious Science Journals Struggle to Reach Even Average Reliability”
https://www.frontiersin.org/articles/10.3389/fnhum.2018.00037/full
https://www.etymonline.com/word/prestige
I would welcome your thoughts about this possible alternative approach RD! It makes many assumptions of course but they are transparent at least. It might address many of the concerns raised in these discussions about RD.
https://arxiv.org/abs/1808.09169.
Huw:
I disagree with the very first sentence of your abstract: “A randomised controlled trial (RCT) is accepted as the best way of assessing the efficacy of a treatment.”
Not the best start! What should I have said?
A randomised controlled trial (RCT) is accepted as the best way of assessing the _average_ efficacy of a treatment in settings where it is not feasible to apply both treatments to each person.
This is in my experience a key point missed by a lot of trial-investigators and interpreters, personalized medicine notwithstanding. If there is a lot of treatment effect heterogeneity, which is often the case, clinical recommendations based on an estimate of average efficacy will correspondingly often be bad predictions of clinical effect.
+1
And corollary: Patient and physician beware! –reporting, publishing, and paying attention to data on incidence of side effects is important.
Andrew
If I were to replace ‘accepted’ with ‘widely regarded’ would this be sufficient to allow for different opinions about how to assess efficacy or do you have more fundamental objections?
Huw
Don’t listen to him, Huw – he’s an extremist.
Huw:
See my recommended wording in the above comment: “A randomised controlled trial (RCT) is accepted as the best way of assessing the _average_ efficacy of a treatment in settings _where it is not feasible to apply both treatments to each person_.”
Andrew
I accept that the sentence was much too loose. Thank you for pointing this out. Cross-over and ‘n of 1’ trials also need randomisation but simply in terms of order of intervention of course.
When the result of any RCT (cross-over or alternative) shows efficacy then there will be a reluctance to accept placebo in future, which is when my suggested approach becomes relevant.
Note that in medicine the severity of ‘disease’ is very important. Mild conditions usually resolve spontaneously due to the body’s self restorative mechanisms and very severe conditions may be beyond rescue. Probability curves of outcomes conditional on baseline measurements tend to be sigmoid, being flat in very mild and severe regions. The best therapeutic opportunity, with larger differences between treatment and control tends to be around the steep segments (see https://onlinelibrary.wiley.com/doi/abs/10.1111/jep.12981). The steeper the middle segment of the curve, the better the ‘diagnostic’ test used to select patients for the treatment. The greater the distance between the treatment and control curve, the more effective the treatment (by modelling with a constant odds ratio).
In order to estimate such probabilities of outcome, the outcome values are dichotomised and the distribution of baseline results estimated in those with and without the ‘dichotomised outcome’. This is done for the treatment and control group to provide pairs of sigmoid curves. The cut-off for dichotomising the outcomes can also be varied to create ‘families’ of curves.
This is a different approach to using RCTs to assess mean outcome values and effect size in the form of the distribution of possible mean differences between the outcomes on treatment and control.
Sorry! The first sentence of the above second paragraph should have been ‘The result of any CT (cross-over or randomised) ….