Or, how leafout is like driving to grandma’s house. Or, how a 90 minute fake data simulation solved a problem my lab had spent over 3000 hours on. Or, why did almost none of my co-authors like my sentence about how ‘climate change steps on the biological accelerator’?
Or… wait for it — crows are black because crows are black.
This post is by Lizzie and it’s about a paper I wrote with Andrew, Jonathan Auerbach, Cat Chamberlain, Dan Buonaiuto, Ailene Ettinger and Ignacio Morales-Castilla on one explanation for why biological responses to temperature are declining in recent decades. If you’re most interested in the paper, I suggest you just read the paper as it’s much shorter than this post (1100 versus 2100 words). This post travels through the paper’s origins (including fake data simulation!) and its trip through the friendly and peer review process, with a quick overview of the paper’s findings too.
About six years ago, a paper was published called `Declining global warming effects on the phenology of spring leaf unfolding,’ which led to lots of excitement in my tiny field of plant phenology (for North American readers: phenology is the timing of recurring life history events, such as leafout, flowering, when birds lay eggs etc.).
The paper showed that what we call a `temperature sensitivity’ (change in days per degree of temperature, as measured by linear regression) was getting smaller in magnitude recently. For example, if back in the 1980s birch tree leafout would advance 5 days per 1 degree of temperature increase, today it might be just 4 days per degree. If the trend continued, someday trees’ leafout would stand still in time perhaps, or maybe reverse and start leafing out *later* in warmer years.
I was at a meeting in Turkey reading through the supplement trying to figure what could be up with the paper. I am always worried about time-series analyses, and especially using the data they did (PEP 725) which varies in quantity and location over time. But I didn’t find anything obvious and when I talked to my colleague, Mark Schwartz, he knocked out a few additional hypotheses I had.
The biological hypothesis for this effect was obvious to everyone in the field, and laid out in the paper: temperate plants’ leafout generally responds strongly to spring temperatures and that has been the dominant controller on leafout. But, underneath the hood, plants also cue to daylength and winter cool temperatures (`chilling’); someday, if spring warming comes so early that the days are really short, or if chilling gets too low, then plants will wait a little until they leafout. And this will lead to a smaller (in magnitude) temperature sensitivity. Functionally, the biology currently suggests that with short days or low chilling plants will require more spring warming to leafout; this higher required spring warming is the most proximate delay of leafout, with chilling or daylength causing the higher threshold.
This was all well known from experiments. For decades (centuries probably), biologists have been taking dormant tree branches in the winter and putting them in little boxes where we can set light and temperature to different amounts to test and re-test this model. It’s effectively a fancy version of bringing in pussy willows to your warm house in the spring, except imagine you put some in the window, some in a cool corner, some in a warm corner etc..
At about this time, I was actually starting a meta-analysis of such experiments to estimate the effects across species of spring warming, winter cool and daylength, and about four years later was scratching my head when the results didn’t jive with the declining sensitivity paradigm in the field. And at this point a good number of high profile papers had documented this effects (here’s just a couple from PNAS, and Nature Climate Change). Working with some excellent folks in my lab (four of the co-authors listed) we’d been taking the model from our meta-analysis and checking what it predicted for regions seeing declining sensitivities, and we could not match predictions of `declining sensitivities’ unless we warmed up the world 4C or higher (it’s warmed about 1 to 2 C in Europe). Staring again at the underlying observational data I realized that a 1 degree warmer day when it’s cool is not the same as a 1 degree warmer day when it’s warmer.
Makes total sense, right?
No, it probably doesn’t and that’s about where I was for a bit. I quickly wrote up simulations that showed my hunch could be correct, but I struggled to explain what was going on. I spent a while calling it a ‘non-stationarity in the unit of day’ issue.
And around then, in pre-Covid times, I swung through New York in a land where people used to hang out in the their offices, grad students in stats even used to offer in-person open sit-down-here-next-to-me-and-tell-me-your-statistical-troubles stats advice hours. I spent a while explaining my model to Andrew as simply as I could, explaining what is often called the ‘bucket model’ of leafout: plants need a certain amount of spring warming to fill the bucket, when the bucket is full, the plant leafs out. With climate change, days are a little warmer, so they fill the bucket more each day — so if you use a metric, such as temperature sensitivity, with day in the denominator, then it has to go down as the world warms even though plants require the same thermal sum to leaf out (are you getting my ‘non-stationarity in the unit of day’ yet?). The whole thing works without ever invoking daylength or winter temperatures (chilling). I was wobbling through this explanation — I had a couple cobbled together graphs about the underlying effect of temperature on plant development, and then the ‘bucket model’ and then connecting back to the linear regression, all of which I was dragging Andrew through in the lounge of the stats department.
When he left to get something in his office I wandered over to open office hours (also in the lounge of the stats department) to chat with Jonathan Auerbach, who is great fun to work with, and started dragging him through my problem. Andrew returned and we started de novo coding my simulation code (of course much nicer, since Jonathan wrote it). However, while I generally pegged my simulation code to a smaller (more realistic) range, Jonathan wrote up his to cover a big range of temperatures — 5 to 30 C.
As the simulated data showed up on the screen both Andrew and Jonathan had the eureka moment — “any process observed or measured as the time until reaching a threshold is inversely proportional to the speed at which that threshold is approached.”
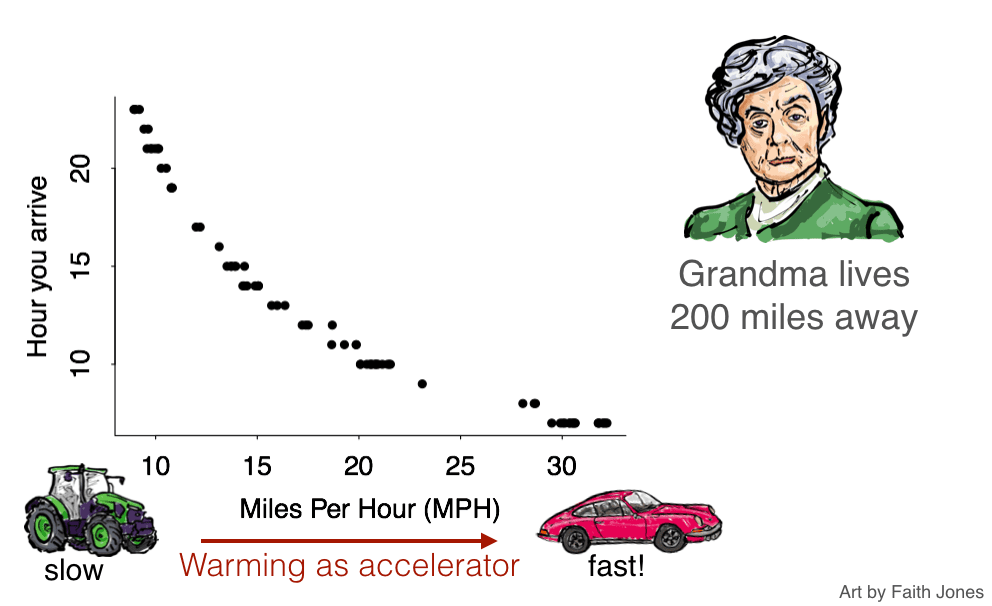
Getting to leafout is just like driving grandma’s house, as Andrew explained it. In this case, day of leafout is akin to how long it takes to get to grandma’s house, and temperature is akin to average speed: the relationship is inherently non-linear so comparing the effect of 1 degree warming at different points along the speed (temperature) axis will give different slopes. We all know that if you drive at 50 miles per hour, driving 5 miles per hour (10%) faster will have far less of an effect on your arrival time than if you were driving at 10 miles hour and drove 5 miles (50%) faster.
But somehow I, and most everyone in my field, did not see this connection.
Instead we felt intuitively (and damn strongly if you ask me) that the slope should be constant. If you ask people about the underlying model, they will mention it’s a threshold process, so we all seemed to agree on that, but also felt strongly that using a linear model was fine. We also have a strong intuition about what should happen to the slope of a linear regression if you raise that threshold (the way short days or low winter chill should) — it should go down in magnitude. But all these intuitions are just plain wrong. I fell victim to them like everyone else.
What’s been interesting to me is how hard it’s been to get people to question that intuition. In our paper we don’t say this is definitely the cause of declining sensitivities, as we don’t know. We do state that it’s a simple explanation for it, based on the biological model we all claimed to agree on. And we did suggest a pretty simple correction to try — just log your data before you run your linear regression (and we showed that logged data did not show any sign of a declining sensitivity). But we still got a lot of fascinating responses when sending the paper out to review. While some jumped on board, at least half did not, and many of them seemed to jump up and down beside the boat demanding we all stay with them on the land.
I was surprised how much folks dug in. Here’s some of the most common responses:
- Mainly I found people came up with new models we should try that would show the declining sensitivity: these included trying a shifting window to `find’ the best temperature window (aka, highest correlation), decreasing winter chill that drives a higher spring warming threshold. We’ve basically done all of these and only recreated declining sensitivities with extreme effects of daylength. The rest of the models don’t produce it (even though I get that we all feel they should). And even then the log estimates picked up the change more clearly than a linear model.
- Many folks did not like that we suggested a log transformation (one reviewer wrote, “why this particular data transformation was used is not apparent. There are many other data transformations that could have been used as alternatives, and these could be explored for how they would affect the results”) even though the log is the natural transform of an inverse, which we wrote. I never fully got a good explanation for this. It seems a weird response to me coming from biologists. But it seemed often to go with ideas for a new model (my previous point).
- Multiple reviewers said that we only did the analysis for two of the original seven tree species in Fu et al. 2015 paper and thus our analysis was uncompelling. (True! I was too lazy to fit the type of thoughtful model I would want for the uneven data for all seven species, so we just did the two with the most even data where we could hold the data constant over time and space; we tested it with another species when asked and it too showed that the declining sensitivity result went away).
- Lots of folks looked at the supplement and said the model we proposed was too confusing, even though it’s just the math of a simple bucket model I am otherwise told is very simple.
I tried to show people how simple the model was, sending along code:
data <- data.frame(leaf_date = numeric(0),
                   cum_temp  = numeric(0),
                   mean_temp = numeric(0),
                   threshold = numeric(0),
                   delta     = numeric(0))
threshold <- 1000 # thermal sum for leafout
for(delta in c(5, 10, 15, 20)) { # this is warming added on
    for(sim in 1:1000) {
	temp <- delta * (1:100) + rnorm(100, 0, 50)
	leaf_date <- which.min(cumsum(temp) < threshold)
	cum_temp <- sum(temp[1:leaf_date])
	mean_temp <- mean(temp[1:leaf_date])
        data <- rbind(data, data.frame(leaf_date, cum_temp, mean_temp, threshold, delta))
    }
}
Once someone understood it, then they often would go to point 1 — they no longer thought that leafout happened after a certain thermal sum (if even they agreed strongly with that in an earlier email). It was fascinating!
I think though that my favorite reply was this one: “This MS provides a simple explanation for the observed non-linearity in biological temperature sensitivity… The MS develops a model to prove this point and it is very nicely written. Nevertheless, I found this somewhat uncompelling, because that the explanation appears to be the same as the observation (e.g. crows are black, because crows are black).”
There were also reviewers who wanted to skip over the issue we were discussing and find interesting new biology in the results. At PNAS one reviewer was adamant that we talk in depth about differences we had not deemed very different (slope of -0.17 versus -0.20, both with large uncertainty intervals).
I am happy to say the paper is finally published, and the last reviewer pointed us to this fascinating paper dating back several years, before Fu et al. 2015: “On the uncertainty of phenological responses to climate change, and implications for a terrestrial biosphere model,” which shows a MODEL that produces the declining sensitivity problem, and the reviewer asked, “If the model structure and parameters are fixed in time (suggesting the biology is also fixed), how can the temperature sensitivity change (which would imply that the biology ISN’T fixed)? Is the temperature sensitivity metric itself flawed?”
I’d like to thank Faith Jones for the artwork, my friend and colleague Caroline Tucker, for alerting me the paper was out (I wrote this post a little while ago), which she figured out via Twitter (thanks to this Tweet, thanks also to Alexa Fredston for the tweet). And I’d like to thank They Might be Giants for the paper’s theme song.