Last week we asked: what is a poll’s margin of error ? We considered MRP with Bayesian inference and no coverage error, no nonresponse error, no measurement error, and no model misspecficiation. This week we will see additional uncertainty because these assumptions don’t hold.

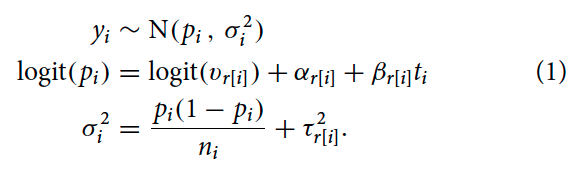
Disentangling Bias and Variance in Election Polls by Shirani-Mehr, Rothschild, Goel, and Gelman analyze 4221 polls from the final three weeks of 608 state-level presidential, senatorial, and gubernatorial elections between 1998 and 2014. Let:
- i indexes a poll, e.g. number 3559 in their data
- conducted at time t_i, e.g. Oct 19, 2012
- n_i respondents, e.g. 609
- for r[i] election, e.g. Tennessee 2012 presidential election
- y_i = Republican support as measured by the poll, e.g. 63.4%
- v_r[i] = Republican support in the election, e.g. 60.4%
They fit this model separately for each type of race:
They calculate bias for election r as E(p_i) – v_r. where E(p_i) is an average across polls conducted for election r. On average across presidential elections from 2000 to 2012, the absolute bias is 1 percentage point.
Considering both bias and variance combined into root mean square error (RMSE), they found that total survey error is about twice most reported margins of error, which typically only capture sampling variability. Andrew has a theory for why this is.
In Shirani-Mehr et al. this confused me (bolding mine):
explicitly accounting for more sources of variation when modeling the mean increases estimates of bias while simultaneously decreasing estimates of variance
Say we are comparing p_i = E(y_i | t_i) versus p_i* = E(y_i | x_i, t_i), where x_i could be e.g. a polling firm. Bias averages over p_i or p_i*, so if models are correct wouldn’t these be the same ? Can folks explain how estimates of bias would increase when including x_i ?
EDIT: Thanks to Anon for helping me think more about this ! Maybe this is the resolution ? Shirani-Mehr et al. have a few things they call “bias”:
- “bias of the ith poll” = logit(p_i) – logit(v_r[i]), which they define on the logit scale
- “bias for election r” = E(p_i) – v_r, which they call b_r
- “average election-level absolute bias” = average |b_r| across the elections they study
Let’s redefine bias of the ith poll as p_i – v_r, dropping the logit scale. The mean-square of this can be decomposed as:
E(p_i – v_r)^2 = V(p_i) + (E(p_i) – v_r)^2
Including x_i increases the variance, V(p_i*) > V(p_i), but the second term is the same if E(p_i) = E(p_i*). So the mean-square of the poll-level bias is larger when we include another source of variation, x_i. However, the election-level bias E(p_i) – v_r stays the same.
Putting this together, let’s try to Disentangle Bias and Variance. Mean-square poll-level error is:
E((y_i – v_r)^2 | t_i) = V(y_i | t_i) + (p_i – v_r)^2
When we include another source of variation, x_i, the variance term decreases by the law of total variance. The squared-bias term will depend on the poll, but its average will go up, as we saw.
Total Margin of Error for poll i is the square-root of this mean-square error. It can change based on what we condition on about that poll (e.g. by who and when was it conducted). Furthermore, how much of this error is “bias” versus “variance” will change as well.
If the new covariate is biased (e.g. x_i polls systematically deviate from truth), then won’t including x_i mean that you have an estimate of that bias, and so some of the total error moves from variance into bias? That is, previously random scatter is now soaked up by estimating the bias in the relationship of x_i with outcome.
Thanks, Anon !
“x_i polls systematically deviate from truth” – what does this mean ? i indexes polls, so x_i is a characteristic for a poll, e.g. maybe the pollster who conducted the poll. Do you mean if polls with x_i = A are more biased than polls with x_i = B ?
Including x_i in the model for the poll result y_i will reduce the estimate of the model’s variance sigma_i and increase the variability of the p_i parameter. However, the paper defines bias as the average of these p_i across all polls conducted for some election minus the true result of that election. I don’t see how this average would increase when we include x_i ?
Regarding adding covariates, in recent work (https://www.journals.uchicago.edu/doi/10.1086/736694
), we aim to develop a contextual understanding of why polls fail in some elections but not in others. We extend the Shirani-Mehr et al. modeling approach, which separates poll bias and variance at the election level, to link error components to electoral predictors. Using 6,375 pre-election polls across 318 U.S. Senate elections from 1990–2022, we document a trend toward smaller but more uniform errors and examine election features suspected of encouraging polling errors, including mobilization, candidacies, polarization, and electoral conduct.
Thanks so much, Jens ! I hadn’t seen this new work of yours, very excited to read. Do you have an unpaywalled version ?
Thanks Shira, glad to hear it! Yes, there’s an unpaywalled version available here:
https://doi.org/10.33774/apsa-2023-t1vh8-v2
I honestly think this rule that the total survey error is twice of the reported margin of error a bit nonsensical, because bias doesn’t typically scale with sample size. In fact, in practice, we see almost the opposite: smaller (and therefore larger MoE) more carefully designed probability sample surveys tend to have smaller total survey error than very large (and therefore smaller MoE) nonprobability sample surveys. And that’s because carefully designed probability-based surveys usually present smaller non-sampling bias than surveys using things like opt-in panels.
Raphael:
Good point. The factor of 2 was a convenient way for us to summarize the results of our 2018 paper but I agree that taking this as any kind of general rule or principle is problematic.