
John Cook points to this charmingly old-school webpage of mathematician Richard Stanley, whose suburban neighbors were Russian spies.
Stanley’s webpage, entitled “Here are a few links not directly related to my research,” is a mix of fun items, boring items, personal links, dead links, something on juggling (I guess you’d expect that from an MIT math professor), and this puzzle:

This one made me happy–it’s a statistics question, and I know the answer! It’s Christmas Day, 25 Dec:
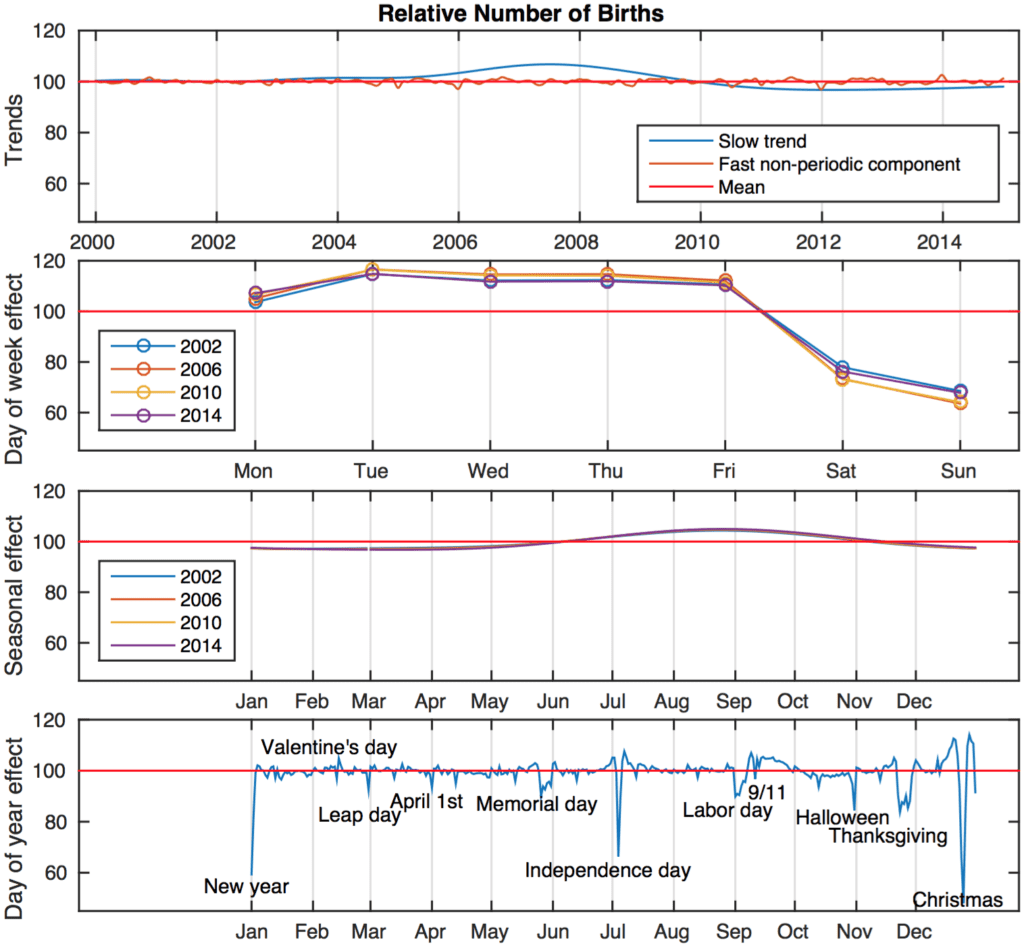
Sure, that’s all births, not just noninduced births–but the pattern for noninduced births has got to be similar. One reason there will be fewer noninduced births on 25 Dec is that a bunch of births were already induced the two days before.
There’s also evidence from this paper on Valentine’s Day and Halloween that spikes in noninduced and induced births go together:
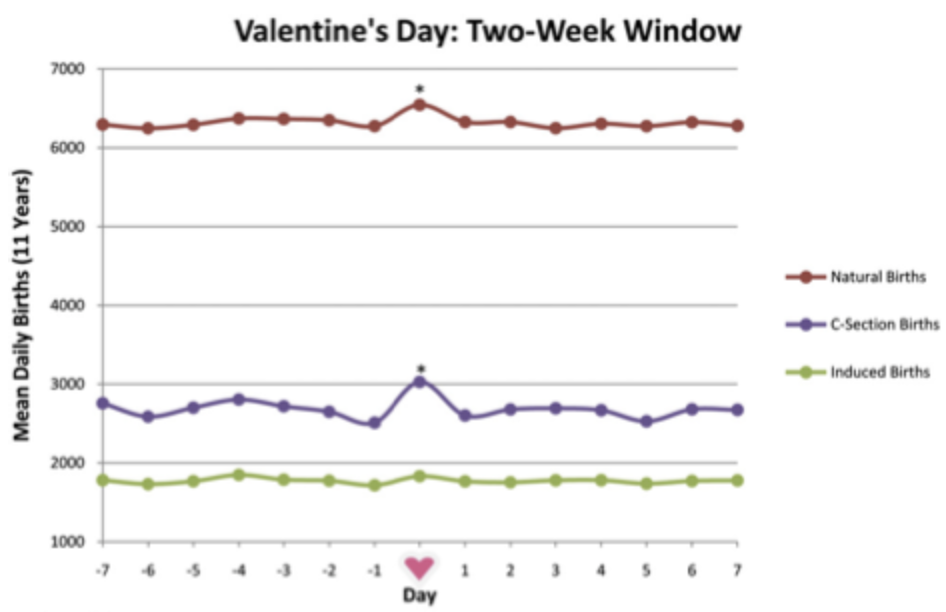
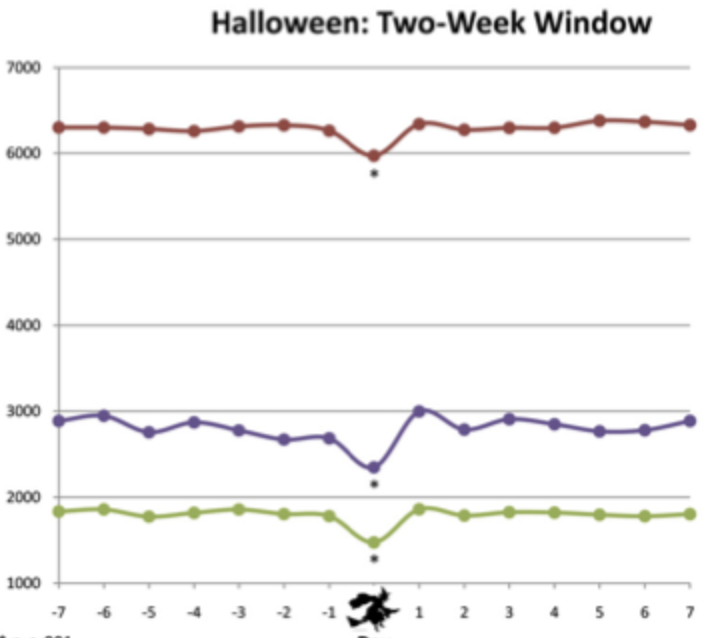
I was curious how Stanley had heard of this–had he read one of our posts on the topic, or maybe he saw it from the graphs on the cover of Bayesian Data Analysis, or maybe this was just some mathematical folklore, or maybe he’d been curious and looked up the numbers himself? I clicked through, and I was surprised to see his answer:

With this elaboration:
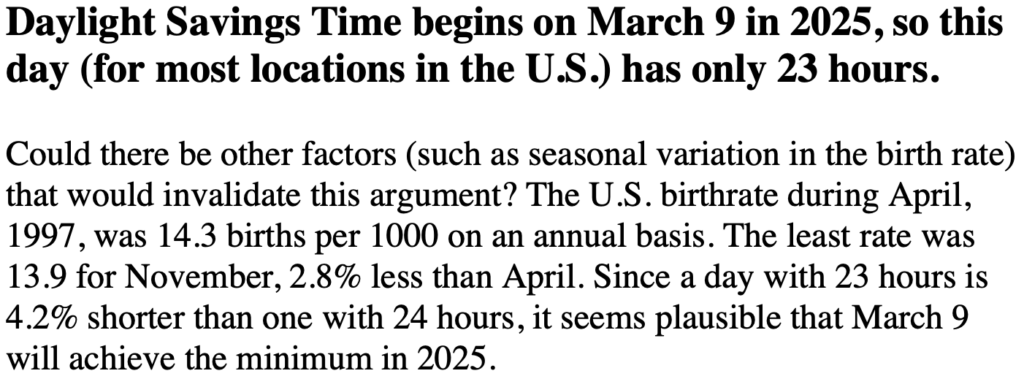
That’s a good catch–Aki and I hadn’t thought about that particular issue!–but a factor of 23/24 is pretty small compared to variation between days.
I guess that Stanley’s key mistake was to assume that the noninduced births occur uniformly over time, only varying by season but not by date, day of week, or time of day.
Also, fewer babies are born in the middle of the night:
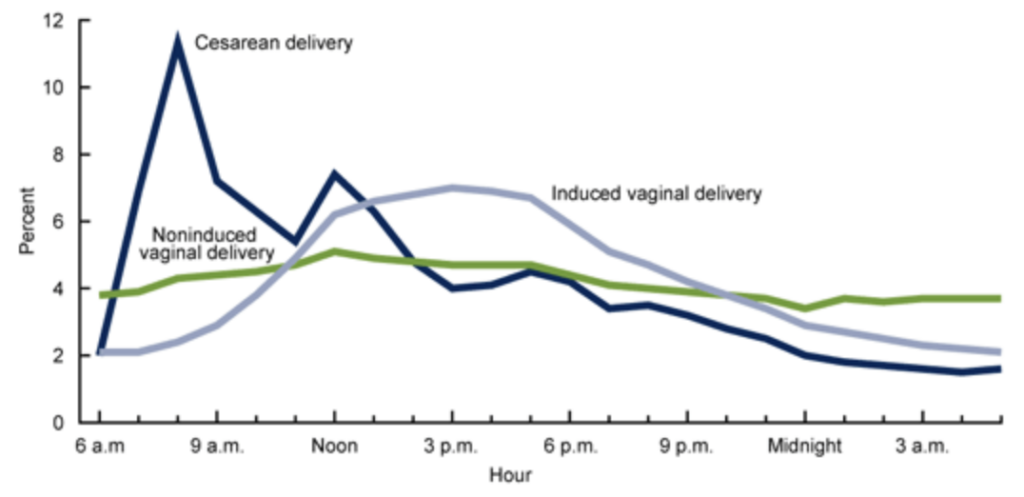
For lots more information, see this article, “Births and their outcomes by time, day and year: a retrospective birth cohort data linkage study.” It’s from Britain but discusses trends in other countries too.
Anyway, I’m pretty sure that Stanley is mistaken and that 9 Mar is not the day in 2025 that will have the fewest noninduced births.
It’s no big deal–everybody makes mistakes!–but I think it’s a revealing example of the difference between mathematics and statistics.
With mathematics, you start with assumptions–in this case, the assumption that the rate of births varies by season but not by date, day of week, or dime of day–and you use that to derive conclusions. With statistics, you start from the data and work from there.
Neither approach–mathematics or statistics–is always best. It’s good to have both tools. It’s also good to realize which tool is appropriate for which problems.
Stanley is from the Gian-Carlo Rota school of combinatorics. Stanley’s two volume “Enumerative Combinatorics” is the definitive text on the subject of enumerative combinatorics. None of it is applied math. Although, combinatorics in general sits at the intersection of math, statistics, and statistical physics, so it may yet be important for such. Anyway, just about everything Rota and Stanley wrote is worth reading in my hubristic opinion.
And a fantastic contributor to mathoverflow. Well worth reading there too.
Seems like there’s also a drop in mid-April. Tax day?
Now the puzzle is to think of a better setup for the March 9th punchline. Maybe, “On which day will the fewest people misspell the word ‘bureaucracy’?” or something like that.
How about, “On which day will the U.S. switch from standard time to daylight time?”
Which is the safest time to drive?
(The safest time to drive is 2-3am on March 9th — no car accidents were recorded in that hour.)
What day has the fewest 2:30am drunk dials to exes?
I recall reading to a class the assertion that more births occurred on a Friday in order that the physicians could spend time golfing on the weekend. One student, on the class evaluation at the end of the semester, took umbrage by noting that his uncle was an MD and my comment was out of place. That is, he did not dispute the fact, but thought it was an unwarranted personal insult nevertheless.
The extremely sharp drop on Christmas Day brought back memories when we rushed to a hospital on Christmas Day for our one-year old’s emergency and immediate surgery; the entire staff on duty that day were Jewish. Turned out that Becky had histocytosis X, a strange, but well chronicled affliction which is or is not cancer, depending on the decade being searched; years later, out of curiosity, when she was in college, she went back to the hospital to look up her record only to find there wasn’t any.
Paul:
The data above show slightly more births on Tuesday, not Friday.
Doctors prefer to perform c sections earlier in the week so the patients are monitored and discharged by the weekend. So yeah Tuesday makes sense. If you perform a bunch in fridays, you are going to be spending lots of time rounding through the weekend. Hospitals as a whole just have less staff, not just doctors, over the weekends. It is safer for patients who don’t need to be there in weekends to be discharged ahead of the weekend.
“With statistics, you start from the data and work from there.” — and a data set of hourly events that I was looking at recently recorded zero events for the hour of 2-3am on March 9th.
We used to send the new hires off to investigate the 4% decrease in events on the second Sunday in March. After they’d been looking in to it for a while, we asked them to also look into the 4% increase on a Sunday in early November. It had great value in helping them learn to think deeply about the data.
“Sure, that’s all births, not just noninduced births–but the pattern for noninduced births has got to be similar.”
I’m sorry, why does it have to be similar?
If you could divide into 2 groups: A) will induce and B) never induce, then I would expect group A to have (like) zero births on Dec. 25 because the hospital won’t schedule them. But I would expect group B to be roughly uniform over the year with only a seasonal effect. You suggest this is Stanley’s “key mistake”, but you offer no data or reasoning for why you think it is mistaken. If that assumption were valid, then the seasonal effect is small and March is at or near the seasonal low point anyway, so 23/24 on Mar. 9 starts to seem maybe-not-so-small.
Additional consideration 1) Time of day: fewer babies born in the middle of the night. But eyeballing the British study, it looks like the 2-3am slot is about half a percent below the average across the day (green line) for noninduced. Small compared to 1/24 = 4%.
Additional consideration 2) Group C) not planning to induce, but then end up inducing. This could be for a variety of reasons, including an impending holiday. It is from group C (not group B) that we would expect to see a dip in Dec. 25 noninduced births (due to late scheduled inducements in the days leading up). The size of group C relative to B+C is crucial to answer the original question.
Putting this all together, it seems the question of which day will have the fewest noninduced births is very much open. To be “pretty sure” that Stanley is incorrect seems premature. Thoughts?
Bjs:
As stated above, the main reason I think Stanley’s guess is wrong is that the factor of 23/24 of the hours is so much smaller than the factor of 1/2 that we see in the daily data. Most births are not induced, so I can’t see how you’d have a drop of 50% in total births on Christmas without seeing a large drop in non-induced births that day. Also we have the data from Valentine’s and Halloween. So, yeah, I’d be stunned to find out that there were fewer non-induced births on 9 May than on 25 Dec.
Thanks. I understand your points (or maybe I don’t), but the insight is still not landing for me.
In the spirit of fake data simulation, consider a completely uniform (for simplicity) sequence of number of births that would occur from Dec. 20 – 25:
100, 100, 100, 100, 100, 100
Then a sequence of births that are induced with women avoiding Christmas:
60, 60, 60, 60, 60, 0
Then a sequence of births that are noninduced:
50, 50, 50, 50, 50, 50
Finally, total actual births observed:
110, 110, 110, 110, 110, 50
No difficulty in producing data that has both a drop of 50% in total births on Christmas and no large drop in noninduced births that day. This example is based on 50% of births being noninduced. The Valentine/Halloween paper shows about 55% noninduced. Close enough for gov’t work.
Fascinatingly, the Val/Hal paper suggests that women could have control over when they “spontaneously” give birth. Is that true? A brief internet search seems to suggest the current consensus is still “no”. If it was “yes”, would the effect top out at around 5% as seen on Halloween (suspiciously close to 23/24, by the way) or could it be even bigger for Christmas?
Lastly, I didn’t realize until reading the Val/Hal paper that there was a dataset that apparently includes induced/non information. Can we (someone) not just look at the data and find the answer directly?
Bjs:
I haven’t looked at the raw data. The graphs in the Valentine’s/Halloween data show approx 1800 induced births per day and approx 9000 others, so roughly 16% induced. They were working with old data, so maybe the proportion is over 20% now. Still not 50%, though, I don’t think. Another way to think about all this is that there are interactions between the different sorts of births, because it’s common for a birth to be scheduled but then the mother gives birth naturally before the scheduled date (or, to put it another way, a delivery is scheduled for some day under the condition that the birth has not already happened). Yet another issue is that I’ve heard that hospitals are flexible in recording birthdays, and if your baby is born late at night or early in the morning, they will be willing to record the birth as happening on the other day.
But . . . my intuitions can be wrong. I’ll download some data and see what I can see. Beats working!
16% induced, yes. But we care about noninduced. 6200 divided by (6200+1800+2800) = 57% noninduced. Hmm… even as I type that, I realize I’ve been naturally grouping c-section with induced. Not at all clear that that is right. Spontaneous birth can lead to a c-section, but a c-section can also be planned. Any chance in heck that the data distinguishes between those two types of c-section? Sheesh, what a mess…
You mention a scheduled induction that could become a natural birth. It can also go the other way: plan to go natural, but end up scheduling an induction (or c-section) for a variety of reasons. And who knows just how often the late night shift is flexible in moving the birth date. And double-who-knows how those effects all shake out.
Just to be clear, if you’re looking at the data… my money is on Dec. 25 not Mar. 9 (or whatever daylight savings date is in any year you look at). But I wonder if it might be a bit closer than you think? Anyway, a more interesting problem with more going on with it than first appears, I think.
I went to the National Center for Health Statistics webpage but couldn’t find the births by date, so I sent an email to the author of the Halloween/Valentine’s paper to see if they had the data. I’ll let you know if I hear back!