Recently we’ve been talking a lot about election forecasting:
Election prediction markets: What happens next?
Why are we making probabilistic election forecasts? (and why don’t we put so much effort into them?)
What’s gonna happen between now and November 5?
Polling averages and political forecasts and what do you really think is gonna happen in November?
The election is coming: What forecasts should we trust?
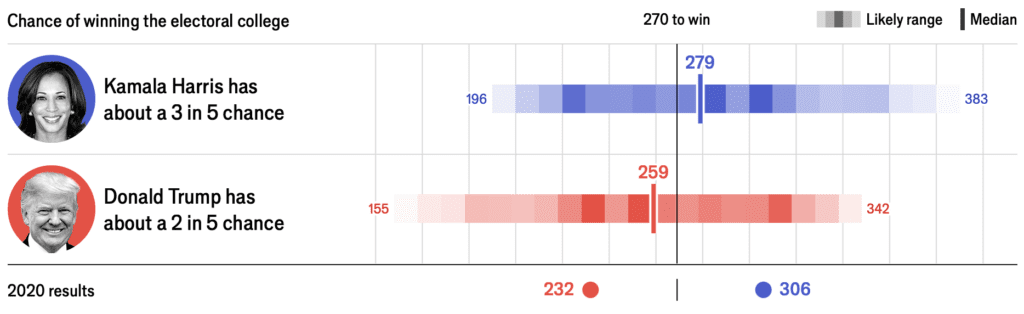
One thing that comes up in communicating election forecasts is that people confuse probability of winning with predicted vote share. Not always—when the win probability is 90%, nobody’s thinking a candidate will get 90% of the vote—but it’s an issue in settings like the current election, where both numbers are close to 50%. If Harris is predicted to have a 60% chance of winning the electoral college, this does not imply that she’s predicted to win 60% of the electoral vote or 60% of the popular vote.
There are different ways to think about this. You could draw an S curve showing Pr(win) as a function of expected vote share. Once your expected share of the two-party vote goes below 40% or above 60%, your probability of winning becomes essentially 0 or 1. Indeed, if you get 54% of the two-party vote, this will in practice guarantee you an electoral college victory; however, an expected 54% will not translate into 100% win probability, because there’s uncertainty about the election outcome: if that forecast is 54% with a standard deviation of 2%, then there’s a chance you could actually lose.
A few years ago we did some calculations based on the assumption that the national popular vote can be forecast to within a standard deviation of 1.5 percentage point with a normally-distributed uncertainty. So if Harris is currently predicted to get 52% of the two-party vote, let’s say the forecast is that there’s a two-thirds chance she’ll get between 50.5% and 53.5% of the vote and a 95% chance she’ll get between 49% and 55% of the vote. This isn’t quite right but you could change the numbers around and get the same general picture. This forecast gives her a 90% chance of winning the popular vote (in R, the calculation is 1 – pnorm(0.5, 0.52, 0.015) = 0.91) but something like a 60% chance of winning in the electoral college—it’s only 60% and not more because the configuration of the votes in the states is such that she’ll probably need slightly more than a majority of the national vote to gain a majority of the electoral votes. As a rough calculation, we can then say she needs something like 51.6% of the two-party vote to have a 50-50 chance of winning in the electoral college (in R, the calculation is qnorm(0.4, 0.52, 0.015) = 0.516).
Now what happens if the prediction shifts? Increase Harris’s expected vote share by 0.1% (from 52% to 52.1%) and her win probability goes up by 2.5 percentage points (in R, this is pnorm(0.516, 0.52, 0.015) – pnorm(0.516, 0.521, 0.015) = 0.025).
Increase (or decrease) Harris’s expected vote share by 0.4% and her win probability goes up (or down) by 10 percentage points. The other way you can change her win probability—bringing it toward 50%—is to increase the uncertainty in your forecast.
So one reason I don’t believe in reporting win probabilities to high precision is that these win probabilities in a close election are highly sensitive to small changes in the inputs. These small changes can be important—in a close election, a 0.4% vote swing could be decisive—but that’s kind of the point: it’s the very fact that it would be likely to be decisive which makes the win probability strongly dependent on it.
One thing I like about the Economist’s display (see image at the top of this post) is that they report the probability as “3 in 5.” This is good because it’s rounded—it’s 60%, not 58.3% or whatever. Also, I like that they say “3 in 5” rather than “60%,” because it seems less likely that this would be confused with a predicted vote share.
P.S. This is all relevant to Jessica’s recent post, partly because we coauthored a paper a few years ago (with Chris Wlezien and Elliott Morris) on information, incentives, and goals in election forecasts, and more specifically because binary predictions are hard to empirically evaluate (see here) so this is a real-world example of the common scientific problem of having to make a choice that can’t be evaluated on a purely empirical or statistical basis.
Slightly off topic but election prediction relevant: I keep reading things like “Democrats have overperformed every election since the Dobbs decision” (special elections, 2022, etc). Is this actually true and if so does it mean relative to polling or what? I find it hard to believe that *every single House race and state office race in 2022* saw the D overperform their polling, even if that’s true of 2022 midterms overall. (IIRC there were a few surprisingly good R results in NY and FL House races.)
I live in TX and while Abbott (R) won the governorship by a slightly smaller margin than last time (55% vs 44%, where it was 56-43 in 2018) that seemed like an unexpectedly small blue shift compared to expectations, given TX moved like 5-6 points less red between 2016 and 2020 presidentials.
Uh oh another case for the great martingale debate ;)
I have no idea how to do approach this, but colleagues are asking about interference as mentioned in this article, https://www.motherjones.com/politics/2024/09/how-republicans-could-block-a-democratic-victory-in-georgia-stacey-abrams/
None of these predictions matter if in the end the votes don’t get counted, or the election officials refuse to certify the elections. This election is much more likely to fall to the House and SCOTUS than ever before.
Why the focus on the future election (numerical) results when the real issue is what sort of insurrection will take place? The 2020 election appears to be a harbinger of things to come, yet I ween no psephologist anticipated the January 6th, 2021 uprising.
Sort of reminds me of the famous
——————————————————————————
Invisible gorilla experiment
The invisible gorilla experiment has become a psychology classic. Although it was conducted for the first time in 1999, it’s still cited as a typical example of the limitations of perception. It also illustrates how people don’t like to accept the fact that they’re often blind to the world around them.
——————————————————————————-
Because I am addicted to watching extreme right-wing sources, I am forced to admit that I may be far too pessimistic and am as blind to the world around me as the next person. Nevertheless, pebbles are pebbles.
I think this is not likely to make a difference. Kemp, Georgia’s governor, did not let this happen last time and won’t this time. Raffensperger is also still Sec of State.
It’s also not that likely that Georgia will decide the election, I don’t think.
It is not very unlikely for Georgia being the tipping point, either: at 9% it is about the 3rd most likely battleground state (PA or MI being most likely at 26% and 14%, resp.). And, should it come close in Georgia, it would matter hugely how much Kemp tilts the scale in favor of his own party – which he famously had done it in his own favor, if not in Trump’s.
For what its worth, the Economist model (https://www.economist.com/interactive/us-2024-election/prediction-model/president) shows Republican chance of winning dive from 40% to 18% without GA, and conversely for Democrats to rise from 40% to 57% with that state.
Sorry, my reply ended up at the bottom of the thread … but short version: Kemp/Raffensperger didn’t do that for incumbent President Trump in a truly chaotic time, they won’t for candidate Trump now.
This may be a dumb question… but here goes.
While the win probabilities bounce around a bit, I’ve noticed that the mode has remained 100% unchanged at 306 vs. 232 for many weeks (yes, I have a bit of a forecast-watching addiction).
Given that only one outcome will happen – why do we pay so little attention to the single most probable outcome, and instead focus exclusively on the median outcome?
Anon:
I think the answer to your question is that we mostly care about who will win in the electoral college, and to some extent how close it will be (given various attempts out there to make it more difficult for people to vote or to certify election results in some states), not in the total number of electoral votes won by a candidate.
I guess I’m still a bit confused.
I understand the goal is to figure out who will win the electoral college. And I assume that the distribution we see is the posterior for the prediction model.
I guess what I still don’t understand is why the most likely event (306-232) has so little importance, especially given how stable it is across weeks and weeks of simulations.
Suppose I had a 10-sided dice (die?) with 3 appearing 7 times, 1 appearing 2 times, and a 5. The most likely thing I would get on a single roll/election is a 3. That seems more important than my average score over 1000 rolls.
Anyway, sorry for what I guess is a very elementary question. The good news for you is that even statistical imbeciles read and enjoy your blog ;)
I just can’t see Kemp/Raffensperger throwing the election this time when they refused to do so *for an incumbent President Trump*. This time Trump doesn’t control the executive branch.
As for Georgia being the tipping point … I’d say 9% is “not very likely”, but I also find those probabilities kind of baffling. I’d have expected MI to be near zero since it’s likely bluer than any of the other swing states – Harris will probably win it, but I don’t think that means much.
Though since I posted that I’ve heard of the possibility of Nebraska changing to winner take all, which makes GA more likely to be relevant as if that happens MI/WI/PA without any of the southern swing states becomes a tie not a win.
I would be really surprised if the tipping point was something other than WI, PA, AZ or NV.
(Of course now that I have put that on record we will have a crazy polling error and the tipping point will end up being FL or VA or something crazy.)
Incidentally, there is an interview with Nate Silver in the Guardian this week:
https://www.theguardian.com/us-news/2024/sep/21/people-should-be-making-their-contingency-plans-like-right-away-americas-leading-forecaster-on-the-chances-of-a-trump-win
They talk about the Village and the River but not the Fort. Whassup with that??
They should’ve done a joint interview with Nate Silver (originator of Fivethirtyeight) and Elliott Morris (current director of Fivethirtyeight). That would’ve been interesting.
And also a review of David Spiegelhalter’s latest book The Art of Uncertainty:
https://www.theguardian.com/books/2024/sep/22/the-art-of-uncertainty-by-david-spiegelhalter-review-a-search-for-sense-in-probability-and-chance
Dumb question, but I don’t quite follow when you say
I take this to mean that the two-party popular vote share v for which Harris has a 60% chance of exceeding (assuming her expected 52+/-1.5% share) is 51.6%. But how does this become the break-even vote share for the electoral college win? Does it follow from what you’ve mentioned previously or some other assumptions about the distributions of electoral votes in states Harris is likely to win?
(I have to say it does get confusing when both the domain and target of distributions and quantiles are expressed in percentages!)
This definitely confused me at first too. The way I ended up interpreting it is as follows:
Think of the candidate’s hypothetical vote share as normally distributed with mean 0.52 and SD 0.015. For whatever reason, the estimated win probability associated with this vote share is 60%. If we assume that win probability is monotonically related to vote share, the then top 60% of this distribution reflects vote shares that produce a win, and the bottom 40% reflects vote shares that produce a loss. This means that the “indifference point” (for want of a better term) between winning and losing vote share probabilities is at the 40th percentile of this distribution. We can find the 40th percentile using qnorm(0.4, 0.52, 0.015), which gives approximately 51.6%. So, this is roughly the vote share required to produce a distribution where the upper half produces wins, and the lower half produces losses. This is the same as saying the in probability with this vote share is 50%.
(Whether this interpretation is correct and/or what Andrew was trying to convey is another question!)
@Max Shepsi
Thanks!
So there are two statements here that need to work together here that I can’t resolve.
First:
is what Andrew seems to claim in the OP, based on his experience. To parse this is in full, we are saying that
“Assuming Harris has a popular vote share distributed as N(0.52, 0.015), the probability of winning more than 50% of the electoral college vote is 60%”.
Second:
OK, so here you are saying that the top 60% of the popular vote share distribution — vote shares above some v_{60} such that the integral of the distribution from v_{60} to the upper limit (let’s say it’s 1, despite a Gaussian extending to +/- infinity) is 60% — corresponds to majorities in the electoral college. (The 40% and what follows from that I understand.)
This is the bit I have trouble understanding right now: how does monotonicity relate these two statements? I get that it implies that a lower vote share implies a lower chance of winning the electoral college, but why does “the top 60% of this distribution reflect vote shares that produce a win”?
As I see it, the Normal(0.52, 0.015) distribution reflects an estimate of the candidate’s vote share. In the model I think is being described in the OP, an actual vote share of 52% would always lead to a win; it’s only the uncertainty we have in the estimate that gives the associated win probability of 60%. Given that same level of uncertainty in the estimate, increasing or decreasing the estimated vote share will increase or decrease (respectively) the win probability; whereas increasing or decreasing the actual vote share would always produce a win above some point, and always produce a loss below it.
To put it slightly differently: Given the assumptions of the hypothetical scenario, a vote share of 51.6% or greater will always produce a win, and a vote share below that will always produce a loss. The 60% win probability we get when our estimate of the vote share is Normal(0.52, 0.015) occurs because 60% of the probability density there falls above 51.6%. If the distribution is centred on 51.6% though, half of the distribution will be above and half below it.
Does that make sense? Or am I looking past a flaw in the logic of it somewhere?
I’m probably being too stupid to get your point, but I think in your re-expression of your explanation the source of my confusion has shifted:
When written like this, the question now is “why does an actual popular vote share of 51.6% or greater always produce a win”, and the answer to that might be some external data or previous experience in forecasting. My problem has been relating that to N(0.52, 0.015) distribution, and the resolution might be that there is no logical connection without invoking some other data.
I.e. These two statements are prima facie independent of each other (which might be the obvious thing I’ve been missing, but from Andrew’s phrasing in the OP it sounded otherwise) unless more assumptions are stated:
– A 51.6% popular vote share or greater will result in an electoral college majority.
– Harris has a 60% chance of exceeding 51.6% popular vote share assuming N(0.52, 0.015).
More likely I’m just not explaining myself well! But basically, I’m just seeing it as a way to reconcile these statements:
– An expected vote share of Normal(0.52, 0.015) gives a 60% win probability (“because the configuration of the votes in the states is such that she’ll probably need slightly more than a majority of the national vote to gain a majority of the electoral votes”)
– An expected vote share of 51.6% gives a 50-50 chance of winning the electoral college.
– We can get to that 51.6% figure by using qnorm(0.4, 0.52, 0.015)
The only way I get there is via the process I mentioned. So, basically, I’m assuming a model that allows the two statements you detailed [“A 51.6% popular vote share or greater will result in an electoral college majority”; “Harris has a 60% chance of exceeding 51.6% popular vote share assuming N(0.52, 0.015)”] to follow from the statements in the OP: Given that the chance of an electoral college victory with expected vote share of 52% (SD 1.5%) is assumed to be 60%, this is a way to make it all fit together.
Thanks for trying, but I’m still none the wiser — I’ll have to ruminate on this for a while.
Let me ask in a different way. Suppose Harris’ expected vote share is still distributed as N(0.52, 0.015).
Now suppose that this corresponds only to a 25% probability of winning the electoral college (because e.g. the distribution of electoral college votes is really stacked against Democrats).
Running qnorm(0.75, 0.52, 0.015) gives 0.5301173.
So is 53% the new break-even vote share for the electoral college majority?
Yeah, that would follow from my interpretation.
> One thing I like about the Economist’s display (see image at the top of this post) is that they report the probability as “3 in 5.” This is good because it’s rounded—it’s 60%, not 58.3% or whatever. Also, I like that they say “3 in 5” rather than “60%,” because it seems less likely that this would be confused with a predicted vote share.
The Economist has changed the presentation, now it says:
Kamala Harris wins 54 in 100 times, ↓ 1 since yesterday ↑ 3 in past 7 days
Donald Trump wins 46 in 100 times, ↑ 1 since yesterday ↓ 2 in past 7 days
I like it better that showing “about 1 in 2” day after day – especially since the detailed chart with the evolution of probabilities was lost at least for unregistered readers.
Regarding the confusion between probabilities and vote shares: https://x.com/AlecStapp/status/1847014459354792069
> Donald Trump wins 46 in 100 times
Donald Trump wins 54 in 100 times
There has been a remarkable change over the weekend that would have been obscured if the reported probability had been “about 1 in 2” all along.
May have found a partial resolution to this — in Gelman et al. (2020), the authors write:
Comparing the two scenarios, we have that:
In 2020 (2024), when Biden (Harris) has an expected vote share of 54+/-2% (52+/-1.5%), getting a popular vote share of more than 51.7% (51.6%) occurs with 87% (60%) probability. But in Biden’s case, an 87% probability of getting more than 51.7% vote share corresponds to an 87% chance of winning the electoral college, while Harris’s 60% chance of getting more than 51.6% of the vote share corresponds to a 50% chance of winning the EC.
So the reasoning follows one or both of the following lines:
Both 51.7% in the paper and 51.6% in this post come from a separate analysis (updates to which cause the small difference in the two percentages) into how the distribution of voters and electoral college votes affects the Democratic candidates chances. This is fine, but doesn’t explain why Andrew derives the 51.6% value in this post by looking at the 40th percentile of Harris’ likely vote distribution.
The key line here is that “[a] vote share of 60% is a landslide win, but a win probability of 60% corresponds to an essentially tied election”. This explains how Harris’s breakeven vote share of 51.6% is arrived at (look for what gives her a win probability of 60%), but isn’t explicitly stated in this post (although one could argue that “once your expected share of the two-party vote goes below 40% or above 60%, your probability of winning becomes essentially 0 or 1” is the same as “a win probability of 60% = 50% chance of winning the E.C.”).
I think 2. makes the most sense here. Hopefully I’ve not got the wrong end of the stick here.
Gah! Tried to be too clever with HTML and the formatting broke. The last bit should be this:
So the reasoning follows one or both of the following lines:
1. Both 51.7% in the paper and 51.6% in this post come from a separate analysis (updates to which cause the small difference in the two percentages) into how the distribution of voters and electoral college votes affects the Democratic candidates chances. This is fine, but doesn’t explain why Andrew derives the 51.6% value in this post by looking at the 40th percentile of Harris’ likely vote distribution.
2. The key line here is that “[a] vote share of 60% is a landslide win, but a win probability of 60% corresponds to an essentially tied election”. This explains how Harris’s breakeven vote share of 51.6% is arrived at (look for what gives her a win probability of 60%), but isn’t explicitly stated in this post (although one could argue that “once your expected share of the two-party vote goes below 40% or above 60%, your probability of winning becomes essentially 0 or 1” is the same as “a win probability of 60% = 50% chance of winning the E.C.”).
I think 2. makes the most sense here. Hopefully I’ve not got the wrong end of the stick here.