Jacob Klerman writes:
I have noted your recent emphasis on the importance of measurement (e.g., “Here are some ways to make your study replicable…”). For reasons not relevant here, I was rereading Leamer (1983), Let’s Take the Con Out of Econometrics—now 40 years old. It’s a fun, if slightly dated, paper that you seem to be aware of.
Leamer also makes the measurement point (emphasis added):
When the sampling uncertainty S gets small compared to the misspecification uncertainty M ,it is time to look for other forms of evidence, experiments or nonexperiments. Suppose I am interested in measuring the width of a coin. and I provide rulers to a room of volunteers. After each volunteer has reported a measurement, I compute the mean and standard deviation, and I conclude that the coin has width 1.325 millimeters with a standard error of .013. Since this amount of uncertainty is not to my liking, I propose to find three other rooms full of volunteers, thereby multiplying the sample size by four, and dividing the standard error in half. That is a silly way to get a more accurate measurement, because I have already reached the point where the sampling uncertainty S is very small compared with the misspecification uncertainty M. If I want to increase the true accuracy of my estimate, it is time for me to consider using a micrometer. So to in the case of diet and heart disease. Medical researchers had more or less exhausted the vein of nonexperimental evidence, and it became time to switch to the more expensive but richer vein of experimental evidence.
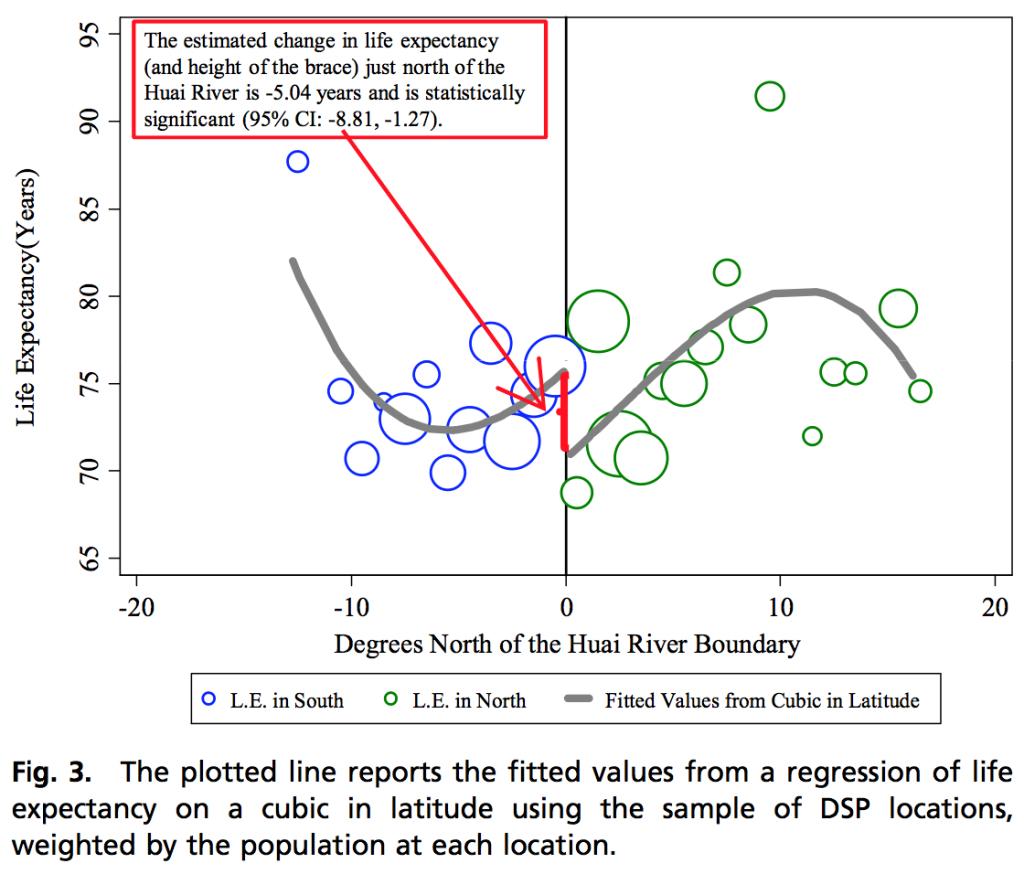
Interesting. Good to see examples where ideas we talk about today were already discussed in the classic literature. I indeed thing measurement is important and is under-discussed in statistics. Economists are very familiar with the importance of measurement, both in theory (textbooks routinely discuss the big challenges in defining, let alone measuring, key microeconomic quantities such as “the money supply”) and in practice (data gathering can often be a big deal, involving archival research, data quality checking, etc., even if unfortunately this is not always done), but then once the data are in, data quality and issues of bias and variance of measurement often seem to be forgotten. Consider, for example, this notorious paper where nobody at any stage in the research, writing, reviewing, revising, or editing process seemed to be concerned about that region with a purported life expectancy of 91 (see the above graph)—and that doesn’t even get into the bizarre fitted regression curve. But, hey, p less than 0.05. Publishing and promoting such a result based on the p-value represents some sort of apogee of trusting implausible theory over realistic measurement.
Also, if you want a good story about why it’s a mistake to think that your uncertainty should just go like 1/sqrt(n), check out this story which is also included in our forthcoming book, Active Statistics.
“If I want to increase the true accuracy of my estimate, it is time for me to consider using a micrometer.”
If I’d want to measure the width of a coin to micrometer accuracy, I’d be more concerned about construct validity than about the resolution of my instrument.
Well, I think Andrew is stating that he wishes to measure with a micrometer (pronounced my-chromiter, not measure to micrometer (pronounced micron) accuracy.
Compare https://en.wikipedia.org/wiki/Micrometer_(device) with https://en.wikipedia.org/wiki/Micrometre
English. Sigh.
Yeah, a micrometer measures with micrometre resolution. Thanks. (Sigh.)
Most micrometers in the US measure with about .001 to 0.0001 inch resolution… sigh… anyway 0.001 inch is exactly 25.4 micro-meters, while .0001 inch is 2.54 micro meters. So typically they don’t reach all the way down to micro-meter resolution.
When it comes to construct validity yeah, a coin has features on the surface (heads, tails) that probably vary in thickness at the 0.01 inch or 200 micron type level.
No-one is saying air pollution is good for you. This research doesn’t measure pollution, it measures distance from a river.
There are many places where we have more development than china, more health care, lower pollution, better diet, more elderly care, multiple factors that would suggest that life expectancy should be higher than this region in china. NONE of those regions have life *expectancy* of 91 years. Sure, some people live to 91 years, but even high life expectancy countries in Europe, like say Netherlands, France, Spain, etc don’t reach that level of expectancy. Of those listed, according to OurWorldInData Spain was the highest, peaking at 83.5 years right before the pandemic started.
91 is just so implausible that it shows that you’re not serious about your model if you plot that kind of stuff.
I can’t resist a comment on this since over the weekend I did some serious data collection that involved a cheap £8 micrometer to calibrate the settings on my pasta machine. Details here: https://www.econ.uiuc.edu/~roger/Bialetti/Bialetti.html. What was shocking to me was that this led to an approximately linear relationship between the settings and thickness that encouraged me to extrapolate slightly from setting 2 to setting 1. If only social science measurement and data analysis was so convincing.