Good post with the above title from economics journalist Noah Smith.
Just for you, I’ll share a few more from some of our old blog posts:
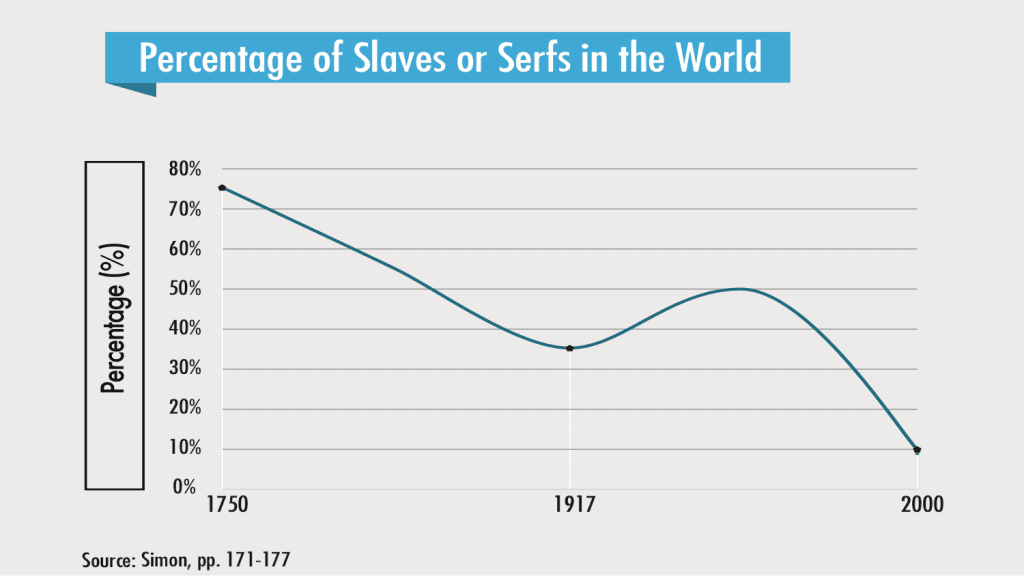
Suspiciously vague graph purporting to show “percentage of slaves or serfs in the world”:
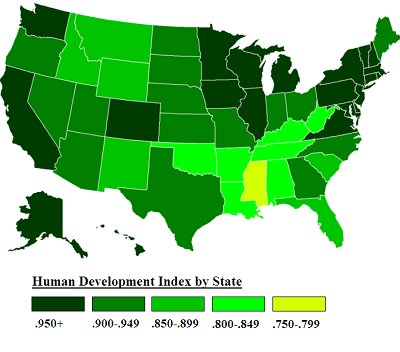
Debunking the so-called Human Development Index of U.S. states:

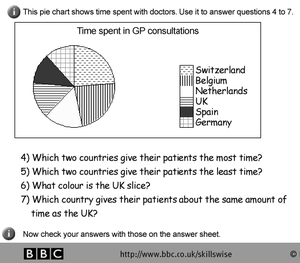
And, ok, this isn’t a “viral chart” at all, but it’s the absolute worst ever:

You can go through the blog archives to find other fun items.
Thanks for sharing the Noah Smith post: it is very good.
I think some of his advice can be consolidated by remembering to Edward Tufte’s argument that data visualization is about enabling comparisons. Questions like whether or not to convert to per-capita units can be broadly answered by considering what comparisons you are trying to enable and evaluating if some data transformation makes those comparisons easier or more robust.
Chandrasekhar,
Do you have a source for that Tufte quote? I’m always saying that graphs are comparisons. I didn’t realize that came from Tufte.
I would cite “To be truthful and revealing, data graphics must bear on the question at the heart of quantitative thinking: ‘Compared to what?'” (The Visual Display of Quantitative Information, page 74)
A ripe question: what constitutes plagiarism when using or paraphrasing that thought?
Tufte makes this argument in multiple places. Dale Lehman’s citation is good; it also appears in _Envisioning Information_, p. 67:
> At the heart of quantitative reasoning is a single question: Compared to what?
>
> Small multiple designs, multivariate and data bountiful, answer directly by visually enforcing comparisons of changes, of the differences among objects, of the scope of alternatives. For a wide range of problems in data presentation, small multiples are the best design solution.