Yesterday we pointed to a post by Gary Smith, “Don’t worship math: Numbers don’t equal insight,” subtitled, “The unwarranted assumption that investing in stocks is like rolling dice has led to some erroneous conclusions and extraordinarily conservative advice,” that included a wonderful story that makes the legendary economist Paul Samuelson look like a pompous fool. Here’s Smith:
Mathematical convenience has often trumped common sense in financial models. For example, it is often assumed — because the assumption is useful — that changes in stock prices can be modeled as independent draws from a probability distribution. Paul Samuelson offered this analogy:
Write down those 1,800 percentage changes in monthly stock prices on as many slips of paper. Put them in a big hat. Shake vigorously. Then draw at random a new couple of thousand tickets, each time replacing the last draw and shaking vigorously. That way we can generate new realistically representative possible histories of future equity markets.
I [Smith] did Samuelson’s experiment. I put 100 years of monthly returns for the S&P 500 in a computer “hat” and had the computer randomly select monthly returns (with replacement) until I had a possible 25-year history. I repeated the experiment one million times, giving one million “Samuelson simulations.”
I also looked at every possible starting month in the historical data and determined the very worst and very best actual 25-year investment periods. The worst period began in September 1929, at the start of the Great Crash. An investment over the next 25 years would have had an annual return of 5.1%. The best possible starting month was January 1975, after the 1973-1974 crash. The annual rate of return over the next 25 years was 17.3%.
In the one million Samuelson simulations, 9.6% of the simulations gave 25-year returns that were worse than any 25-year period in the historical data and 4.9% of the simulations gave 25-year returns that were better than any actual 25-year historical period. Overall, 14.5% of the Samuelson simulations gave 25-year returns that were too extreme. Over a 50-year horizon, 24.5% of the Samuelson simulations gave 50-year returns that were more extreme than anything that has ever been experienced.
You might say that Smith is being unfair, as Samuelson was only offering a simple mathematical model. But it was Samuelson, not Smith, who characterized his random drawing as “realistically representative possible histories of future equity markets.” Samuelson was the one claiming realism.
My take is that Samuelson wanted it both ways. He wanted to show off his math, but he also wanted relevance, hence his “realistically.”
The prestige of economics comes partly from its mathematical sophistication but mostly because it’s supposed to relate to the real world.
Smith’s example of Samuelson’s error reminded me of this story from David Levy and Sandra Peart of this graph from the legendary textbook. This is from 1961:
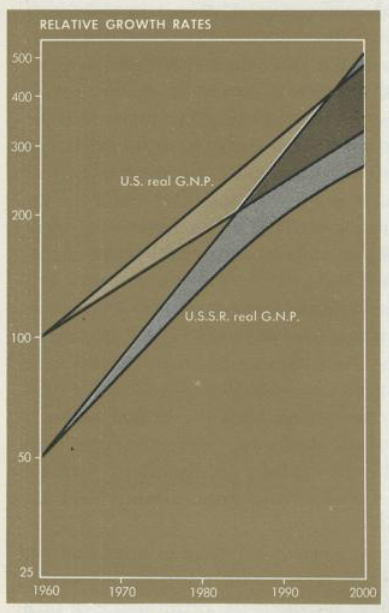
Alex Tabarrok pointed out that it’s even worse than it looks: “in subsequent editions Samuelson presented the same analysis again and again except the overtaking time was always pushed further into the future so by 1980 the dates were 2002 to 2012. In subsequent editions, Samuelson provided no acknowledgment of his past failure to predict and little commentary beyond remarks about ‘bad weather’ in the Soviet Union.”
The bit about the bad weather is funny. If you’ve had bad weather in the past, maybe the possibility of future bad weather should be incorporated into the forecast, no?
Is there a connection?
Can we connect Samuelson’s two errors?
Again, the error with the Soviet economy forecast is not that he was wrong in the frenzied post-Sputnik year of 1961; the problem is that he kept making this error in his textbook for decades to come. Here’s another bit, from Larry White:
As late as the 1989 edition [Samuelson] coauthor William Nordhaus wrote: ‘The Soviet economy is proof that, contrary to what many skeptics had earlier believed, a socialist command economy can function and even thrive.’
I see three similarities between the stock-market error and the command-economy error:
1. Love of simple mathematical models: the random walk in one case and straight trends in the other. The model’s so pretty, it’s too good to check.
2. Disregard of data. Smith did that experiment disproving Samuelson’s claim. Samuelson could’ve done that experiment himself! But he didn’t. That didn’t stop him from making a confident claim about it. As for the Soviet Union, by the time 1980 had come along Samuelson had 20 years of data refuting his original model, but that didn’t stop him from just shifting the damn curve. No sense that, hey, maybe the model has a problem!
3. Technocratic hubris. There’s this whole story about how Samuelson was so brilliant. I have no idea how brilliant he was—maybe standards were lower back then?—but math and reality don’t care how brilliant you are. I see a connection between Samuelson thinking that he could describe the stock market with a simple random walk model, and him thinking that the Soviets could just pull some levers and run a thriving economy. Put the experts in charge, what could go wrong, huh?
More stories
Smith writes:
As a student, Samuelson reportedly terrorized his professors with his withering criticisms.
Samuelson is of course the uncle of Larry Summers, another never-admit-a-mistake guy. There is a story about Summers saying something stupid to Samuelson a week before Arthur Okun’s funeral. Samuelson reportedly said to Summers, “In my eulogy for Okun, I’m going to say that I don’t remember him ever saying anything stupid. Well, now I won’t be able to say that about you.”
There was a famous feud between Samuelson and Harry Markowitz about whether investors should think about arithmetic or geometric means. In one Samuelson paper responding to Markowitz, every word (other than author names) was single syllable.
I once gave a paper at a festschrift honoring Tobin. Markowitz began his talk by graciously saying to Samuelson, who was sitting arm-crossed in the front row, “In the spirit of this joyous occasion, I would like to say to Paul that ‘Perhaps there is some merit in your argument.’” Samuelson immediately responded, “I wish I could say the same.”
Here’s the words-of-one-syllable paper, and here’s a post that Smith found:

Maybe Samuelson and his coauthors should’ve spent less time on dominance games and “boss moves” and more time actually looking out at the world that they were purportedly describing.
P.S. OK, I was wrong.
I have to say, Andrew, when I read this sort of post on a topic I know something about, it worries me a lot about how much credibility I should give towards posts on topics I know little about.
I’m frankly surprised at the credulity you give towards some random professor with a blog, and how ready you are to disregard the greatest economist of the 20th century (and give a shallow analysis of his hidden psyche from some anecdotes) while reading basically nothing about him other than a tossed-off conjecture and a sentence from a textbook. I mean, this:
“There’s this whole story about how Samuelson was so brilliant. I have no idea how brilliant he was—maybe standards were lower back then?—but math and reality don’t care how brilliant you are.”
is a severely arrogant set of sentences to write.
Drive:
What in particular in the above post did you disagree with? These were the main points:
1. Samuelson proposed a Monte Carlo process which he said “can generate new realistically representative possible histories of future equity markets.” Smith followed the process and got time series that did not appear to generate new realistically representative possible histories of future equity markets.
2. Samuelson in the various editions of his textbook repeatedly claimed that the Soviet Union would catch up to the U.S. economically and did not address the failure in later editions of the book.
3. Samuelson had a reputation for being brilliant.
I make no conjectures about Samuelson’s “hidden psyche.” I just think the conjunction of 1, 2, and 3 above is interesting. When stupid people make mistakes, that’s nothing special. When brilliant people make mistakes, that’s worth looking into.
I don’t think it unreasonable to suspect that Samuelson’s reputation for brilliance led him to overrate certain mathematical models (point 1 above) and to take the technocratic view that the Soviets could just pull some levers and run a thriving economy (point 2 above). But, yeah, this is just speculation on my part. The main point of this post is to juxtapose items 1, 2, and 3. Someone can have a reputation for brilliance and have blind spots at the same time. I kinda wish Samuelson had spent less time being brilliant and time checking his work, but it was his life to live and he made his choices.
I don’t think Smith’s post falsifies the claim that random samples can generate new realistically representative possible histories of future equity markets, though maybe I could be convinced with a more thorough bayesian analysis. “15% of the time we see 1 period simulated outcomes more extreme than we’ve seen in 4 periods of actual outcomes” just doesn’t seem that weird to me? Seems like you should see that about (.85^4) = 52% of the time, so actually more often than not! It’s a little lower than that because it’s *any* 1 unit period within the 4 periods of actual data, but my intuition is that it’s not that lower than that?
So if it provides any evidence against that the stock market is like random samples, it’s pretty weak. Of course, the stock market is *definitely* heteroscedastic, so it’s kind of a moot point, but Smith’s critique seems really weak and he’s really overstating it.
Heteroskedasticity of market returns has nothing to do with this. The empirical returns include the heteroskedasticity, so I don’t think there’s any evidence that Samuelson’s model isn’t right. And if there is, this sort of siulation doesn’t begin to get you there.
@Jonathan by heteroskedastic I mean with respect to time: if there is high volatility one month, there is more likely to be increased volatility the next month, so monthly returns are not independent events. Drawing random samples from all monthly returns obviously won’t model this.
Several of us have explained why we do not think that “15% of the time, a simulation of 100 years of US stock prices gives at least one year outside out experience in 100 years of actual US stock prices” is a “time series that did not appear to generate new realistically representative possible histories of future equity markets.” On the contrary, it seems like a conservative result for this toy model!
Sean:
I will have to think more about this. My quick reaction is that you and others are slightly misunderstanding. The issue is not that 15% of the simulations were more extreme than the actual data it’s that 15% of the simulations were more extreme than any 25-year period in the data. According to Samuelson, the simulations are supposed to represent what could possibly happen in the future. Given that the past did not look like a random walk, I don’t know why we should think that the future would look like a random walk.
But, as I said, I’ll have to think more about this, either to explain my reasoning more clearly or perhaps to understand why I’m wrong.
Andrew et al,
I think y’all are possibly missing that, under fat tails (to invoke our friend NNT), the realized sample moments and quantiles, hence bootstrap resampling results, will not necessarily be a great guide. Slow convergence and all that…
“it’s that 15% of the simulations were more extreme than any 25-year period in the data. ”
Yes but when Samuelson says the data are supposed to represent what could happen in the future, he implicitly means in the time frame of the past, 100-200 years at most. What Smith did in effect is project what could happen in 1M 25yr periods, e.g., ~1M months or ~83K years. Again I’m no statistician but an event in the far tail is much more likely in 83K years than in 100 years.
Not that I think Samuelson’s model is any good. It’s not! This would be a great exercise for students to think through what assumptions are implicit in Samuelson’s model. What’s the alternative history if Hitler was assassinated in 1934, the Nazis were crushed, WWII never happens and the world market becomes highly competitive over the period from 1935-1960, rather than being ruled by the US as the only industrial power still standing? IMO Sam’s model is riddled with assumptions that are fine for toy models but in reality no one has any idea if they will turn out to be true 25, 50, or 100yrs hence.
And I guess its safe to say that over 83K years the assumptions of Sam’s model are almost sure to break down anyway.
I have to question why you think Samuelson is the greatest economist of the 20th century. He was indubitably a genius at mathematically formalizing things and proving things within those formalisms. But he did essentially no empirical work. Where he did make strong empirical claims, they either weren’t notable, or were wrong.
Economics is supposed to be a science, and is supposed to study real phenomena. Why then, by your standards, can someone who generally didn’t study the actual economy be the greatest economist of the 20th century? Is it more important to you that an economist be smart than that they make true statements about the actual economy?
To give one empirical result, his theoretical work and his “empirical” practice are literally responsible for index funds (Bogle explicitly credits him!), universally seen today as the best investment vehicle for regular folks and totally inaccessible.
How many academics have a single idea whose combination of theory and practice have wholly changed a large industry for the better?
(And more broadly, I agree with the first respondent that these posts make me a bit worried about Andrew’s other posts. Among other things, the empirical returns we are comparing to are highly correlated whereas Paul’s model is not… We shouldn’t expect them to have the same distribution as Bayesians! For some reason, Andrew is very hostile to economics even though I would imagine he would love that Wald and Savage are our theoretical rabbis!)
As far as I know, Samuelson didn’t do any empirical work on that front. He did some theoretical work on the relationship between random walks and the EMH, and in “Challenge to Judgement” he notes that empirical work has been done (without citing it). But I don’t know any paper where he actually looks at real stock price data.
The same goes for, for instance, the Dornbusch-Fisher-Samuelson model of international trade. They make claims about trade, which is a real world phenomenon. And, assuming a general equilibrium model, they explore the space of possible welfare effects, narrowly defined, under knowledge transfer, asymmetric sizes, terms of trade, and so on and so forth. But at no point is any data invoked.
Samuelson was, of course, right to call out the high-fee mutual fund managers. But I still object to calling what amount to strong opinions, phrased mathematically, “empirical work.” Strong convictions can be right, and they can be horribly wrong.
Samuelson’s general equilibrium theory to me represents a persistent wrong turn for macroeconomics, which is where my animus comes from. On its face, it seems that what he proved is the nonexistence of general equilibrium. But also, it’s led to a family of macroeconomic modeling which is essentially immune to data (see Shalizi’s work on statistical learning theory and DSGE).
I was actually thinking about the “Samuelson simulations” and where its failures come from. It sounds like a bootstrap, and I wonder if there is some sort of block nature to the data, or otherwise some kind of mean-reverting process, that is not being captured by the draws. Then you could draw big peaks/dips but without the cooldowns/rebounds and end up with a lot of unreasonable iterations.
Will:
I have no idea! But, just to speak in general terms, it can be hard to simulate reality with a very simple process. Similarly, if you simulate from random graph models, you’ll get something that looks much different from actual social networks. The next step is to add structure to the models and keep playing with them until they simulate something that looks a bit like reality.
What I’m saying is, Samuelson’s idea of simulating in that way seems like a reasonable starting point. His mistake seems to have been to believe it would work, rather than doing the simulation and then using its flaws to suggest improvements to the model.
My initial reaction was somewhat like the drive-by-comment. I have my own complaints about Samuelson – his textbook contained many hidden political judgements about the ability of markets to solve all problems that decades of students were subjected to without realizing it. I had no personal interactions with Samuelson, but on a personal level many famous economists were snobs and, well, jerks (in my opinion, of course). But the criticisms that you and Gary Smith offer seem somewhat disingenuous to me. Samuelson loved the elegance of his mathematics, but that is consistent with 90% of the profession or more. In the particular case that Smith speaks of, myself and others that commented remain unconvinced that it is a good example. It is still unclear to me how the actual limited history we have of stock market changes invalidates the simplified assumptions that Samuelson had made. I think a different analysis is required to characterize Samuelson’s hypothetical experiment as fundamentally wrong – not the fact that his model provides tail risk estimates that are higher than were actually realized.
Similarly, the love of elegant models at odds with realistic behavior is not unique to Samuelson – it is what most economists are trained to do. I’m certainly not going to defend it, although it isn’t so obviously bad modeling. The themes of whether economics models are overly mathematical, too simplified, or whether famous economists exhibit poor interpersonal behavior are interesting – but I’m not sure that singling out Samuelson regarding any of these is a good example (except perhaps the last of these – some of those purported statements from Samuelson are rich examples of what you refer to as “boss moves” but I suspect this is not unique to famous economists – academics in general seem to exhibit this).
Dale:
Regarding that last point: I have no reason to think that economists on average or in the extremes behave worse than other academics. They get more publicity so we hear more of their stories, which makes people like me react to the hype.
“Samuelson loved the elegance of his mathematics, but that is consistent with 90% of the profession or more. ”
Doesn’t that mean 90% of the profession is arrogant and cargo-cultish?
“It is still unclear to me how the actual limited history we have of stock market changes invalidates the simplified assumptions that Samuelson had made.”
Assumptions have to be presumed wrong until supported, not presumed correct until disproven. Samuelson provided no support for his assumptions, that was the point.
Anyway, it’s probably true that Smith’s simple analysis is bad and you have to look at the entire distribution of returns, accounting for the finite time period. But again, the point is that Samuelson did no analysis at all.
“Similarly, the love of elegant models at odds with realistic behavior is not unique to Samuelson – it is what most economists are trained to do. I’m certainly not going to defend it, although it isn’t so obviously bad modeling.”
Models should agree with data, yes? How is this not obviously bad?
If you have to prove it to rely on it then it isn’t an assumption, it’s a fact. Assumptions are useful devices for deriving results when all of the necessary ingredients are not known to be true, they allow us to come to interesting conclusions while explicitly qualifying what we are relying on. Assumptions can be obvious or stupid, and the credibility we lend to the results those assumptions build will carry those limitations, but the mere unproven nature of an assumption does not damn an assumption, it defines it!
I agree with Chipmunk that its not at all surprising that 15% of the time, there is at least one 25-year return lower or higher than in 100 years of a simulated US stock market than in 100 years of the actual US stock market. If anything, that suggests that the model is a bit conservative. Remember hindsight bias and Taleb’s black swans! Remember the economies of Argentina and Japan in the 20th century.
It seems to me that many frauds and swindles play with expectations from experience in one of two ways:
– rug pulling. “Mr. Ponzi has always paid interest on my investment in his stamp scheme so I will reinvest; this business run by not-a-mafia-cutout says it has been doing well so I will advance them lots of goods for the Christmas season and they will definitely pay me in January.” The turkey was treated well by the farmer every day until Thanksgiving. This family of scams relies on the mark not considering that because outcomes have been good so far does not mean that they will always be good.
– “this time it will be different.” This family of scams relies on the mark not thinking about what usually happens in a situation.
I hope that Gary Smith is alert for rug pulling when he gives other investment advice, because assuming that stock returns must resemble past returns is a red flag (in fact, say it like that and it screams “isn’t is a principle that past performance does not guarantee future returns?”) Assuming that risk follows a statistical distribution as in the paper he criticizes opens you to one set of scams, assuming that outcomes can never be worse than in your brief experience opens you to another.
The issue is that it’s only 25 years of simulated history, which he is then comparing to the most extreme 25 year window in the actual 100 year data. That is, he’s running
CountIf(max_return(25 year windows in 100 year data) < return(25 year draw) over 1000000 draws)
The order/extreme value statistics here are complicated, so I won’t speak to that, but the more straightforward way to do this permutation test that admits an easier interpretation would be to simulate 100 years 1000000 times, and then compare the distribution of maximum returns in each time window to the maximum return in the real 100 years. That would almost surely boost the 25% number, but without doing it I don’t know by how much.
In any case, we can also get a lot more granular than annual returns. 100 isn’t a huge number to be using resampling methods comfortably.
To me, the point is it looks like Samuelson never did the simulation. He just described it and then asserted that it “can generate new realistically representative possible histories of future equity markets.” Which seems really overconfident to me. I don’t think this has anything to do with black swans or whatever. It’s the opposite: he had a mathematical model and just assumed it would work, without checking it. Or maybe he did the simulations and decided they looked reasonable, but I kinda doubt it, partly because, according to Smith, many of the simulations were pretty wild, and I’m assuming Samuelson would’ve noticed that if he’d actually done them.
I’m not sure how to evaluate Smith’s simulation. Do his numbers really prove anything about the adequacy of the model? I don’t know whether Samuelson did what such a simulation, but I don’t think this proves he didn’t do some sort of investigation of his model.
I disagree with this completely. The extremes in 1,000,000 simulations will be more extreme with probability close to 1 over some historical series *even if the model is exact.* Do the following experiment: generate 100 years of data from a given Markov random walk generator in percentage returns. That gives you 76 different 25 year periods. (I think,,, I’m often off by one when I do this counting thing.)
Now generate 1,000,000 25-year runs with the exact same distribution. Surely thousands of them will be more divergent than the the extremes of the 76 you observed. So in the case where Samuelson’s claim was definitionally correct, you’d still get results like Smith’s.
I have plenty of problems with Samuelson, but this isn’t one of them.
Note that the quote that makes Samuelson look like a pompous fool showing off his math is from an article in a magazine. (I included a link in another comment that it’s in the moderation queue.)
Could it be that he found that this simple resampling model was “realistically representative” enough to illustrate the point he wanted to make?
For what it’s worth, he had also written the following decades before: “If the sequence of prices is truly a Wiener or white-noise process, with logarithmic price changes independently and uniformly distributed through time, then economic price can truly wander anywhere in enough time. Just as west of the Pecos there is no law, in the Wiener long run we are not only all dead, but are dead in a universe not subject to any economic law, subject to no pull toward normal value or cost. Few economists can cheerfully believe in the random, lawless world.”
Jonathan wrote:
“Now generate 1,000,000 25-year runs with the exact same distribution. Surely thousands of them will be more divergent than the the extremes of the 76 you observed.”
Exactly my point from the previous thread on this topic. As we all know I’m no statistician but it seems almost certain that the distribution and tails that result from his simulations should be predictable from the spread of the original data and the number of simulations.
Well, to match Smith’s result it wouldn’t be enough to see thousands, you would have to see 250,000. But it’s indeed very difficult to interpret Smith’s simulations because of the bizarre construction. There’s certainly no analytic form. I’d like to do it with a more ordinary bootstrap analysis, but I’m too lazy. Off the top of my head
import numpy as np
import pandas as pd
df = pd.read_csv(“stonks.csv”)
pct_change = df[“pct_change”]
def geom_mean(x):
return np.exp(np.mean(np.log(x)))
def max_return(pct_change):
curr, max_return = None, None
for i in range(len(df)) – 25:
curr = geom_mean(pct_change[i:i+25])
if max_return is None or curr > max_return:
max_return = curr
return max_return
actual_max_return = max_return(pct_change)
sim = []
for i in range(1000000):
sim_data = pct_change.sample(100, replace=False)
sim.append(max_return(sim_data))
sim_np = np.array(sim)
fraction_more_extreme = np.sum(sim_np > actual_max_return).astype(int))
Just need the data, but I’m on my phone
Random walks: The application of an unstructured stochastic model to stock fluctuations, and the critique of that approach, has somehow obscured the obvious normative implication that a random walk is a useful benchmark against which to compare various real world decision processes. I wrote a paper a while back arguing that a regulator who issues a quantitative rule, like a threshold limit value, which is subsequently revised as new information materializes, should aim at exactly such a revision path. This entails incorporating informed expectations about the direction new information is likely to pull you into the decision process. It seemed so obvious I never tried to publish it, but maybe it’s worth a blog post some day.
Brilliance and error: Maybe it’s not any more complicated than the fact that brilliant people are usually right in their disagreements with others, so they come to discount criticism. That seems like a more likely process if brilliance takes a purely theoretical form, since it safeguards the theorist from being confronted by self-doubt in the face of disconfirmation. Samuelson was definitely like that. His work on trade theory was uncontaminated by any engagement with empiricism (factor price equalization — jeez), similarly with preference theory (no behavioral econ in that garden patch) and so on. I suppose, in the grand intellectual division of labor, we need some people to be pure theorists, but on an individual level it’s a massive risk.
Peter:
Both your paragraphs make sense to me. Theory is great, and it’s good to have well-understood theoretical baselines where this is possible. My problem with Samuelson was not his use of simple theoretical models but rather his assertions that these applied to reality (equity returns in one case, the Soviet economy in the other).
The details about the Soviet growth error are more interesting than the punchline account: https://marginalrevolution.com/marginalrevolution/2010/01/soviet-growth-american-textbooks.html (I don’t read that blog anymore, but it does have its uses). Samuelson was averse to worrying about empiricism, and he was not alone, and it was not a liberal/conservative issue. The presence of that graph in Sameulson’s introductory textbook (and in others that followed) interests me for a different reason. When I started teaching intro econ it was in the heyday of Samuelson’s text – at the time the best selling textbook in any subject (as I recall). What struck me the first time teaching from it was the apparent contradiction with the first economic principle: “there is no such thing as a free lunch” and the subsequent discussion of the production possibility curve (which describes the productive potential of an economy and the tradeoffs along the frontier – presumably the frontier is drawn to include ALL goods and services in the economy). The former is the basis for the truism that everything has an opportunity cost and the latter was used to show that points inside the frontier were inefficient, in which case a movement towards the frontier could involve more of everything. But more of everything seems to contradict the notion that everything has an opportunity cost. The movement towards the frontier was a free lunch.
I’d point out the discrepancy to students and comment on how it served political purposes: since neoclassical economics was very good at demonstrating how government policies are inefficient, presumably removing these inefficiencies would be costless – a move towards the frontier. I could think of no real examples of that – then or now. Fortunately, I stopped teaching introductory econ. But many thousands of students were taught from his intro book, and I hope they learned little of lasting value.
In any case, I do think that Samuelson example reveals something about his approach to economics. I think he held strong beliefs, used mathematics to lend supposed scientific rigor to those beliefs, and didn’t want to bother with empirical evidence since it could only stand in his way.
If I’m remembering correctly, the dispute is more sophisticated than that. I think the core idea is the Kelly-style logarithmic utility almost surely maximizes the growth rate in the asymptotic long term, so some were arguing that agents usually use logarithmic utility. Samuelson argued that it depended on individual preferences, even at a young age or for long lived firms, which is tautologically true. This resulted in the paper (from the top of my head)
Why we should not act to make mean log wealth big, though years to act are long
which was funny, but pretty empty of content, either theoretical or empirical
By the time Samuelson wrote about the markets there was substantial published, empirical evidence that.
1) The sign of stock price changes was close to independent from period to period–somewhat more likely to be positive than negative and less dependent for longer holding periods.
2) The distribution of stock returns is very heteroskedastic.
3) Part of the heteroskedasticity is caused by a strong serial dependence in the absolute magnitude of the return–large returns in any direction tend to be followed by large returns of uncertain sign, and small returns mutatis mutandis.
Given the amount of work that was done on this it was hardly necessary for him to do further empirical research.
How to present this in a basic text? Ignore 2 and 3 and make up a simple random return generating process.
As the other commenters have mentioned, the simulation doesn’t look that bad.
More interesting is the fact that Samuelson was a >>very<< successful investor (my information here comes at second hand from talking to people who knew Samuelson well). He immersed himself in the market, visiting market makers and dealers (there is a lovely story about this which is too long for this comment). He was far from the pure theorist you picture. When he turned his attention later to options he wrote from the point of view of an experienced investor.
One short story. A businessman once asked Samuelson, "If you're so smart why aren't you rich?" Samuelson answered, truthfully "I am rich. If you're so rich, why aren't you smart?"
https://www.maryellenmark.com/bibliography/magazines/article/bloomberg-financial-market-news/voices-cokes-high-dogma-of-the-day-watch-the-jockeys-637618779126291196/
Dogma of the Day
Invest for the long term, the theory goes, and the risk lessens
By PAUL A. SAMUELSON
Bloomberg Financial Market News
JANUARY/FEBRUARY 1997
“I cannot predict the future, but I do not find the current bull market puzzling. The dogma pervading the investing community suffices to explain the story: Be a long‑term investor. Buy and hold a diversified portfolio of common stocks. After all, 150 years of market statistics—1,800 months’ worth of data—show that those who boldly invest in common stocks for at least a 15‑year horizon always come out ahead of their timid brethren.”
[ This is what the next 15 years looked like: https://imgur.com/a/dDTpdB9 ]
“Don’t misunderstand. Professor Samuelson does not advise against 100 percent invested in equities; or 110 percent; or 80 percent; or 10 percent. I can demonstrate reasons why folks who do understand their own degree of risk tolerance will want to just buy and hold diversified common stocks. And I can demonstrate why more risk‑averse folks should eschew current fashions. My point is this: Don’t do what you do for the mistaken sure thing reasons given by the current dogma.”
While it is true that Samuelson wrote in his paper that all but the last word had one syllable (excluding quotes and names), that was false. I counted 4 two-syllable words.
Russ:
To link to an earlier thread, perhaps someone could feed that article to a chatbot and then ask it, “How many multi-syllable words does that passage have, excluding quotes and names?” From all I’ve seen, I guessing the chatbot would come up with the correct answer or something close, but I have no idea how the chatbot would do it!
To be honest, when I read ‘Samuelson did not do his empirical home work’ it makes me wonder whether that was even possible at that time. I’m a youngster, I haven’t known a time without computers. So correct me if I’m wrong. But the rise of Paul Samuelson started even before Turing built his Bombe decryption ‘computer,’ so I am inclined to think that simulation studies would have been a thing literally done by hand. Also, the quantity and quality of data available to Samuelson were probably a far cry from what I would consider adequate today. For myself I have therefore concluded I want to consider myself standing on the shoulders of giants, and I will not hold their methods to today’s standards because that would mean they would have had to be way ahead of their time to be average today. I apply this principle to scientific methods only, not to questions of character: Failure to be teachable has been and will always be unacceptable in science, no matter how brilliant or mediocre a scientist is. Whether that applies to Samuelson’s character, I don’t know, and I won’t loose sleep over not knowing the answer.
Raphael:
Fair enough. A bit much to ask that Samuelson would’ve done the simulation himself. It’s the “realistically representative possible histories” that stuck in my craw. But perhaps we could add an implicit “(conditional on this unrealistic model)” to the phrase; then it works out.
The quote is from 1997. I don’t know how young are you but computers were widely available by then. (And Samuelson was aware of them quite early. This is from a column in another magazine in 1966: “Try it on your IBM 7090”.)
> Maybe Paul Samuelson and his coauthors
What coauthors?
Nevermind, by coauthors you mean Nordhaus.
(By the way, the change from “[Samuelson] and coauthor William Nordhaus wrote” to “[Samuelson] coauthor William Nordhaus wrote” does change the meaning slighlty – not that it matters.)
To give some substance to this message there is an account of the rise and fall of Samuelson’s appreciations for the Soviet system here:
https://pubs.aeaweb.org/doi/pdfplus/10.1257/jep.11.2.137
By the next edition, the fourteenth, published during the demise of the Soviet Union, Samuelson and Nordhaus dropped the word “thrive” and placed question marks next to the Soviet statistics, adding “the Soviet data are questioned by many experts” (14:389). The fifteenth edition (1995) has no chart at all, declaring Soviet Communism “the failed model” (15:714–8). To their credit, Samuelson and Nordhaus (15:737) were willing to admit that they and other textbook writers failed to anticipate the collapse of communism: “In the 1980s and 1990s, country after country threw off the shackles of communism and stifling central planning—not because the textbooks convinced them to do so but because they used their own eyes and saw how the market-oriented countries of the West prospered while the command economies of the East collapsed.”
ah yes, Nordhaus. Also notably wrong about how to do climate economics! (see also Tol, Richard). ;)
For what it’s worth, I downloaded the last 100 years of monthly S&P 500 prices, calculated the monthly changes, then calculated the annualized returns over each possible 25 year period: I got a minimum of 0.02% and a maximum of 13.02%. Then I simulated 25 years of monthly returns using the actual distribution of monthly S&P returns (using a nonparametric distribution that very closely matches the actual values) – I ran 10,000 simulations (1 million is overkill in my opinion). I got a 2.6% chance of getting a return lower than the lowest observed and a 2.7% chance of getting a return higher than the highest observed 25 year return.
If someone else wants to try, I’ll be interested to see your results.
I do wonder about the data source. Smith says:
“The worst period began in September 1929, at the start of the Great Crash. An investment over the next 25 years would have had an annual return of 5.1%. The best possible starting month was January 1975, after the 1973-1974 crash. The annual rate of return over the next 25 years was 17.3%.”
There are a few options for how to calculate annualized returns, but the S&P 500 data I downloaded claims that the closing S&P 500 price on September 1, 1929 was 31.3 and 25 years later, September 1, 1954 was 31.45. As Smith says, this was the lowest return for any 25 year period in the past 100 years, but I don’t see how you can get a 5.1% annualized return from these prices. Our data sources must differ. I can also match the time period for the maximum 25 year return, although I get 13% rather than 17.3%. Perhaps Smith’s data includes dividends and mine does not? In any case, the more serious discrepancy lies in his simulations and mine. Simulating random draws from the monthly return distribution (with replacement) over a 25 year period does not produce the extreme results that Smith finds. In fact, in my simulation, the actual worst and best 25 year annualized returns approximate a 95% confidence interval from my simulation.
” the S&P 500 data I downloaded claims that the closing S&P 500 price on September 1, 1929 was 31.3 and 25 years later, September 1, 1954 was 31.45.”
Assuming starting with $100 at the beginning of 1929 and calculating the YoY balance change from annual percentage returns from the chart linked below, I get a closing value of $419.43 or 5.09% annually through the end of 1953. It’s not the exact same period or data but it agrees pretty well with Smith. The chart clearly states “total returns”, which should include dividends.
https://www.slickcharts.com/sp500/returns
I think you’re right the difference looks like missing dividends. This link gives the annual dividends since 1920s, they look in the 5% ballpark
https://www.slickcharts.com/sp500/returns/details
I also wonder whether it would make a difference to look at inflation-adjusted returns. In Smith’s simulations, he effectively mixes together months from high-inflation environments and months from low-inflation environments. That’s already unrealistic, since in the real world inflation tends to persist a while.
And anyway, for whatever it’s worth, just looking at a market index like the S&P 500 isn’t a perfect gauge of a purely passive investment strategy. A lot of stocks have gotten added to the S&P 500 or removed from it over the years. If you’d just bought stocks included in the index back in 1929 and then done nothing, you’d have lost a lot of money investing in companies that went bankrupt. E.g. your GM stock would have wound up worthless, and if you were purely passive you wouldn’t have bought any of the new GM stock after the company was reorganized.
In 1933 Alfred Cowles asked, “Can stock market forecasters forecast?”.
He compared forecasted and actual returns and found the answer to be “No”. [Econometrica 1, 309–324].
While Samuelson would later suggest simulation, Cowles actually did it:
“In an early—and labor-intensive—Monte Carlo experiment, Cowles (1933) simulates random recommendations by randomly drawing numbered cards to reach this conclusion”.
[p. 336, in Rapach, David, and Guofu Zhou, 2013, Forecasting stock returns, in Handbook of economic forecasting, volume 2, 328–383 (Elsevier)].
if an out-of-context quote by Paul Samuelson by a random AI blogger makes PS look like a “pompous fool”, the safe bet is that the error lies with the random AI blogger and not PS :)
PS is not infallable (nor was he clairvoyant, as the USSR example shows) but he was one smart cookie, even at the age of 82 when the article in question was written
it turns out that random AI blog’s selective copy-pasting misses some important context
for those curious, here’s the context:
Samuelson was arguing (in an article in the inaugural issue of Bloomberg’s Personal Finances magazine) against the investing advice common-wisdom to invest in the stock market for long time horizons in order to guarantee safe returns. as the investment horizons gets longer, a “buy-and-hold” strategy will give a higher expected cumulative return, but it will also have a higher rate of extreme outcomes; in particular, of negative outliers where your portfolio gets nearly completely wiped out. due to compounding, this means that risk actually increases with horizon length.
Samuelson famously proved an analytical mathematical antecedent of this argument in his 1969 paper “Lifetime Portfolio Selection By Dynamic Stochastic Programming” in the Review of Economics and Statistics (https://www.jstor.org/stable/1926559)
the simulation exercise that Samuelson is suggesting is therefore to simulate returns at different horizons and show that the variance of cumulative returns across runs increases with the time horizon. here is a paper where the authors do exactly this and confirm Samuelson’s result (see figure 3):
https://retirementincomejournal.com/wp-content/uploads/2020/03/Wishful-Thinking-abt-Risk-of-Stocks-in-the-Long-Run-Mar-20.pdf
the exercise that Gary Smith performs is unrelated to what Samuelson is suggesting. the Samuelson simulations are “realistically representative possible histories of future equity markets” in the sense that they possess this property. many other features of the distribution such as auto-correlations of returns are of course missing when you sample independently at random
even if you agree to Gary Smith’s interpretation of Samuelson’s series as being about the level of risk, and not the relationship between horizon and risk, i have a quibble with his methodology. comparing the distribution of different consecutive 25-year periods of stock returns to different independently drawn simulated series doesn’t work, because the consecutive periods are extremely highly correlated by construction: the series 1970-1995 is almost identical to the series 1971-1996, and so on. it’s no surprise that you get more extreme outcomes when sampling from a distribution that is independent than when sampling from one that is extremely highly correlated. a simulation could be devised that makes an apples-to-apples comparison by simulating a full 100 year series and comparing the distributions of all consecutive 25 year periods
i agree with others above that Andrew is laughably biased on the topic of economics and finance. that’s ok; just like Paul Samuelson, everyone has their blind spots. this blog remains one of the best platforms for all variety of econ cranks to get uncritical exposure. alas, reading the source for full context is probably too much to ask: i don’t know how brilliant Andrew is, but maybe standards are lower today than in Samuelson’s day ;-)
Sam:
Thanks for commenting. I appreciate people putting in the time to explain these things. I sent a message to Gary Smith asking if he can respond to some of these comments. I still think that Samuelson was a bit glib to take a mathematical model in which he’d proved a theorem, and leap to a claim about “realistically representative possible histories.” But, yeah, stock prices are not my area of expertise; I’ll be interested to see Smith’s followup.
Regarding the USSR example: my criticism of Samuelson is not that he was not clairvoyant.
Like many people in the Sputnik era, he overestimated the capacities of the Soviet economy. Planning worked well for the Allies in the Second World War, and the unplanned economies of the 1920s led to the Great Depression, so there were lots of good reasons to think that central planning could be an important component of a successful economy, and once you start with that reasonable position, it’s not such a bit step to suppose that a fully-planned economy such as the Soviet Union’s could outperform the largely unregulated capitalism of the United States. After all, the U.S. was producing lots of frivolous things such as Cadillacs with tail fins, while the Soviets were busy building factories to produce machine tools or whatever. It turns out that the Soviet system was pretty corrupt, also I guess it didn’t help that they were kind of isolated from world trade . . . whatever, there were lots of things going on, I’ll let the experts in international economics talk about this one.
The point is, sure, Samuelson’s initial forecast from 1960 is kind of funny and it turned out to be way wrong, but it wasn’t a priori unreasonable, and I wouldn’t call him a bad economist for supposing it. My problem is that, in later edition after later edition, he didn’t wrestle with the error. He just pushed the forecast back. That seems like too much devotion on his part to a mathematical formula.
thanks, Andrew.
the USSR example is curious. as Alex Tabarrok notes in his blog post, even the contemporaneous textbooks by economists far to Samuelson’s left like Robert Heilbroner (who were ideologically far kinder to Marx than Samuelson) did not make the same mistake.
weirder still: it was NOT Samuelson’s slavish devotion to an economic theory predicting that soviet growth would continue that led him astray. in the neoclassical models that filled Samuelson’s textbook, it’s the market that ensures that an economy remains at maximum efficiency. the exercise is instead a simple linear extrapolation of GDP trends. in general Samuelson is the ur-theorist who reasons a priori from first principles in narrow models; but in this case he was the perfect caricature of a naive empiricist.
my preferred explanation is that it’s a combination of initial conditions and inertia. the first couple editions of Samuelson’s textbook were written in during a period when Soviet GDP growth truly *was* remarkable. subsequent editions merely lazily inserted new numbers into the extrapolation. by contrast, Heilbroner’s textbook’s first edition came out in 1968, right when soviet growth was fizzling out.
the strength of the soviet economy in the mid-20th century wasn’t just a miscalculation borne of soviet obfuscation and guesswork subject to revisionism, either. when the eminent economic historian Bob Allen dug into the archives and constructed his own soviet consumption measures, he concluded that Soviet economic growth from 1930-70 was the greatest economic development success of the 20th century–and this in a book published in 2003!
> my preferred explanation is that it’s a combination of initial conditions and inertia. the first couple editions of Samuelåson’s textbook were written in during a period when Soviet GDP growth truly *was* remarkable.
According to https://pubs.aeaweb.org/doi/pdfplus/10.1257/jep.11.2.137 Soviet growth became a theme in the fifth edition:
In very early editions, Samuelson expressed skepticism of socialist central plan-
ning: “[O]ur mixed free-enterprise system … with all its faults, has given the world
a century of progress such as an actual socialized order might find it impossible to
equal” (1:604; 4:782). But with the fifth edition (1961), although expressing some
skepticism of Soviet statistics, he stated that economists “seem to agree that her
recent growth rates have been considerably greater than ours as a percentage per
year,” though less than West Germany, Japan, Italy and France (5:829). The fifth
through the eleventh editions showed a graph indicating the gap between the
United States and the USSR narrowing and possibly even disappearing (for exam-
ple, 5:830). The twelfth edition replaced the graph with a table declaring that be-
tween 1928 and 1983, the Soviet Union had grown at a remarkable 4.9 percent
annual growth rate, higher than did the United States, the United Kingdom, or
even Germany and Japan (12:776).
Put differently, the problem in Samuelson’s textbook was serial correlation in the errors.
I’ll add that Samuelson’s idea is important in understanding how insurance companies work too. The easy, sloppy way to think about an insurance company is that when it insures 100 people with independent risks of cancerm it doesn’t bear much risk because it makes money on some people even though it loses money on others, and the more people insured the more things get cancelled out. That is wrong, because it also might happen by chance that all 100 people coincidentally get cancer simultaneously– the insurance company is in fact bearing much higher risk in a sense because it could lose 100 times as much as any individual insured person. Rather, insurance companies work not because they *add* independent gambles, but because they *divide* them. Even if the company insures only one person, risk falls because the insurnace company has 1,000 owners of its stock, so they each bear one thousandth of the risk.
To go a bit further, bundling together 100 risks does not reduce risk in the sense of Rothschild-Stiglitz or Arrow-Pratt, nor does it increase it. Depending on his utility function a risk averse person might prefer the bundled risk, or reject it. That, too, is why higher variance is not the same as higher risk in the economic sense. (tho it is for people with quadratic utility)
I’ve been told this several time by economics professors and it has never once made sense to me. Maybe you can explain it?
Consider a bet with a probability of winning of 0.6. If I place $10 on 10 instances of this bet, there is about a 0.166 probability that I’ll lose money. If I place $100 on 100 instances, there is a 0.0167 probability that I lose money. For 1000, the online binomial probability calculator I’m using rounds down to 0. So in what sense is this higher risk?
I’m guessing the real issue is non-independence of the bets. Flood insurance really insures 10M people but only 3-4 independent regions for example. Health insurance has to pay out for thousands of illnesses when a chemical train derails or a structure collapses or a pandemic hits. Etc. Still a lot of bets are like independent events. Gallbladder surgeries or whatnot.
So to me there must be more both effects at play. Also the idea that millions of individuals own insurance companies rather than a few tens of institutional investors needs to be considered.
Andrew wrote “There’s this whole story about how Samuelson was so brilliant. I have no idea how brilliant he was—maybe standards were lower back then?—but math and reality don’t care how brilliant you are. ”
Certainly, Samuelson considered himself brilliant. However, he also had perspective. Describing his work at the MIT Rad Lab during WW II, he stated, “I worked as a mathematician on automatic fire control.
And it was the first time in my life I wasn’t one of the two smartest guys in the room.”
There were many smart people at the Rad Lab.
See https://infinite.mit.edu/video/paul-samuelson
Bob76
I am not an economist but I do feel that some of this discussion is a bit glib. For example, hell yes we do expect that over many simulations you will get some extreme values. The fact that in reality (n=1) you don’t get those cases doesn’t really mean anything. Further, as others have pointed out, both at the individual stock level and at the overall S&P level the prices over time are not independent of each other. And the S&P itself is not representative of all stocks.
I don’t really care about Samuelson one way or another but if I were writing for undergraduates I think that I would want to give them the message that there is a strong random element at the individual stock level that is separate from the overall trend of the S&P or other indexes. When he says “1,800 percentage changes in monthly stock prices” I don’t know if he means individual stocks or the S&P or the Dow Jones or something else when he says “monthly stock prices.”
Picking individual stocks *is* like gambling (so is picking an index, but that’s different). People act as though “like gambling” means that is is completely random. Tell that to a poker player or a backgammon player or people who play bridge for money. Of course there is skill and experience. The point is that an undergraduate has neither. Just like in any kind of gambling you can potentially win big or potentially go completely bust. Just like in gambling there is lots of wishful thinking not to mention cheating (see GameStop). If you don’t “know when to hold, know when to fold” not picking individual stocks is the safe way to go.
Many deep comments above; here is a shallow one (by a very-much-not-economist): it seems like the “coverage” statistics quoted by Andrew above are actually pretty good for the model Samuelson’s random walk model. The reason (implicitly in Joey Kellison-Linn’s comment above, but maybe not realized explicitly?) is that considering “all 25-year horizons” out of 100 years of actual S&P data is not (even under the *model* assumptions of independent monthly returns) 75*12 = 900 independent realizations of data! This is because shifting the time series by one month (i.e. Jan 1900 – Dec 1924 => Feb 1900 – Jan 1925, etc) reuses (the vast majority) of the data, so the return from this second 25-year period is strongly correlated with the return from the first! 100 years of data contain more than 4 independent realizations, at least if you admit the modeling assumption that the monthly returns are un-correlated, but only a constant factor more—the integral under the correlation function gives an autocorrelation length that is 12.5 years if I did my math right, so there are ~8 “independent realizations” of the timeseries in the 100-year period. It’s not that surprising to see that, compared to these 8 realizations of 25-year real returns, something like 1/8 (= 12.5%) of the synthetic timeseries give larger and smaller returns! (Tbh, I’d say it’s impressive that such a simple model can match the real situation so well!)
As for the rest of it, yeah it’s always good to double-check that your “date when the USSR will eclipse the US” is not receding into the future at more than one year per year…. So, fair enough.
Many of these questions might be answered by reading my op-ed. Here are some additional clarifying thoughts.
Samuelson and many others are fond of the assumption that stock returns are independent random draws from a normal or lognormal distribution—because it is mathematically convenient. I have done so myself. Samuelson’s slips-of-paper model is intended to be an easier explanation. I am well aware of George E. P. Box’s aphorism, “All models are wrong, but some are useful,” but the independent-random-draw model is problematic in many ways. One is that it implies a substantial chance of unrealistically extreme returns. Others are discussed in my forthcoming book, Investing 6.0.
This is not a black-swan issue, where an extreme return occurs that an assumed probability distribution implies is extraordinarily unlikely. It is, in fact, the reverse issue: The assumed probability distribution implies that there are likely to be a large number of returns that are more extreme than have ever occurred. As I reported in my original op-ed, Samuelson’s random-draw model fares worse the longer the horizon: 14.5% of the 25-year Samuelson simulations are more extreme than any 25-year period in the historical data; 24.5% of the 50-year Samuelson simulations are more extreme than any 50-year period in the historical data.
The real-world problematic nature of the IID assumption is illustrated by the 2009 recommendation of Zvi Bodie (“My mentor at M.I.T. was Paul Samuelson”), again reported in my op-ed, that investors should sell all their stocks because “there’s nothing to say” that the previous year’s 37% drop in stock prices couldn’t be followed by another 37% drop.
The fundamental problem with the IID assumption is, as I wrote in my op-ed: “In the real world, long-run movements in stock prices are tied (admittedly loosely) to fundamentals. They cannot randomly walk to permanently excessive lows or highs. You can lose all your money betting on dice rolls because these are independent events. The S&P 500 will not go to zero. Stock prices will eventually stabilize and rebound because stocks will become temptingly cheap if earnings and dividends rise and stock prices don’t. For similar reasons, stock market bubbles do not last forever. Unlike dice rolls, stock prices are anchored by fundamentals.”
With specific respect to Bodie’s recommendation, I wrote that, “A 37% price drop might be drawn over and over in a Samuelson simulation but won’t happen in the real world. At some point, stock prices will be so low relative to corporate earnings and dividends that investors will find stocks irresistible and stock prices will stop free falling.”
The fact that stock prices are tied to fundamentals is one reason why it has long been known that there is mean-reversion in stock returns (for example, Poterba and Summers, 1988; Fama and French, 1988), nearly a decade before Samuelson’s 1997 slips-of-paper model and two decades before Bodie’s dire IID worry.
If you want to do your own simulations, I used historical CRSP total return data which include dividends and capital gains.
If you want to read more, there are books, papers, and op-eds here: garysmithn.com
It’s extremely obvious when put this way but somehow it’s hard for people to wrap their head around it.