Calling it a “fun little example” might sound disrespectful, but it’s not. Examples are not hard to come by, but “fun” and “little” are special. Just as it’s said that it can take a lot of work to write something concise, it can take a lot of understanding to demonstrate an important nontrivial point with an example that is fun and little.
As regular readers know, we’ve been pushing simulation-based experimentation (formerly called fake-data simulation) for a long time. I think simulation-based experimentation is usually the best way, by far, of understanding statistical procedures.
One thing I haven’t though about so much is how the same idea can work in math—even for problems that have no inherent probabilistic structure.
The general idea goes as follows. Suppose you have a mathematical conjecture. It might be true or it might be false, you don’t know, that’s why it’s a conjecture, not a theorem. You can try to prove it for some special cases and you can also look for counterexamples in various places. This discussion of cases and places suggests a meta-model in which there is some space of possible values. Consider a space Theta and a conjecture C(theta). The conjecture is a true theorem if C(theta) is true for all theta in Theta.
At this point you can do simulated-data experimentation by sampling theta from some distribution and evaluating C at each sampled value. If C is true for enough values, you can think about making probabilistic statements about your theorem, but even if this is not the case you can learn from the pattern of truth.
I was moved to think about all this after reading this great post by John Cook demonstrating the use of this idea. Cook’s post is great for two reasons:
1. His example is just on the border of triviality. As noted at the top of this post, “near-trivial” could sound bad, but I’m intending it to be a compliment. Trivial examples are fine too, but this one has enough complexity to be non-trivial while being simple enough that once you see the pattern, it’s kinda clear. It’s similar to our golf example (see section 10 here). Here’s a relevant discussion: Why we kept the trig in golf: Mathematical simplicity is not always the same as conceptual simplicity.
2. He doesn’t just demonstrate simulation-based experimentation, he also goes through its workflow. I illustrate through some excerpts from Cook’s post:
I [Cook] wrote some Python code to test this, and to my great surprise, the identity often holds. In my first experiment, it held something like 84% of the time for random inputs. I expected it would either rarely hold, or hold say half the time (e.g. in a half-plane).
My first thought was to plot 1,000 random points, green dots where the identity holds and red stars where it does not. This produced the following image.
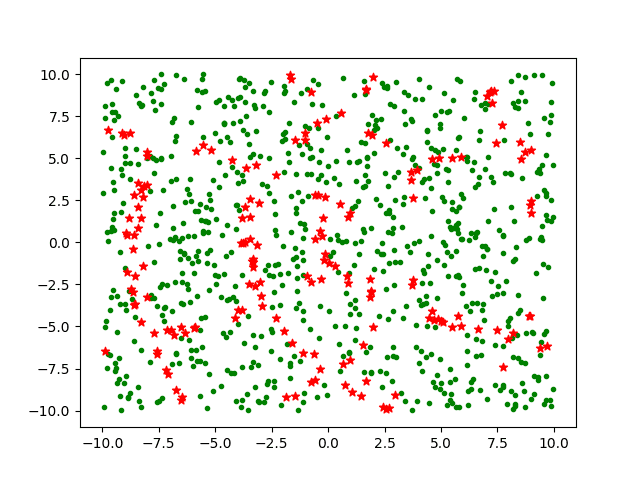
I like how he presents results in the context of his expectations.
Cook continues:
Since I’m sampling uniformly throughout the square, there’s no reason to plot both where the identity holds and where it doesn’t. So for my next plot I just plotted where the identity fails.

The dots on those graphs are too large, but, hey, nobody’s perfect! For some reason lots of people like to make graphs with dots that are too large.
More from Cook:
That’s a little clearer. To make it clearer, I rerun the plot with 10,000 samples. (That’s the total number of random samples tested, about 16% of which are plotted.)
Then to improve the resolution even more, I increased the number of samples to 1,000,000.
It might not be too hard to work out analytically the regions where the identity holds and doesn’t hold. The blue regions above look sorta like parabolas, which makes sense because square roots are involved. And these parabola-like curves has ziggurat-like embellishments, which makes sense because floors are involved.


I like that—the connection between the graph and the theoretical model.
And there’s still more, including a final graph but I’ll let you read the whole thing for that. My point here is we learn not just from the example but also from the workflow, the steps that got us there.
P.S. I scheduled this post for this day because the example is a fun present all wrapped up, also because it seems that Cook is Christian so he might appreciate this gesture. Blogs are so cool. It’s Christmas every day, with strangers offering us amazing and unexpected gifts from all over the world. The internet is more than just people screaming at each other, it’s also people going to the trouble of preparing these delicious treats and sharing them with anyone who cares to stop by.
In programming, I’ve seen a similar idea called property-based testing. The idea is you define a function, properties that should hold for that function and the space of values that function accepts as inputs.
As an example, your function could be to square a number, the property is the output is non-negative and the space of inputs is the reals.
Then the framework will generate inputs from the defined space and check whether the properties hold. The cool thing is that it:
1. Tries to generate inputs that are more likely to fail. Try infinity, large numbers, negative numbers, very small numbers.
2. Once it finds an input that fails the property, it will try to simplify the example as much as possible. If -124862699478109374 failed, does -1 fail?
3. It works for not just numbers but also data structures (generate random lists).
I’ve used the following python library to test a complicated convex optimization problem. It was helpful both for finding problematic inputs I hadn’t considered but also for pointing out properties that in fact didn’t hold.
https://hypothesis.readthedocs.io/en/latest/
I started to use pointillism ( https://en.wikipedia.org/wiki/Pointillism ) as a literal expression of the results – you only learn about points in the parameter space but as many as you have patience or computational capacity for. To get generality ( aka continuity ) you need to move from an iconic diagrams to a symbolic diagrams.
p.s. Nice present, thanks.
Why test random points instead testing over a grid?
Will:
A grid’s fine but then you’d still want randomness; for example you could divide the space into a grid of squares and then sample one point at random within each square. This is an example of stratified sampling.
Randomness almost gets you continuity (well an infinite sample almost would).
Any grid could miss a pattern.
I think in practice one difficulty is that, compared with a random draw from a 2-dimensional compact space, it is harder to simulate a random draw from the space of “all probability distributions”, “all models” or “all generating processes”.