This post is by Phil Price, not Andrew.
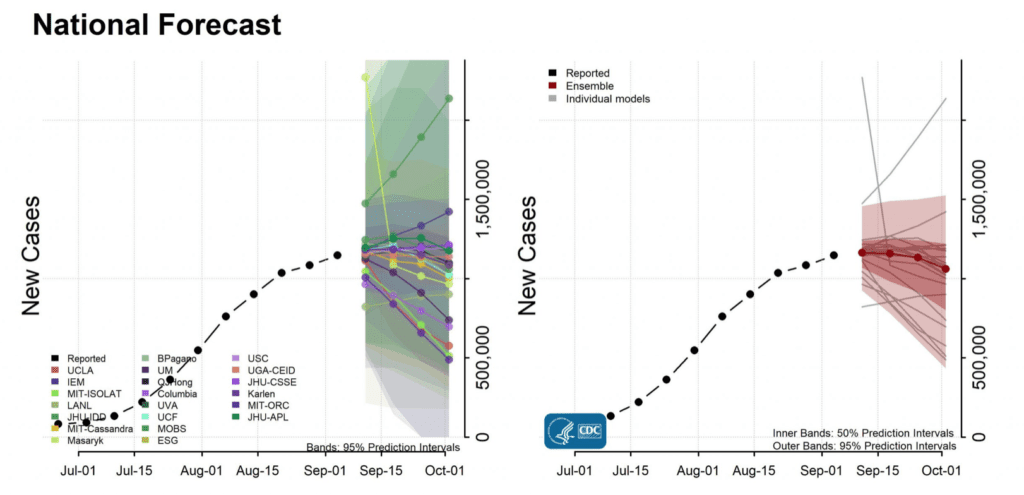
Andrew wrote a post back on September 2 that plugged a piece by Jon Zelner, Nina Masters, Ramya Naraharisetti, Sanyu Mojola, and Merlin Chowkwanyun about complexities of pandemic modeling. In the comments, someone who calls himself Anoneuoid said (referring to model projections compiled and summarized by the CDC, shown below; the link is to the most recent projections, not the ones we were talking about) “…it is a near certainty cases will be below 500k per week on Oct 1st, yet that looks like it will be below the lower bound of the ensemble 95% interval. If anyone disagrees, lets bet!”
I love this kind of thing. Indeed, if a friend says something is “a lock” or “almost certain” or whatever, I will often propose a bet: “if you’re so sure, you should be willing to offer 10:1 odds, so let’s do it! I’ll wager $100 to your $1000. Deal?” Most of the time, people back off on their “almost certain” claim. It seems that usually when people say they’re “sure” or “almost certain” about something they aren’t speaking literally, but instead feel that the outcome has a probability of, say, 75% or 85% or something. In any case I appreciate someone who is willing to put his money where his mouth is.
We had some back-and-forth about the betting. Perhaps I could have shamed him into offering 12:1 or 10:1 or something, which was indeed my initial proposal, but upon reflection that seemed a bit one-sided. If he thinks the probability of a specific thing happening is, say, 8%, and I think it’s 66%, it seems a bit unfair to make him bet on his odds. Why not bet on my odds instead, in which case I should be offering him odds the other way? (I said at the time: “I know little about this issue or about how much to trust the models. Just looking at the historical peaks we have had thus far, I’d guess this week or next week will be the nationwide peak and that things will fall off about half as quickly as they climbed. My central estimate for the week in question would be something like 650K new cases, but with wide enough error bars that I’d put maybe 30 or 35% of the probability below 500,000. But I’d also have a substantial chunk of probability over $1M, which you must think is pretty much nuts.”)
In the end we decided to sort of split the difference: if the number of new cases is over 500K that week, he’ll pay me $100; otherwise I pay him $34. We’ll settle about a week and a half after October 1, in case there are later updates to the numbers (due to reporting issues or whatever). Andrew asked me to do a short post about this, to “have it all in one place”, so here it is.
This post is by Phil.
There was an important part of the discussion that was left out. Anoneuoid, in his original post, states that if seasonality is added to the ensemble models, than it’s clear that the total number of cases, per week, will be below the lower bound of the ensemble 95% interval.
Just to be clear, this means that there is an inherent, repeating, and linear trend in the ensemble models. Further, the simple addition of seasonality isn’t obvious to the modelers. I have two points to add (as someone who has built two Covid models):
1 := There are nonlinear events in each model of Covid I’ve seen. For instance, the U of Illinois built a model of how students, returning for the fall semester, would act. The model took into account that these are teen-agers (or many of them are) and they want to party, go to football games, etc. What happened: almost no one followed Covid rules and protocols. When classes started, it was an orgy of partying and close contact with their fellow students. Covid cases went up exponentially and significantly higher than was projected.
2 := A more technical point. Seasonality assumes that S-0, the initial population in any Covid model, is relatively constant. As protocols are lifted and people begin to move around the country and from outside of the US, this is an assumption that I don’t think is verified by the data. That is, because vaccination rates are so varied around the world and around the country, it may well be that there could be an influx of people, who are unvaccinated, and cause the weekly number of cases to spike.
Finally, I would ask Anoneuoid to quantify why he’s so sure of his argument about seasonality. That is, ask him to either present his model and data or describe why it’s quantifiable.
It apparently primarily spreads as an aerosol indoors, so when it gets too hot or too cold people close their windows and turn on the hvac which recycles the air. This raises the average R0. That is why summer cases are worse in the southern US vs north.
I’ve mentioned before there is also a transient ~(0.5 – 2 years?) mucosal immunity, right now this is not fully synced to the seasonality but it probably eventually will sync up, we will see. Related to that, the flu/RSV/bacterial infection cycle has been affected so it seems those are now out of sync as well. In particular there is apparently a summer RSV wave in children.
The best proxy might be something like energy used on hvac, or maybe you can get away with temperature distance from 70 F. I’ve been on the road so was just eyeballing it, I didn’t actually write up a model.
I believe there’s little aerosol infectiousness except in high airflow situations like singing, shouting, exercising etc., or with highly infectious people.
Source: https://www.nature.com/articles/s41598-020-78110-x#author-information
I love and hate these types of studies. It is like they do 50% of science very well then just skip the second half and jump to a conclusion.
Their model needs to be compared to actual data. Ie before trusting the model, there should be data in the figures and not just model output so we can see how well it corresponds to reality.
Theres really no evidence or theory to support this happening. Even if you are infected in the respiratory tract the mucosal immunity has never been observed to last for viruses that primarily replicate in the mucosa. A vaccine injected intramuscularly triggering immunity vs only half of the fastest mutating protein (S1 region of the spike containing the NTD and RBD) out of 29 viral proteins is going to be far worse.
It should protect against viremia and severe lower respiratory tract infection until the virus mutates to avoid it though. Eg, delta mutated so the furin cleavage site is getting cleaved in 70% of spikes before the virus leaves the cell. This has two effects. First the resulting virus is avoiding the antibodies that recognize S1, second the S2 region is now exposed so cell-cell transmission and fusion into syncytia is occuring more often. That also avoids the antibodies.
Even then you should still be protected by T-cells that recognize cells manufacturing the spikes, but that is once again only for 1/29 proteins while for natural infection your body is exposed to all of them.
There was also already a study from Japan that added 4 common mutations to delta that then made it more infective in the presence of vaccine sera. That was using a pseudovirus to infect a specific cell line so may not play out in vivo though.
Sam,
You say “There was an important part of the discussion that was left out.” That part may have been important to you, but it wasn’t important to me at all.
Weather matters, because in bad weather people spend more time indoors in close quarters. That’s a real effect, sure. But to say that this means COVID cases follow a rather predictable pattern month by month…well, we don’t have to look back far to know that’s not the case: the _low point_ in US COVID cases in the second half of 2020 was in early September, whereas Anon is betting on a early September being a local _maximum_ this year, so his logic made no sense to me from the start.
School is back in session — all levels, including college — which (at least in some states) means both increased transmissions and lots of required testing…so that’s a good reason cases should go up from here.
On the other hand, vaccinations are still ongoing, and increasing numbers of people have immunity due to prior infections, so the susceptible population is going down; and there’s lots of news right now about emergency rooms being overwhelmed etc., which one might think would cause people to be more cautious about avoiding exposure than they have been in the past few months; so there are good reasons cases should go down from here.
There are other reasons cases should go up, and other reasons they should go down.
…none of which I thought much about when I accepted the bet. Getting down to 500,000 new cases per week at the beginning of October would require a faster falloff than we’ve seen thus far. That could certainly happen but, well, in my opinion it’s not the way to bet!
It’s happening so far as I expected in the southern US as it cooled except for Texas. The wildcard is what happens in the northern states. Some, like michigan, are rising sooner.
Phil –
Aren’t you going to do some graphing so we can follow the progress of this exciting bet in real time? It’s been 13 days since the famous “near certainty” statement. Of course it’s easy for me to say you should do all that work, but given the national importance of this wager, and if Nate Silver can do it for the elections…
Sam –
FWIW,
As to Anoneuoid’s repeated assertion that the CDC, and ALL the models included in their enables all “ignore” seasonality…truly a remarkable assertion…
First, that claim is uselessly vague. What is the “seasonality” that is being “ignored?” Many of the models include behaviors as a parameter. Generally much of what is considered “seasonality” results from behavioral changes.
Second, Anoneuoid has done nothing other than handwave in his assertion of “ignoring.” In other words, he make an unfalsifiable claim and provides no supporting evidence.
As here:
Maybe we should just take his word for it?
https://statmodeling.stat.columbia.edu/2021/09/02/there-are-no-equal-opportunity-infectors-epidemiological-modelers-must-rethink-our-approach-to-inequality-in-infection-risk/#comment-2022865
Third, he makes an assertion that inserting “seasonality” would result in accurate modeling, but offers zero clarification as to how the effects of seasonality would be diaaggregated from confounding variables (like effect of vaccines or different attributes of different strains) so as to be measurable.
I read the discussion and started to read the paper. To be honest, this has become a discussion that is too time intensive. I’d add two (final) points: a) Your arguments seem sound. That is, seasonality should be able to be detected, especially in an inference model using synthetic data. The second point, luck is always a factor. Rather than focus on the validity of your argument, I would assume it is and, instead, calculate the likelihood that Anoneuoid gets lucky and wins the bet.
Sam –
Got it. Seems a wise choice.
Linked from the cdc forecast site:
https://github.com/cdcepi/COVID-19-Forecasts/blob/master/COVID-19_Forecast_Model_Descriptions.md#Columbia
Then you can follow a link from there to see it refers to their model 2, the description of which also does not mention seasonality. Their model 3 has a crude seasonality that just assumes R drops in the summer, but that’s not what is described in the documentation given by the CDC.
Obviously it would be ideal if they just open sourced the model they are using to make submissions, but Joshuas claim amounts to saying the documentation is wrong because he found a paper by some of the same authors about other countries. It is not really worth spending time on it.
Anoneuoid –
> Obviously it would be ideal if they just open sourced the model they are using to make submissions, but Joshuas claim amounts to saying the documentation is wrong because he found a paper by some of the same authors about other countries.
No. My assertion isn’t that the documentation is wrong. My assertion is that following the very first link shows that modelers whose modeling they include in their ensemble mention seasonality.
> It is not really worth spending time on it.
Well that’s pretty much my point. You say it’s not worth taking the time to investigate AFTER you make a broad assertion that the CDC “ignores” seasonality, and provide no way of assessing that assertion and zero evidence to back it up.
You don’t even take the basic step of defining what you mean by “seasonality” when you’re saying it’s being (completely) ignored by the CDC.
Seems to me that the CDC, and basically every expert who has been talking about the pandemic has included a discussion of “seasonality” when forecasting it’s future trajectory.
So your asseetion semes highly implausible to me. Yet you make it, repeatedly, and provide no actual evidence for your assertion, and now say it’s too much trouble to provide evidence.
Now I’m left to wonder if your statement that you haven’t provided evidence because it would be too much trouble to do so is plausible.
If it’s true that the CDC “ignores” seasonality that would be pretty important to know. That would seem to me to be unsupported, scientifically, as far as I can tell.
If it’s true, then please do provide evidence.
I will add, from what I’ve seen most of the CDC forecasting seems to be at the 4-week level. So that, in a sense, may get to the heart of what you’re saying. Over that short a period, the effect of seasonality would likely be minimized anyway.
If they do longer-range forecasting, that’s another matter and if they do “ignore” “seasonality” over longer periods that would be truly bizarre.
I would formalize your intuition with, say, Pearson’s correlation coefficient. If this is a linear correlation, than the covariance between average daily temperature and cases of Covid should be lower, than in the summer — and this should obviously be correlated with the number of daily infections. This, then, should be noticeable as seasonality (as you mentioned) from the time of the start of the pandemic to, say, shortly before vaccinations started. Right?
In any case, good luck.
I doubt daily average does it. It can be hot during the day and cold at night giving an avg of ~70 F, but the AC or heat are running most hours during the day and night.
You’d need something more correlated with hours of people spending time outdoors and opening windows.
Days on which you run both the AC (in the day) and the heat (at night) are pretty rare. Perhaps just a few in the spring and the fall. None so far in my house this year, and I expect none in the next months.
It depends on where you live. In desert ares it’s not at all uncommon to need heat in parts of the day and air conditioning in others.
Note that there are already markets you can bet on COVID on Polymarket (previously mentioned in this post https://statmodeling.stat.columbia.edu/2021/08/19/a-scandal-in-tedhemia-noted-study-in-psychology-first-fails-to-replicate-but-is-still-promoted-by-npr-then-crumbles-with-striking-evidence-of-data-fraud/ where Polymarket had a market on whether Ariely’s paper would be retracted by October 1, which ended up happening https://polymarket.com/market/will-pnas-retract-dan-arielys-2012-paper-on-dishonesty-by-october-1-2021). Odds will of course represent aggregate opinion more accurately in a market w/ many participants rather than individual bets.
Several examples are
Whether the US will have more than 200k new daily COVID-19 cases on or before October 1, 2021? (6 cents Yes, 94 cents No)
https://polymarket.com/market/will-the-us-have-more-than-200000-new-daily-covid-19-cases-on-or-before-october-1-2021
Will the United States report a record high 7-day COVID-19 case average before January 1, 2022? (12 cents Yes, 88 cents No)
https://polymarket.com/market/will-the-united-states-report-a-record-high-7-day-covid-19-case-average-before-january-1-2022
And perhaps most surprising:
Will Wisconsin or South Carolina have a higher 7-day COVID-19 case average on October 1? (39 cents Yes, 61 cents No)
https://polymarket.com/market/will-wisconsin-or-south-carolina-have-a-higher-7-day-covid-19-case-average-on-october-1
Thanks. At first I thought this used polygon but it is just USDC it looks like.
No problem, and ah yes, it uses the polygon network, but only USDC on the polygon network, and not the polygon/matic token. A new method was instituted through crypto.com that allows big transfers for only 8 cents.
Glad someone mentioned polymarket. For what it’s worth when this discussion was happening (Sept 2), this market was spiking up to think that that there was a 75% chance that cases would pass 200k (!!!). This was way out of line with the above linked models, which put the relevant values (1.4M) barely inside the 95% confidence interval. So even a naive trust of those models would have (and likely did) make plenty of people plenty of money betting on “no”. I’d be really interested to know how much this reflected aggregate opinion vs 1 or 2 people making really huge bets against that opinion.
In general I think these markets are way more interesting than 1 off bets for this kind of thing, but they are less useful for solving 1 on 1 disagreements.
Since the pandemic started, the most inappropriate test has been in use. PCR is a diagnostic tool, but what we are interested in is prevalence.
So, all those reported ‘cases’ I take with a lump of salt, as it is convenience sampling at its best. Self-selection really. At first only very sick were seeking the tests (remember shipping to Atlanta and two weeks turnaround time), followed by nervous nellies before the vaccines, followed by a lull in ‘cases’ once a significant chunk got vaxed and their priorities were how to book the next flight, not stand in line to get tested, etc.
Cases as a function of positive PCR test have been pitched as a reliable metric based on carefully designed random or cluster sampling. In reality, it was a cross-section of those who bothered to get tested, or those who were sick, highly biased. The ‘dark data’ is what we really were interested in, but ‘case’ counts do not provide any insight into it.
I have solely concentrated on hospitalization and death from day one to make sense of any of it. I know they are imperfect metrics, but way better than to rely on ‘cases’.
Of course longitudinal cheap antigen testing deployed using some probability sampling techniques would make too much sense, and we can’t allow that.
navigator –
>…cheap antigen testing deployed using some probability sampling techniques would make too much sense
Small sample and during periods of limited background rate… but still…impressive results. Although obviously it’s not suitable for assessing prevalence of infection.
https://jamanetwork.com/journals/jamanetworkopen/fullarticle/2783550
Thanks Navigator and Joshua,
I’m coordinating a Covid Testing Working Group in DC. As you know Michael Mina has posted here on Andrew’s blog. We need billions of rapid antigen tests. Yet only 280 million are to be manufactured under the Defense Production Act.
Why can’t we leave at least the test part to the free market?
Last I checked German supermarkets were selling 5 packs for a few Euros.
Even here in India I can get Amazon to deliver a rapist test kit by Abbot for $3 next day delivery.
Because of the damn FDA. Here in the US there are I think 2 manufacturers and the price of a single test is like $12 plus the manufacturer just destroyed their entire warehouse of stock. Noone can compete without going through months and months of FDA approval process
We are still waiting many more weeks at best to get an EUA to give under 12 year olds the Pfizer vax. This despite a simple back of the envelope calculation showing that even if the side effects were 10x worse in this group, waiting longer than 5 minutes for approval does more harm than good…. FIVE MINUTES and they plan to be ready by end of October, that’s 17000 times longer than the longest you could justify waiting
The rate of myocarditis is up to 1 per 1000 shots when they looked more carefully for it:
https://www.medrxiv.org/content/10.1101/2021.09.13.21262182v1
And it seems to increase the younger you get. I don’t know much about myocarditis, but it seems that if you get a case it essentially ages you by 10 years when it comes to all cause mortality rates.
You are going to keep seeing the benefits dwindle and risks grow because the initial batch of research was almost unbelievably biased.
There have been over a billion doses of Pfizer vax administered worldwide but let’s go with a small localized study of 32000 doses in Ottawa with no control group (inclusion in the study required vax)
I doubt most people go to the doctor for chest pain until it gets really bad, and then the doctor needs to make the connection with the vaccine to report it. One million cases worldwide is not really something I would expect them to notice.
The research community couldn’t even figure out that cases were increasing the first week after the shot despite a dozen papers showing it and a well established medical reason to think this would happen. They largely just put a table in the paper and ignored it or adjusted until it went away.
There are probably other things being missed as well. That is why we need to see the all cause morbidity/mortality data in vaccinated vs not. This is not available anywhere!
Myocarditis happens typically about 10-20 per 100k people per year, is usually caused by viral illness, and there could easily have been an outbreak of some virus or other in Ottawa at this time. The serious complications are undoubtedly related to viral induced cases, where the virus itself is driving illness (since this is almost all cases). COVID itself induces myocarditis at something like 30-40x the normal frequency (so I guess that means 300-600 per 100k though they’re probably ignoring the time dimension) https://www.aappublications.org/news/2021/08/31/covid-myocarditis-risk-children-083121
The Israel study showed rates about 275 cases among 5M vaccinations, mostly in men 16-30 years old. https://www.medpagetoday.com/special-reports/exclusives/93265
That’s a rate of 5/100k or so. the only reason to think this is even a vax thing is because it occurred relatively quickly after the vax doses. Otherwise it’d be a blip in the background rate. Also almost everyone recovers rapidly (within a couple days) unlike cases caused by viral illness.
I also don’t think this type of thing is necessarily due to the vaccine per se. My aunt is a pharmacy tech at a huge nationwide chain who was giving the shots, and when I mentioned they should be aspirating to check for blood before injecting the vaccine her eyes got wide and horrified. People aren’t even being trained to take basic precautions when giving out these shots.
If you inject any substance meant for the muscle into the blood it probably raises the risk of clots and other cardiovascular issues. Passing out needles then telling people who don’t know what they are doing to start injecting each other with stuff doesn’t seem like a good idea.
Anoneuoid –
> This is not available anywhere!
Good thing you haven’t let that get in the way of you promoting your plausibly Denis le their that vaccines kill, and it’s being ignored/covered up.
…promoting your plausibly deniable theory that vaccines kill…
Daniel –
Weird (504 error) glitch when posting.
This belongs here
https://statmodeling.stat.columbia.edu/2021/09/16/wanna-bet-a-covid-19-example/#comment-2023667
I just went down the aspiration rabbit hole. That was the standard practice based on logic and a few reports of accidentally injecting various substances into the blood decades ago. There was no RCT or really any publications at all on the topic, but better safe than sorry.
The CDC/WHO et al (the evidence based medicine crowd) interpreted this to mean “stop aspirating before I.M. injections”. As mentioned above, they are not going to detect something that happens 0.1% of the time without looking for it. It is just insane what is going on in these public health agencies.
If aspiration was doing something useful, and they’re not doing it now, don’t you think in 1B doses given of Pfizer alone, that we’d see some kind of signal in terms of needing to hospitalize more than a few people due to injecting into the bloodstream? It must be exceedingly rare. They’ve detected the cardio problems at rates of maybe 5/100k so they’d detect blood clots or anaphalaxis or whatever as well if it were in that range or better. 0.1% is 1/1000 or ~100x as likely as the cardio issues.
Apparently no one is looking at all cause mortality/morbidity, so how would they see it? Even if they were looking for a signal, there is the NHST issue described by unanon here:
I agree with this post, is essentially impossible for them to see such a “signal” using their methods (NHST).
Via what method would you expect a signal appearing at rate of 1/1000 (or even 1/100) be detected by the medical research community?
This was the post I quoted:
https://statmodeling.stat.columbia.edu/2021/09/14/public-opinion-on-vaccine-mandates-etc/#comment-2023389
“Symptoms settled quickly with standard therapy and patients were discharged within a few days. No major adverse cardiac events and no significant arrhythmias were noted during inpatient stay. Further follow up will be required to ascertain the longer-term outcomes of this patient group.” from your linked study.
Check this link out – https://sciencebasedmedicine.org/open-letter/ and this one – https://sciencebasedmedicine.org/what-does-it-mean-to-be-anti-vaccine/
“While vaccine-induced myocarditis is real, vaccines cause myocarditis less often than the virus and vaccine myocarditis is generally less severe.” “the core that unites anti-vaccine thought is: 1) inappropriate minimization of the risk of the virus, and 2) inappropriate minimization of the safety and efficacy of the vaccine” from link 2
All of the observed risks of vaccination are far below the risks of the disease and no amount of catastrophizing can change that simple real-world fact. all else is just FUD.
This is the part even the FDA is unwilling to acknowledge when it comes to under 12 kids. We have basically 2 choices now, be exposed to COVID before the vaxx or be exposed to COVID after the vaxx. Withholding the vaxx from 5-11 year olds who are in person at schools is going to needlessly expose many more children BEFORE vax and that harms those children. Plus, between 20-50M kids in the US who want the vax are forced to suffer reduced quality of life cause by continuous anti infection controls, reduced in person activities etc.
The vax could have dramatically worse side effects than it obviously does and the decision would still be very clear: COVID first is worse than Vax first. That’s all that matters. Since the difference is so large, delays are unethical. It’s like withholding the ebola vax so you can get enough control patients during an outbreak where the first small batch had a huge positive signal. People die or are severely harmed because you withheld life saving treatment because you preregistered a frequentist study and couldn’t get a confidence interval if you stopped the trial.
@ JDK
To be clear, I am skeptical of the entire modern healthcare system, in particular the pharmaceuticals. I wasn’t until I worked in it and saw what was going on. After what I experienced, I find it very difficult to believe there is a net benefit from interacting with it in any way.
While frontline workers are mostly trying to help, they are getting their guidance from the research community which is suffering from mass confusion due to being trained in the nonsensical NHST method with a nice dollop of p-hacking on top to get the publications out.
Essentially as described here by Ronald Fisher in 1958:
https://www.york.ac.uk/depts/maths/histstat/fisher272.pdf
In some cases like broken arms, etc I would assume it is still a net benefit. Basically stuff come up with before NHST and EBM became dominant.
The default of trusting this stuff is crazy if you’ve seen what I’ve seen. But I understand why others do default to that.
When you watch the highlights of soccer games on the internet, as I do, the highlights are interrupted every so often by video ads. A lot of the ads are about person X who successfully predicted that markets (or economy) would (fill in the behavior) in (fill in the year), would now (fill in present day behavior). If you research it, you find that many of these people really did make the predictions (or bets if you will) as stated, based on the keen and unique insight that they possess about the market (economy) Wow! What more proof would you want about their theories?
Of course, when you research it further, you find that they later made a bunch of predictions based on the same theories that did not turn out to be true. I think it has something to do with n=1. I have no idea what this has to do with this post and discussion, but I have always been amused by the ads, and perhaps saddened how often over the many years I have missed out on being made a millionaire many times over.
PS – More and more the ads mentioned above are being replaced by weight loss ads and ads for products that will guarantee you will be completely healthy and never get sick, tired or grumpy. I am holding out for the one that promises to make me young, smart and handsome. At least some of the soccer games have been really good.
I love such bets. In some of these debates the back and forth becomes too tiring and nitpicky.
Nothing like a good bet to settle a claim. Clean and straightforward.
The fact that a bet is made settles not the claim about which I’d give a tinker’s dam, but another claim about which I don’t.
Namely: that A (the one who’s willing to bet) is more confident in his claim (at that instant) than B is confident is in his alternative or counter-claim.
Yes, it “settles” (for the moment anyway) *that* claim.
But why should I or any other onlooker be interested in the mere fact that A is the more confident one of the two?
If I had access to the *evidence* which the two implicitly bring to bear in support of their view, well, I might reach my own conclusion. I might conclude that the more confident of the two was delusional, or that he was a bluffer; or that that he was right after all. Who knows.
But nothing persuades that my assessment of the claims be tied to either [a] the mere eagerness of some vociferous party to place a *bet* or [b] the inscrutable or misbegotten willingness of the other party to take him up on it?
Rm:
I agree with you that the existence of a bet typically provides very little evidence on the question at hand, and the outcome of the bet typically doesn’t provide much evidence either. It’s N=1, after all! I also agree with you that we should not require “willingness to bet” as a prerequisite to taking someone’s claims seriously.
But . . . I do think bets can be useful. Not so much from the outcome of the bet, but more because the format of a bet encourages precision in the uncertainty statement. I think that’s what Rahul was getting at in his comment.
I haven’t agreed with all of Anoneuoid’s arguments but I much appreciate their contributions to the forum. Unfortunately, I feel that conversations about COVID-19 on both sides of the political spectrum are vulnerable to group think. I hope that the recent controversies around boosters can help us move beyond “two sides” here.
I agree with comment above that one shouldn’t put much weight on one bet, but making bets (as long as you make enough) is good because it helps people correct mistaken beliefs.
I also agree with the comment above that infections rates based on reported tests are probably not be a very accurate measure of actual infection.
Finally, I’d be curious if anyone has looked at some of these models to see if they’re systematically over or under-predicting infections. Thanks.
Daniel –
Any thoughts as to whether covid-induced myocarditis might have a “dose-dependant” type of relationship with severity of infection, oe whether it has any likelihood of being more/less severe than when the condition is caused by other factors?
I absolutely believe that myocarditis from vaccine is dose dependent, and I am appalled at the stupidity of the dosing. My understanding is everyone from age 12-16 is getting 30micrograms. In under 12 they’re testing 10,20,30 micrograms. My own thought is that like everything in the world, the phenomenon only depends on **dimensionless** ratios. My preferred method of dosing would be to measure the dose as a fraction of some estimate of the mass of the immune system cells, which are principally in the bone marrow…
A good method would be to look at the side effects as a function of dose / mass of bone marrow, and mass of bone marrow can be estimated as height * cross_section_of_bones. So the dimensionless ratio would be
dose / ( rho * h * (mass/rho)^(2/3)) assuming that (mass/rho)^(2/3) is a good scaling law for cross sectional area of bone
If you assume that 30micrograms is a reasonable dose for a 16 year old, you wind up getting about 15ug for a 10 year old and 8ug for a 5 year old (I used the CDC height/weight for age graph for median values at each age)
also I’m estimating that rho is about 1200 kg/m^3, just slightly denser than water, since people mostly sink slowly if they breathe out in a pool.
Daniel, why are vaccines for pertussis and diptheria given in reduced amounts over time for adults than they are in children?
I don’t know. The adult vaccine is different than the one given to young children (Tdap in adults, whereas it’s called DTaP in young children and has a different mix of ingredients). Adults have typically had these inoculations before, so the “boosters” you’re giving every 10 years serve a different purpose than the initial set of inoculations.
Children are generally immunologically more naive. They tend to have fewer severe reactions to things, compared to for example the prevalence of allergies in teens and adults. If anything this argues for giving the 5-11yo group COVID shots before you give to the 12-16 year old group who are going through a lot of body changes, changes that often induce inflammatory issues (acne, allergies, onset of autoimmune problems).
There are lots of reasons why you’d want to treat under say 5 year olds differently from the 5-11yo group. The 5-11 year old group is now in schools, and at greater risk for COVID due to that exposure. I doubt very much that there’s enormous difference in immune system reactions between 5 and 11 year olds that isn’t related to basically “size” as measured above. Whereas for birth to 3 years there’s probably a lot more stuff going on immunologically in terms of the diversity of antibodies and memory cells in the blood, the number of viral infections that have been seen in the past, the number of viral infections children have concurrent with the vaccine, etc. My experience with my kids was they were sick continuously from the first week in daycare until about age 4.
Daniel. No, that’s not correct. Tdap (for adults) is different from DTap (children) because Tdap (adults) has reduced amounts of diphtheria and pertussis bacterial inactivated toxins (the lowercase letters in the acronym are meant to designate this). The reason is this: the impact of these inactivated toxins is perceived to be worse for adults than children.
I think you actually are saying the same thing I did, or at least what I meant. The impact on adults is worse because children are more immunologically naive, so injecting something at higher doses is less likely to spark a strong reaction, whereas adults are more likely to have had the vaccine in the past and mount a strong reaction to the stuff. That’s what I meant when I said the “boosters” have a different purpose than the primary initial inoculations.
I would be surprised if the Tdap in adults who had NEVER had any immunological exposure to T,D,or P was sufficient to do what you’d want. However, these vaccines have been given since well before I was born, so there’s no one who makes it to 40 years + who hasn’t had any tetanus, diptheria or Pertussis inoculation.
I’m enjoying this conversation by the way. It’s refreshing! Clearly you have some knowledge of vaccinology!
Daniel, why is vaccine dosing generally the same volume out of a given vial from a given manufacturer, with volume sometimes loosely stratified (i.e. HepA or HepB) by 1 or 2 age groups?
As near as I can tell, this is for convenience, maybe to prevent errors, maybe because people think that letting doctors or nurses near a calculator might be dangerous. For something like acetaminophen you can easily find dose per weight charts etc. Yet for vaccines it’s just give everyone the same dose. For kids at least you can assume the kids are getting the doses at certain “recommended” times and just go based on their current age/weight.
I really think dosing in vaccines could be improved a lot, would probably reduce side effect incidence. I did actually look to see if data was available for the 12-16 year old trials for Pfizer but on the website it says they’ll “provide it to qualified researchers” which just means you’d better have connections or forget it. I was going to try to regress peak antibody levels against dimensionless dose as described above (hoping that they’d have weight and height of patients in the dataset).
You omit other issues such as production efficiency, the idea that some vaccines are pre-loaded in syringes at a given volume, vial waste, and a whole host of other issues. Public policy is another one. For health-policy, the implementation needs to balance complexity/optimality with practicality and standardization. Simple, easily applied strategies (see: cancer screening) are generally desired compared to individually-tailored ones because there are many stakeholders: manufacturability/production, administration of vaccine by practitioners, and a mostly ignorant public.
I don’t disagree that dosing in vaccines could be improved, but vaccine dosing is much different than medication dosing. There aren’t simple dose/response curves here. The relationships can be quite wonky (e.g. N-curves that are seen in TB vaccines). There are different systems in play and different goals. For some vaccines (pertussis, etc), the side effects increase (or are more severe) as a function of an increase in your dimensionless variable and the benefit is worse. Sometimes the opposite is true. Sometimes decreasing vaccine dosage increases immune response (yellow fever) compared to a larger dosage. Sometimes the opposite is true. It’s a bit more complicated than you are making it out to be.
Believe it or not, there are a lot of bright people in both FDA and immunology community/virology community/industry that understand how to perform complicated regressions, create alternate predictive metrics/variables based on patient characteristics, and such. They are not as brain-dead as you make them out to be. They are capable of thinking of the same ideas as you, but have additional perspective (e.g. years of experience) as well. The literature is rich with papers like these: https://www.ncbi.nlm.nih.gov/pmc/articles/PMC6860008/
https://www.ncbi.nlm.nih.gov/pmc/articles/PMC7871111/
As far as I understand, preloaded syringes don’t apply here.
In the clinical trial they are checking 10,20,30 microgram doses for the group under 12 years old. My dimensionless formulation covers this same range but tailors to the individual body. I don’t see how choosing 10,20,30 ug is better in any way than choosing 0.5, 1.0, and 2.0 times the dimensionless dose. Yet I don’t see clinical trials using dimensionless dosing very often.
I don’t doubt some people are aware of these issues, however they don’t seem to be the people who get to make decisions about trials or published analyses, since it’s super rare to see dimensionless dosing in medical journals.
Also thanks for those paper links. The dose finding ideas they have there presumably should be done in earlier trials… where you’re using a few hundred patients, giving a wide range of doses, and looking at immunogenicity in the blood and severity of initial side effects. That should be done in small studies before settling on a smaller range to use in wider trials where you’re looking at real-world effectiveness and trying to discover rarer side effects…
but that’s not where we are with Pfizer’s vaxx… we’ve injected over a BILLION doses of that vaxx among people over 18 worldwide, we have enormous data, now we’re running tens of thousands of person trials on younger kids during a dynamic pandemic, where the primary question is 10, 20, or 30 ug fixed dose for the entire range 5-11 year olds. That doesn’t strike me as the kind of smart thing you’re arguing people know how to do. So while there are smart people, again they don’t seem to influence reality.
Even with the moderna original study, they found months and months later that 1/4 the chosen dose was very good at inducing antibody responses. this was data they had from the start. https://www.nature.com/articles/d41586-021-01893-0
when you see that kind of thing, it’s hard to think that the smart groups that you mention, that I know DO exist seem to have much in the way of power at all. Knowing what I do about organizational dynamics, it’s not that surprising. Generally the “nerds” are kept as far away from the regulators as possible.
Daniel, well, that’s not quite true. There are plenty of smart people up and down the organizational chains. Also, some of the regulators are also “nerds”. As you’re aware, industry and regulators often co-mingle, with industry folks ending up at FDA and vice versa. I meet folks from both sides!
If you (or anyone reading this) are truly interested in understanding the basics of FDA oversight with regards to vaccines, I would recommend starting with these:
Overview of CBER’s Process
https://www.ncbi.nlm.nih.gov/pmc/articles/PMC7152379/
Considerations for the Development of Toxicity Studies for Preventive and Therapeutic Vaccines for Infectious Disease Indications:
https://www.fda.gov/media/73986/download
Content and Format of Chemistry, Manufacturing, and Controls Information and Establishing Descriptive Information for a Vaccine or Related Product:
https://www.fda.gov/media/73614/download
Providing Clinical Evidence of Effectiveness for Human Drug and Biological Products
https://www.fda.gov/files/drugs/published/Providing-Clinical-Evidence-of-Effectiveness-for-Human-Drug-and-Biological-Products..pdf
Do you want to meet with FDA? Better be up on Formal Meetings Between the FDA and Sponsors or Applicants
https://www.fda.gov/media/72253/download
What about experimenting on children? You can read up on the Pediatric Research Equity Act of 2003 and associated documents.
https://www.congress.gov/108/plaws/publ155/PLAW-108publ155.pdf
Doing a trial? Here are the general regulations E8 Consideration for Clinical Trials (Revision 1)
https://www.fda.gov/media/129527/download
But Daniel, we’re statisticians, so this would be useful. E9 Statistical Principles for Clinical Trials
https://www.fda.gov/media/71336/download
Daniel, the regulations FDA impose serve a much greater purpose than to answer the question “does it work?” Safety and efficacy need to be demonstrated across the entire manufacturing, supply, and process chains. Appropriate controls need to be demonstrated to ensure purity, manufacturability, safety, and efficacy of the vaccines. Did you know a submission for just one of the COVID vaccines under the Emergency Use Authorization (EUA) regulatory framework was 110,000 pages? This isn’t a typo! A non-EUA vaccine submission for Pfizer was about 340,000 pages. Every–single–page of the submission has to be reviewed, by multiple people!
I don’t mean to offend you, and I think you’re a super smart guy, but I think you’re off your bloody rocker to think these approvals are simple (or *should* be simple) and can be based on back-of-the-envelop calculations based on such a *narrow slice* of what it takes to push this stuff through. There are *PERVERSE* incentives in industry to take short-cuts and not do this stuff the right way–there is no shortage of snake-oil salespeople out there, GOBS of money to be made, and *ton* of pressure on regulators to ensure there are no tricks and the quality of evidence is up to snuff. I don’t envy them. They’re people too, and doing the best job they can. There isn’t a conspiracy of pushing “know-nothings” up the chain of command, ignoring the cries of nerdy inferiors. Leads for the various regulatory departments at FDA are excellent scientists, and C-suite/VPs at corporations can be great scientists too. FDA’s oversight procedure is partially a solution to dealing with the types of incentives that exist in the real world.
Also think about it this way, when you give a constant 30ug dose to everyone between age 12 and 18 say… you’re actually giving a *varying* dimensionless dose.
We can prove that all physical processes depend *only* on dimensionless quantities by an argument that says that outcomes must be independent of your choice of units to measure in. We need to predict the same results whether you measure in kg,m,s or lbm,ft,years or mg,cm,hours. This only occurs when your equations are expressed as dimensionless ratios.
Therefore when we do “10,20,30 microgram” trials, we’re actually giving a *different dose to each person* (measured by the thing that matters, some set of dimensionless quantities).
Usually there would be at least 1 but often less than 3 to 5 dimensionless quantities that matter most. For example you might have my previously described dose / (rho * h * (m/rho)^(2/3)) as one dimensionless group, another might be “number of viral infections since birth” which is dimensionless since it’s a pure count, but can be expressed for example as integral((avg_infections/yr)*dt) and might vary primarily among youngest children… and maybe there’d be something like the concentration of the fluid injected in terms of the volume of the muscle its injected into so (vol_injected/muscle_volume)… there might be something like a ratio of binding energy between the proteins injected and the receptors they activate, something like that as well, and that could vary based on something like salinity of the injected fluid or who knows what.
So by no means do I think dosing should be just a single dimensionless quantity with a linear relationship in that dimensionless quantity, but I would LOVE for you to show me even ONE medical article that represents medical response to treatment in a dimensionless format. I don’t read them all day long, but whenever I have read medical articles it invariable is NOT the case that there’s a dimensionless treatment of dosage or response. Most often it’s regression of dimensional quantities against other dimensional quantities (such as say ng/ml of some quantity in the blood against milligrams administered)
A rather classic juxtaposition of comments.
One from someone who suggests over and over that the vaxes are largely ineffective and likely a significant killer (via plausible deniability, of course), and that are being developed and pushed and administered and regulated by dopes and/or dupes and/or creeps who “ignore” relevant science and pharmaceutical companies with which we might be better off avoiding completely.
Another who says that withholding vaxes (developed by pharmaceutical companies) kills people and is unethical
One thing that I will say about Anoneuoid is that he’s generally amenable to quantitative modeling influencing his opinions I suspect that if he believed that the vaccine were effective and safe in the way that the FDA does he would agree with me that the FDA withholding it in order to run an enormous clinical trial discover the precise rare rate of complications was unlikely to be the optimal outcome.
Daniel –
> f he believed that the vaccine were effective and safe in the way that the FDA does he would agree with me that the FDA withholding it in order to run an enormous clinical trial discover the precise rare rate of complications was unlikely to be the optimal outcome.
That may well be and I’d like to think so. I truly don’t have an assumption otherwise.
However.
I look at his response to your mention that kids may be more susceptible because of Delta, and in response he points to an alternative causality – kids staying home from school last year.
What’s missing…
Any discussion as to how much staying home from school last year actually reduced what would have been kids’ total lifetime exposure (at school, at home, etc.) to other coronaviruses.
Any discussion of how much staying home from school may have had a countervailing benefit in the other direction of reducing their exposure to COVID, and then potentially passing on infections to others.
Any discussion of how any potential lost protection resulting from one year less of in-school exposure to other coronaviruses might have contributed to their overall protection relative to OTHER possible reasons why kids may be less susceptible to COVID, such as described here:
https://www.sciencedirect.com/science/article/pii/S2052297521000287
Or here:
https://adc.bmj.com/content/106/5/429
All of that, which reflects a repeated pattern, makes it difficult to put his comments into some full context.
Daniel – >
If he believed that the vaccine were effective and safe in the way that the FDA does he would agree with me that the FDA withholding it in order to run an enormous clinical trial discover the precise rare rate of complications was unlikely to be the optimal outcome.
That may well be and I’d like to think so. I truly don’t have an assumption otherwise.
However. I look at his response to your mention that kids may be more susceptible because of Delta, and in response he points to an alternative causality – kids staying home from school last year.
What’s missing…
Any discussion as to how much staying home from school last year actually reduced what would have been kids’ total lifetime exposure (at school, at home, etc.) to other coronaviruses.
Any discussion of how much staying home from school may have had a countervailing benefit in the other direction of reducing their exposure to COVID, and then potentially passing on infections to others.
Any discussion of how any potential lost protection resulting from one year less of in-school exposure to other coronaviruses might have contributed to their overall protection relative to OTHER possible reasons why kids may be less susceptible to COVID, such as described….
[I assume the original comment held in moderation will clear after some time with two links included]
All of that, which reflects a repeated pattern, makes it difficult to put his comments into some full context.
@Daniel
I discussed with you on here years ago that, in 2005, the FDA itself released a report to congress saying it wasn’t competent to judge whether drugs were effective back due to mission creep with lack of correspondent funding increases.
Then in like 2010 they came out with a powerpoint saying they were still working on addressing that problem. I don’t know whats happened since then but I assume still nothing.
So I don’t see why you should care what they say, just go get your kids vaccinated if thats what you think is best.
Btw, I didn’t listen today, were anti-PEG antibodies finally mentioned? Since 2005 they always recommended checking for any pegylated drug, but so far thete is zero data published.
People who work on this stuff have been practically begging for data on that because it is expected the more you inject the pegylated vaccines the stronger the anti-PEG response:
https://pubs.acs.org/doi/10.1021/acsnano.1c05922#
Here it is, it was 2007:
FDA Science and Mission at Risk Report of the Subcommittee on Science and Technology
https://web.archive.org/web/20071212142033/https://www.fda.gov:80/ohrms/dockets/ac/07/briefing/2007-4329b_02_00_index.html
> So I don’t see why you should care what they say, just go get your kids vaccinated if thats what you think is best.
I care because all the gatekeepers who I have to convince to administer the vaccine don’t listen to me, they listen to the FDA, they just won’t give it to my kids.
On the other hand, every single doctor I know with a kid my kids age (10 and 11) has lied or otherwise circumvented that to get their kid vaxxed, except one. I also know an entire public school where a doctor parent came and vaxxed all the 10 and 11 year olds whose parents wanted it, under the radar.
so if you’re connected, you’ve already got a vax for your 10 year old, if you aren’t connected, your child is suffering through online school or the fear that there’ll be an outbreak at their school.
Sorry that should have said PRIVATE school.
Most of the people I know had extremely mild reactions to getting vaccinated, just slight soreness at the injection site or that sort of thing. But I know a few people who had relatively severe reactions, pretty much incapacitated for a day or so — not literally, it’s not like they couldn’t move at all, but it was bad enough that they just lay in bed as if they had bad colds. Everyone I know who had a bad reaction weighs less than 150 pounds. Maybe that’s a coincidence but it did make me wonder if this is a dose-response thing. Does it really make sense for me and my wife to both get the same dose, given that I weigh something like 40% more than she does? I can understand that they may not want the people administering the vaccines to pull out the ol’ calculator, but it seems like they could have, say, three doses for under 150 lbs, 150-220 lbs, more than 220 lbs. Or something. Maybe it doesn’t make much difference and I’m hypothesizing based on noise, but even in absence of data I would be surprised if the optimal dose for a 250-pound man is also optimal for a 130-pound woman.
This is not to say that scaling with body weight is the right thing to do, though. Daniel (and whoever else), if you aren’t familiar with Knut Schmidt-Nielsen’s book “How Animals Work”, or his longer and arguably more scholarly book “Scaling”, you should be. How Animals Work is one of my favorite books of all time, it’s just great.
How physiological parameters scale is the main topic of both books. How Animals Work has a chapter about some researchers who gave LSD to an elephant, calculating the dose by scaling up from doses that were given experimentally to cats. They scaled by body mass. As Knut points out, a priori that might or might not make any sense at all. Perhaps the scaling should be based on brain weight, for example. Or perhaps metabolic rate. Or perhaps the weight of the liver. He gives a bunch of different possibilities, which would imply, I dunno, maybe it was one or two orders of magnitude difference in the dose you would end up giving.
Phil, not sure if you saw it but above I argued for scaling by the mass of the bone marrow, which I argued was rho * height * (body mass/rho)^(2/3) this is based on the idea that the strength of the immune response is related to the total number of immune cells you could muster. Assume 30 micrograms is “perfect” for an 18 year old male, and look on the CDC growth charts… Do the math yourself and compare you to your 150lb friend who had the bad reaction, see what the dimensionless dose difference is
To be clear for other people who might not be physicists or understand what I’m arguing for here, I’d call the “dose” as the ratio of the amount of drug given, to the quantity rho * h * (m/rho)^(2/3)… now I used rho = 1200 kg/m^3, and h in cm, and m in kg… But to compare the relative size of two separate people who each got the same dose in mg, you’d just do:
(h1 * m1^(2/3)) / (h2 * m2^(2/3)) since everything else is constant and cancels.
Let me say Phil is 6ft tall and 210 lbs, and his friend is 5.4 ft tall and 150lbs, then the friend’s dose is:
6/5.4 * (210/150)^(2/3) = 1.4 times as big as Phil’s dose
Now if you took two people identical to Phil’s size, and you gave one Phil’s dose (let’s say 30ug) and then you increased that dose by 1.4x to 42 ug and injected his friend, which of those people do you expect to have worse side effects?
And yet we’re ok with injecting the “constant dose” of 30ug into everyone from 12 year olds to Phil… ??? that seems insane to me.
I had an intermediate reaction to both shots. Rough day after both shots but manageable.
“Let me say Phil is 6ft tall and 210 lbs, and his friend is 5.4 ft tall and 150lbs, then the friend’s dose is:
6/5.4 * (210/150)^(2/3) = 1.4 times as big as Phil’s dose”
You mean Phil’s dose is 1.4 as big as the friend’s dose. This calculation would need to be vaccine and perhaps side-effect dependent, since not all side effects are strictly immune-mediated responses (pertussis vaccine side-effects etc.).
I agree with Phil–it’s not clear what scaling should be based off of, and even if it were “immune mass” it’s not clear it’s being scaled correctly. Whatever new method is chosen would need to be validated. I doubt if height/weight and an intermediate calculation were required that it would be implemented in practice. This would require additional burden at each and every vaccination site–namely a scale, tape measure, and a validated device to do the dose-scaling conversion. You would not want to rely on an assumption that hundreds of millions of these calculations being done by hundreds of thousands of individuals with their own personal calculators would be done correctly. It would be a logistical headache, maybe dangerous, and not practical. I suppose an alternative could be a look-up table of various height/weight combinations and use self-reported height/weight values. But again, none of this really matters because it’s not how health policy is shaped. Simple rules and procedures are desired.
@Unanon
If you think of the dosage as “vaccine per bone marrow”, then if you give a constant amount of vaccine, a smaller body receives a higher dose.
Phil’s smaller friend would need to have a smaller amount of vaccine injected to receive the same dosage per marrow; but he received the same amount as Phil, therefore his dosage was higher.
A scale, a tape measure and a chart are less of a “burden” than severe side effects, IF the side effects depend on the amount injected, and not on innate characteristics of the immune response.
As an analogy, if you have a big industrial fire, the amount of fire trucks doesn’t depend on the size of the fire, but on the number of fire trucks the local fire department can muster.
Mendel, thanks, I accidentally skipped over “the relative size of two separate people who each got the same dose in mg…” Sorry for misreading, Daniel.
It’s not very clear what the incremental advantage of using a much more complicated dosing scheme would be compared to a simpler rule, such as “individuals under the age of 12 should receive a fraction of an adult dose” where the fraction is established through clinical trials as the minimum dose that elicits the desired protective effect for the particular age group. I agree, in general, that depending on the disease, risk (and severity) of adverse events from the disease, vaccine, and risk (and severity) of side effects of the vaccine, that dosing requirements may need to be different based on some set of patient characteristics. However, vaccines need to be administered at a population-level, under many conditions, sites, and personnel. I doubt dose needs to be “optimized” to the mL. It’s just not how this stuff works in practice, when vaccines are administered en masse at drive-thrus, sports stadiums, underdeveloped countries, and by folks who haven’t entered a single digit in a calculator in 20 years.
In terms of planning/manufacturing, there are advantages to simpler rules in terms of determining available doses/supply, knowing “how much left” is in a given bottle, etc. Logistical simplicity shouldn’t come at a tradeoff of public health, but if vaccines yielded severe-enough side effects, they wouldn’t be approved to begin with.
Not saying I have a particular opinion, and I certainly have no relevant expertise. But some questions.
So maybe don’t let the perfect be the enemy of the better (continuous dosing based on some criterion) – but I also wonder whether, given how immune systems change as we age, shouldn’t dosage to some significant degree be dependant on age? Would we really give a 12 year old with a given estimated body/bone marrow mass the same dose as a 25 year-old with that same estimated body/bone marrow mass and as an 80 year old with that same body/bone narrow mass? Or are you necessarily including, along with the criterion of bone marrow mass, factoring in average changes in bone marrow (mass) as people age?
Having seen technicians at work with mass distributions of COVID vaccines, I wonder if it’s easy to underestimate the difficulty of allocating supplies appropriately if the dosages vary by individual. Or maybe it would all average out?
Measuring weight in public spaces like pharmacies would probably materially contribute to vaccine hesitancy, particularly among those most at risk (people with obesity). Self-report would certainly manifest in error because of social desirability bias, although maybe even with those errors it would still be in the balloark and might be an improvement?
Unanon. Every 12-13 year old child I know of lost between a day and 2 days with rather severe side effects from the Pfizer vax (fevers, chills, bedridden, some had vomiting, etc). Multiply that by maybe 10 million or so and you’ve got a pretty serious overall burden. I haven’t done the math, but I’d guess a 12 year old got about 3x the dose that Phil did on the basis of my proposed scaling. (If I remember correctly using my scaling proposal I came up with 10ug for a 10 year old…)
Plus it stretches the dosing pretty dramatically, allowing MUCH wider spread vaccination esp in second and third world countries.
I can’t see how it would hurt to at least scale by age for the range 0-18 years, where both height and weight change dramatically. Using the CDC height and weight tables for age and sex you could simply create a table of doses by *age* using my proposed scaling for the median height/weight for age, ask someone what their age is and pull the dose to the nearest 0.05 ml (they’re giving 0.3 ml to adults)
Also per your comments about the full regulatory process and perverse incentives. I’m not proposing to license drugs entirely based on some back of the envelopes… but I do think that taking a licensed drug and permitting it under an EUA in a new population 5-11 years old in a dynamic pandemic in which 5-11 year olds are being severely harmed should take less than 1 month and be based on a very targeted study with ~ 200 people not a 6 month study with 40000.
Joshua, regarding your questions about other factors that might be involved in scaling. I absolutely think that’s true. But note that we’re currently giving the same number of micrograms to 12 year olds boys as 50 year old athletic men (Phil). Simply scaling the dose with bone marrow mass in the range 0-20 year olds would undoubtedly have dramatically reduced the rather intense side effects experienced by every 12-13 year old I know of.
Your proposal for age related scaling is also very good. It corresponds for example to the “high dose flu shots” given to people over 65 because their immune system activity level is lower. I don’t think there’s a simple formula we can come up with based on things like weight, height. You’d probably need to scale by the replication rate of hematopoetic stem cells or something this is the kind of thing that should be investigated in the trials and in basic biology labs, but don’t seem to be investigated. If the trials were designed around explicit scaling instead of fixed microgram doses then we would have more information about such things. The regulatory bodies should be able to make extrapolations and interpolations with a body of data, rather than insist that everyone get the same constant number of micrograms, (or 10,20,30 and pick the best).
Daniel, I disagree. I don’t think a month-long study of 200 5-12 y.o. is remotely close enough to the size or time needed for EUA approval of a *vaccine*. This type of study size may be adequate for other regulatory frameworks, such as a 510k (substantial equivalence for a medical device). Biologics are a **different beast altogether.** I’m not sure how much experience you have directly interacting with FDA or their processes, but there is a lot to consider beyond an optimization formula with dubious benefits but clear burden.
If you are changing dosage as function of clinical parameters, you need to establish efficacy estimates for each bucket. You need to establish safety estimates for each bucket. If dosage decreases to a certain amount, one would wonder whether there is enough material to elicit an immune response at all, and the length and degree of the protective effect. You need to validate your proposed dosing regime won’t get screwed up in the real world. For population-level health interventions, people need to think less like chefs and more like McDonalds. Complexity creep is a real thing and there are many ways requiring both a height and weight could be viewed as a large obstacle to get people vaccinated.
Regarding your point about Pfizer: it’s perhaps worth noting that dosage for Pfizer is 30ug and Moderna is 100ug. I haven’t looked, but based on your hypothesis, there should be substantial safety differences across the 2 vaccines as a function of height and weight (or age as a very loose proxy, I guess). Is this the case? [This is a good faith question!] Maybe there’s something there.
This is a Bayesian blog, here we generally strongly disagree with the idea that every “bucket” is a brand new study. Prior information here is ENORMOUS. We have BILLIONS of doses already given. We have all the information on two separate large studies for 12+ year olds (the 12-16 yo group and the 16+ group). Because they gave 30ug constant mass dose across this entire range, they gave *a wide range of dimensionless doses* we can *already* from existing information do the calculation on dimensionless dose vs side effects and vs peak antibody response (or even antibody concentration curve through time).
Of course I went to clinicaltrials.gov and looked for the data but Pfizer simply says they’ll send you the data if you’re a “qualified researcher” which means good luck. I can’t do the regression myself, but if it had been there I would already have the plot for you.
But it’s absolutely the case we as a society **already** have the information needed to understand whether scaling by bone marrow mass “works” in 12-80 year olds. The assertion that you “need to do each bucket” is an assertion that basic biology has a “boundary layer” at 12 years old (ie. a rapid change in behavior). That’s simply not true. Again because of literally centuries of experience.
Given the enormous prior information here we easily can do the required validation in a study of 200 kids spread between 5-11. The 12+ group can provide the regression on antibody curve vs dimensionless dose, and in 200 additional kids the validation of the extrapolation of that regression to the range 5-11 could easily have been done. Of course, maybe we’d see major differences, in which case yes, you’d need a followup with at least several hundred or thousand more. But there’s no way to justify from a Bayesian Decision Theory perspective the choice to do 40000+ kids over 6 months. Of course Frequentist study design dominates the industry! but that’s not a good thing!
Daniel, it’s not usually considered valid (in FDA’s POV) to extrapolate a hypothetical model to a new group (for a biologic or vaccine) and do a half-baked verification study with the new group to demonstrate the model works. It’s not even considered a valid approach for diagnostics (different oversight, typically studies require reduced burden on part of the manufacturer). I’ve actually proposed various modeling approaches to FDA to extend products’ intended use populations and they won’t bite. Sorry! They don’t really care! “Collect a representative, robust data set in the new intended use population that is adequately powered to…, yadda yadda yadda.”
Get as haughty and condescending to complete strangers online as you want, and be as proud of your neat but not-so-original thoughts as you want! The idea this is a Bayesian blog is not relevant to how clinical trial data are evaluated by FDA. I’d talk to others that actually interact with FDA on a regular basis.
Why not put in a request to Pfizer to get access to their clinical data? https://www.pfizer.com/science/clinical-trials/trial-data-and-results/data-requests
You’ve misinterpreted my point. This is *also* a political science blog. My point is that the FDA is WRONG here, and this is a political issue where we need to change the way the FDA works, not that the scientists at the drug companies are wrong. I’m not trying to be “haughty” I’m saying that *scientifically* there is no reason to run 30-40k person studies, and that this means the regulators are doing unethical things in the name of NHST style pseudo-science.
Let’s turn it around… Suppose for the last several months one school bus every day on average had run off the road and crashed after a wheel had fallen off, hospitalizing 300 children. Suppose it’s always bus type C (for COVID). Suppose there’s a type of bus that has been running for a decade that doesn’t do this, but it doesn’t have yellow paint, the little extending signs, and doesn’t have a history of being driven by school bus drivers, it’s only got a history of being driven by municipal bus drivers on routes adults primarily ride. How many months would we allow the NTSB to run a “Randomized trial” where we recruit bus drivers to drive either the old type C bus or the new type V bus (for vaccine) before they declared that the type C bus could be allowed to be taken off the market and replaced by the type V bus?
I assume the answer would not be that we’d need to run a randomized controlled trial of 10,000 buses for 6 months before allowing the type V bus to be rolled out to replace the type C bus, while in the mean time 55,000 children were hospitalized.
Let’s take that one even a little further. We’ve ALREADY purchased the type V buses, they’re sitting in a bunch of parking lots, all ready for kids to board up, their cost was $500 each ($10/rider), and in addition to their better safety record, all the kids who ride on them get a lower noise, more comfortable ride with air conditioning and it reduces total emissions into the environment (ie. it improves the quality of life for everyone). They do have occasional bad side effects, such as kids snag their backpacks on the door and trip and break their wrist, but it happens about 1/50 as often as in the type C bus.
Excess adipose tissue suppresses the immune system, especially the innate immune system. This accounts partially for the higher COVID mortality in the obese. Your skinny friends may be having stronger vaccine reactions because they are mounting a more robust immune response, rather than because the dose/kg is higher.
Nick, I’ve never met him in person but my impression is Phil is tall skinny and athletic: https://www.creekcats.com/pnprice/Phil/Home.html
I doubt adiposity is suppressing his immune system.
Phil said,
“Everyone I know who had a bad reaction weighs less than 150 pounds. Maybe that’s a coincidence but it did make me wonder if this is a dose-response thing. Does it really make sense for me and my wife to both get the same dose, given that I weigh something like 40% more than she does? I can understand that they may not want the people administering the vaccines to pull out the ol’ calculator, but it seems like they could have, say, three doses for under 150 lbs, 150-220 lbs, more than 220 lbs. Or something. Maybe it doesn’t make much difference and I’m hypothesizing based on noise, but even in absence of data I would be surprised if the optimal dose for a 250-pound man is also optimal for a 130-pound woman.”,
and Daniel said,
“Phil, not sure if you saw it but above I argued for scaling by the mass of the bone marrow, which I argued was rho * height * (body mass/rho)^(2/3) this is based on the idea that the strength of the immune response is related to the total number of immune cells you could muster. Assume 30 micrograms is “perfect” for an 18 year old male, and look on the CDC growth charts… Do the math yourself and compare you to your 150lb friend who had the bad reaction, see what the dimensionless dose difference is” — but earlier the discussion was about 12-13 year olds.
Well, I’m a woman in my late 70’s, and my height and weight are in the range of 12-13 year olds. So I appreciate Phil’s bringing in discussion of things like “Perhaps the scaling should be based on brain weight, for example. Or perhaps metabolic rate. Or perhaps the weight of the liver. ” I think some of these things do need to be taken into account for old (and maybe also younger) folks. Indeed, I recently read that statins are not effective for women, and for people with small body frames. (I fit into both categories).
Wow, I’m pretty sure I saw Phil hit a car with his bike 4 years ago between Cordonices Park and the Rose Garden. Small world.
Codornices was my favorite park as a kid. Played a lot of robin hood games in the woods and went down that slide a million times.
Ha, funny to see some discussion of my personal characteristics has somehow gotten into this!
I’m 56 years old, a bit over 6’3″ tall, and about 193 pounds. By contemporary American standards this makes me lean, although in an earlier age (or in, say, Scandinavia) it’s pretty typical I think. I’m in the “normal” range according to BMI. I guess it’s worth noting that I weigh about ten pounds more than I did when I was most physically active and physically fittest, and I assure you those extra ten pounds are not muscle.
‘somebody’, I have been on my bike in and around Berkeley almost every day for the past 29 years, except when I’ve been out of town, and I’ve had very-low-speed contact with cars about half a dozen times. But I am pretty sure none of those times have been on Euclid near the Rose Garden, or on any of the nearby blocks. If that ever happened it was many years ago and I’ve forgotten about it. Musta been somebody else. Still, if you recognize me on the bike (or elsewhere) flag me down, it would be nice to meet you.
General comment about how to handle vaccine doses: I think small/large or small/medium/large is the way to go. The best is the enemy of the good. Let’s just do better than we are doing right now.
I think small/medium/large is probably right, I’d even say extra-small/small/medium/large (remember we’re talking say 2 year olds to full sized adults). You still need to figure out who goes in what bin. I’d argue that the underlying calculation should be related to height * mass^(2/3) for reasons I mentioned elsewhere. I believe this could be done with the CDC growth charts for children to decide on the age breaks. They’d probably be something like 2-8, 8-11, 11-15, and then everyone else is “adult” for adults could probably be done with height and weight… just a grid of height and weights with two colors (medium or large). Self reported would be fine.
I’m not saying we need everyone to use a calculator, I think discretizing makes good sense for simplicity, but the current default is far too coarse, because it can easily represent a range of 3-4x differences in dimensionless dose (say for a 12 year old boy vs Phil both getting 30ug)
For simplicity it seems like 8, 16, 24, and 32 ug would likely cover the range, be easy to measure, and ensure that dimensionless dose was never very far from 1.0 times the “optimal”.
Daniel, I get the feeling that you don’t have the data to support this, that you haven’t asked the people who might gave that data, and that you can’t prove that the reduced dose will still provide immunity.
That’s right. This is entirely speculation on my part because when I went to the clinical trials.gov website I discovered that there is no open data, what there is is an empty promise to give data to “qualified researchers” in the past every time I’ve requested data from one of those empty promises I’ve been ignored. That’s about 4-5 times so far. If someone wants to try to get the data from gatekeepers, I’m happy to run a model on it. But there’s a reason we shouldn’t accept empty promises as “open data”. Open data is data uploaded to a public site for anyone to download. Imho all clinical trials for regulatory purposes should be open data.
All this is is a description of a model, and an analysis plan more or less.
“letting doctors or nurses near a calculator might be dangerous. ”
Might?
jim –
> Might?
I’m trying to figure out how I feel about that comment. I mean I get it’s a joke, obviously. Maybe I need to get a sense of humor.
But my primary reaction is that it seems incredibly condescending. My guess is that most doctors and nurses are able to use a calculator to calculate a ratio liKe BMI, and perhaps your joke is based on an obnoxious, statistician-snobbery that looks down on the skills of healthcare providers.
Or maybe it’s just a valid comment on the real lack of functional math skills in our society.
It’s probably a little bit of both. But Pfizer could easily publish an app for use by providers to enter weight/height/age and whatever else is needed and then it outputs a number of ml to draw. For places that can’t do apps (maybe west africa for example) you could easily have a 4 paper printed tables, one for kids, one for adults, and split by male/female.
We are talking about BILLIONS of people having their lives SUBSTANTIALLY improved, even if you only cut the soreness, tiredness, vomiting and other short term side effects by 1/2 and even if you only stretch the use of the vials to 2x as many people (which is likely).
U have and ask Daniel too.
Daniel, why do you think children were said not to be at risk last year but now they appear to be at a much higher risk?
This was predicted by some last year but I haven’t seen any consensus on it.
Damn, *”I have an…”
I think children have been at risk the whole time, but largely protected by being kept home from school. Delta may be somewhat worse for them, it does have higher viral loads for example. But the main thing is we’re now giving kids the damn disease whereas we could have vaxxed them.
Just because a risk is “relatively low” in say 10 year olds compared to say 60 year olds, doesn’t mean we shouldn’t give 10 year olds a vaccine that has a low cost, and divides their risk by 10.
I see. There is also the loss of exposure to other coronaviruses due to various measures like keeping them out of school:
https://www.science.org/doi/full/10.1126/science.abe1107
Also viral interference, exposure to one virus triggers an interferon response that primes your cells to defend against general viral infection for a couple weeks to a month.
Sars2 has a method of blocking it when it infects the cell, but nearby cells can be warned before infection if another virus is active.
Daniel –
That’s interesting, but my question was different than the one you answered.
I’m wondering if the severity of a COVID infection matters in terms of the chances of getting myocarditis from COVID.
Seems to me it’s fundamentally important t0 assess the chances of myocarditis as a result of a vaccination against (1) the background rate and (2) the chances of getting it from COVID. As such, I’m wondering if the chances of getting it from COVID depends at all on the severity of the infection.
Also, maybe not all myocarditis is equal, and if you get it from a vaccination maybe it’s less of a concern than if you get it from other causes?
as with everything, dose matters. So yes I’d assume that from severe COVID is both more likely and more severe than with mild COVID. Also with a vaccine it seems to be self-limiting, almost everyone recovers after either monitoring or mild treatment for a day or 3. With myocarditis from an infection it’s not at all controlled, it just depends on how intensely the virus spreads within your body and such. So I’d expect myocarditis from infection to be worse and represent a wider range of problems than from well controlled administered vaccine doses.
Andrew: I bet the FDA won’t approve the Pfizer booster application today.
It looked like they signaled their intentions Wednesday.
I believe that you’re right (but not “I bet”).
But I’d rather you weren’t!
I was right, but then the advisory committee turned around and endorsed it, not just for those over 65, but for anyone at high risk for “occupational” exposure–the exposure being at any level. I think they were largely trying to support Marion Gruber while still giving the White House what it wanted. I listened to the last 3 hrs, to see how they operate.
“…how they operate.”
Like this: “Kvilischevskii ate raw cranberries and tried not to wince. He thought everyone would say, ‘what strength of character!’ (but no one said anything at all)”
For those interested in the dimensionless dosing discussion. This mornings news is that Pfizer is choosing the 10ug dose for 5-11 year olds. This means if you’re 11 years and 8 months old you’ll get 10ug and if yesterday was your 12 year birthday you’ll get 30ug. My 11 year old boy is substantially bigger both taller and weight wise than the 12 year old sister of one of his soccer team members. Yet the soccer sister is vaxxed and had a horrible few days afterwards, and my son is not, and will probably have far fewer side effects.
https://www.washingtonpost.com/health/2021/09/20/covid-vaccine-for-children/
The idea that you can hold dose constant in micrograms over the range 12 to adult is irresponsible, and produced a lot of side effects as a result. The DEFAULT for ALL dosing should be to investigate it in dimensionless terms and then make concessions to practicality such as perhaps having 4 fixed doses and a chart to put people into the right category.
Doing otherwise is to ignore science, which tells us that *ALL* phenomena are the result ONLY of dimensionless quantities.
https://en.wikipedia.org/wiki/Buckingham_%CF%80_theorem
If you were injecting kids at whatever dose you’d like, would you inject an average sized 12 year old with significantly less than the standard dose?
If I were somehow in charge, what I would do today is get the data for 12-18 year olds, get their height and weight, and look at peak antibody levels as a fraction of median antibody levels of naturally infected patients as a function of dimensionless dose measured as mass injected / (rho * h * (body mass/rho)^(2/3)). I’d run also a regression on prevalence of various side effects as a logistic regression on dimensionless dose.
With that information, and a utility model based on antibody levels, and side effects, I’d choose an “optimal” dimensionless dose to maximize expected utility, and then calculate which of 4 different fixed ug values to give to each age as a chart by age. Probably 8,16,24,32 ug fixed values. choose the closest to the optimal dose for each age.
My intuition and some back of the envelopes tells me that 12yo would likely get 16ug, 5yo would get 8, maybe 15yo would get 24, and 18+ would get the 32. Some women and small men would get 24.
I’d also probably by default use a 3rd exposure after a couple months. It’s well understood that repeated exposures produce better more robust immunity in other vaccines. I’d also reanalyze the Moderns trials using the same technique and redesign dosing there as well.
Since kids already have low risk, it’s very likely that side effect mitigation built into the optimization strategy might make it so the 8ug dose would be used up towards 15 years old
I suspect the dosing issue is more complex than you have implied in your comment. Based on what I have read the vaccine is absorbed locally and expressed within cells in the immediate region around the site of injection. The antigen produced is then processed by resident cells of the immune system to provide the antigens that elicit the immune response. Initiating an immune response would seem to be a threshold type response where a minimum level of antigen presented over time is required and increasing the dose beyond that would not enhance the response much. If that is what is happening, then the dose required is not likely to differ that much based on body size, but may be different based on stage of development.
It would be interesting to hear if these issues have been studied in detail. I have not heard of much work studying the details of vaccination, but have not looked either. Does anyone have any input on this? I would be very interested.
As someone who has been on allergy shots for 4-5 years I can assure you that immune response is very responsive to dose. It’s not a threshold type thing at all. If .25ml of serum produces a noteable welt, .35ml of serum might well produce anaphalaxis
Dropped about 40k per day on 7-day average in the 20 days since 500k a week by Oct. 1 was declared a “near certainty.” But only needs to drop another 50k or so in the next week to reach that level.
Looks like it might be close, but already seems to me we can pretty much dismiss the “near certainty” claim. I don’t understand statistics but it seems to me that no matter how the bet gets settled, if it’s anywhere close it wasn’t a “near certainty.”
We can also see that only a handful of forecasts in the ensemble predicted the numbers dropping as fast as they did.
Making an “ensemble” out of all the models failed because obviously a lot of them were high for some reasons that might be correlated.
I’ve never understood the logic of ensembles of models that (potentially) include very different parameters. Suppose one model includes a critical parameter that none of the rest include. What is the value of averaging that model worth other models?
Meanwhile… The rate of decline in cases continues to accelerate. Looking even more like it might be close. Both parties to the her may be sweating a bit.
Which, while it suggests the “near certain” characterization was just wrong, also suggests that most of the models are still not very skillful (since the result may well fall outside a “most likely” range of the ensemble). It would be interesting to know whether there is some shared characteristic of the models that were more accurate.
Cases have already dropped to ~60% of where they were in the “South” (even more along the gulf coast, “South” includes 16 states, including ones like Delaware) because the unbearable heat ended so people are opening windows and going outside. That is what is driving this. The other regions are also starting to drop as well but this won’t last once it gets unbearably cold:
https://i.postimg.cc/7Zw4TP20/926cases.png
There are some other things going on such as California “probable cases” now getting counted, but that should only inflate the number by around 5k per week.
Andrew might not mind if I move this response over here. Hopefully, hell let us know.
> Overall, I don’t think it is particularly controversial to say prior to July 2021, more NY residents were infected with COVID than FL residents.
It’s not controversial beciswe it’s not even close to being correct.
Prior to July 2021, Florida had more infections per capita identified, with far fewer tests per capita conducted.
I’ll use the wayback machine to dig out Worldometers from that period if necessary but you can easily verify that you were wrong about that.
Apologies. NY slightly more cases per capita with far more tests.
https://web.archive.org/web/20210701164836/https://www.worldometers.info/coronavirus/country/us/
Wikipedia has a separate article on the Covid-19 pandemic in each state, with a tabular timeline that gives me the required data at a glance.
New York suffered from a harsh first wave without warning; it was the state worst hit while the US was still badly prepared for dealing with the pandemic, with hospital capacity running low. If you exclude that first wave, and compare July 1st 2020 to 1/7/2021, or from October 1st if we want to exclude Florida’s first wave as well, New York comes out on top both times, and by a considerable margin in terms of deaths (in a situation where testing is insufficient, deaths is a more accurate measure of the prevalence of the pandemic).
I’m glad you brought this up because this is a mistake I see quite frequently.
Namely, blindly aggregating and comparing the cumulative COVID numbers without taking the woeful lack of testing during the first wave into account.
~5/31/2020
NY
374k cases
30k deaths
2.0M tests
FL
55k cases
2.7k deaths
1.0M tests
Test positivity: NY 18.4% vs. FL 5.3%
Case Fatality Rate: NY 8.1% vs. FL 4.9%
6/1/2020~6/30/2021
NY
1.7M cases
23k deaths
56.7M tests
FL
2.3M cases
36k deaths
30.0M tests
Test positivity: NY 3.1% vs. FL 7.6%
Case Fatality Rate: NY 1.3% vs. FL 1.6%
Up to mid-April 2020 in NY, 14-day positivity rate was ~40%.
People who contact COVID and not test positive has always been and will keep being a problem.
But the magnitude of the issue was on a different level back then.
I completely concur with Mendel: “in a situation where testing is insufficient, deaths is a more accurate measure of the prevalence of the pandemic.”
Official death rates by themselves suggest NY had more infections.
Then you need to additionally consider
A) Florida has an older population, so given a similar level of infection, you would expect higher fatality in Florida
and
B) excess deaths unexplained by COVID is sizable for NY in the first wave.
But ballparking it…
I think that the differential in testing if you compare NY and Florida tracks pretty well with the differential in death rates, once you mix in (1) overall and even recently Florida has tested far less, (2) DeSantis officially advocated for a policy of testing only the symptomatic – which decrease the ratio of positive identified cases to actual infections and, (3) treatment has improved significantly, and vaccines have been administered by the boatload, from the early days – meaning a lower ratio of deaths to infections during the period when Florida has been recording both at very high levels compared to NY.
I’m not saying that testing is a great metric. Far from it. But for all the criticism if testing as a metricnposirice I’m Cases identified has still tracked pretty well (from a bird’s eye view at least), with hospitalizations, icy admissions, and deaths throughout the pandemic all over the world. Particularly if you make an adjustment to the ratio to account for the impact of vaccines (but it still isn’t large enough to decouple the metrics).
ICUs are often kept pretty cold, but “icy admissions” was meant to be ICU admissions.
Fred –
> ) Florida has an older population, so given a similar level of infection, you would expect higher fatality in Florida
Throughout the pandemic people have cherry-picked confounding variables and that looks like a case in point.
There are a number of predictors that would have suggested significantly less mortality relative to infections in Florida. Age stratification is indeed, hugely important but even that needs to be evaluated in perspective such as how much people learned about preventing deaths in long-term care facilities.
So it looks like it might not be as close as I recently thought once all the numbers are in.
Regardless, I think we can fairly reject the “near certain” designation at this point, no?
Keep in mind the week for the bet starts today. But I must agree. The south, in particular the gulf coast, has done its part but not the rest of the US. I’m not sure it will even hit 500k at all anymore since the winter wave seems to be starting already.
Anoneuoid –
Ah, I thought the period of the bet was ending on the Oct. 1. Makes your case a bit more less out of line with the results – but looking at the numbers more closely recently I’ve been surprised by how much the numbers are filled in over an extended period. I knew that was the case in Florida and knew that aspect of Florida’s data would materially affect the national data – but I didn’t realize how much of a lag there is in case data nationally.
Joshua:
Win or lose, a bet can help us focus on tricky issues of measurement that might otherwise get ignored in discussions of data.
Andrew –
Speaking of tricky issues of measurement…
I know that that suggesting the IFR is greater than 0.3 is a soshlist plot… but if my math is right (a big caveat) it seems to me that with greater than 700k dead we’re well over a 70% population infection rate.
Adding infection- and vaccine-induced immunity we’ve blown past the “herd immunity threshold” and I’m thinking we’ve all been made immune from infection more than 1.5 times.
Well, either that or a lot of people have died more than once?
It took me a while to figure out what you were trying to say, but I think it’s that 700e3/320e6 = .0022 so even if everyone in the country has had COVID the IFR is at least 0.2%
and the truth is probably about 20-25% of people in the country have had COVID so the IFR is really something like .008 to .01
OK, I’m terrible at math, but it seems to me…
I left off my % with that 0.3 (should have beem 0.3%).
So with over 700k dead, and an IFR of 0.3%, that would mean over 240k or 70% of the population would have to have been infected.
So you take that 70% of the population that has infection-induced immunity and add that to 50% of the country that has been vaccinated (let’s assume that there is still some protection against infection dispite breakthrough infections because of that whole IM injections don’t confer mucosal immunity thingy), and we’d basically have to have a pretty low R value – effectively crossing over a “herd immunity threshold.)
My guess is that IFR is higher than 0.3%, (and Ioannidis was wrong again)
At a 0.3% IFR, Mississippi would have an 110% population infection rate and in Peru… Wow.
Obviously the IFR is going to vary by region but unless I got the math wrong (Ioannidis is certainly smarter than i am) an aggregated 0.3% seems implausibly low to me – especially since many more will die despite vaccinations.
240 million not 240k.
That’s right, IFR averaged across those infected in the US so far has to be around 0.6-1.0% or so. Clearly higher than 0.3%
To be clear, the datapoint of interest is the “Reported” New cases (black dot, black trendline) for October 1st, as reported 1.5 weeks from Oct 1st (say, Oct 12th) to account for delayed reporting (or other reporting issues), right? https://www.cdc.gov/coronavirus/2019-ncov/science/forecasting/forecasts-cases.html
https://statmodeling.stat.columbia.edu/2021/09/02/there-are-no-equal-opportunity-infectors-epidemiological-modelers-must-rethink-our-approach-to-inequality-in-infection-risk/#comment-2022856
Seems to define the actual bet… it’s that the total cases between Sept 29 and Oct 5 are above/below 500k as determined by the reported value for that week as reported some time later so all the reporting lag is out of the way (so let’s say what’s reported on Oct 13 or so, I don’t think that was really finalized)
I think it’s fine to think national cases will be [x] in a few months, but the general issue I have is the comical degree of certainty some people attach to their ideas and opinions, oftentimes absurdly backed by “100s of years of basic science!” Ok, so if you’re wrong, do we get to say you’ve misunderstood 100s of years of basic science? (Probably not.) It’s sort of like the smart fellow on here who was a proponent of a lottery system for vaccinations and, maybe because of that, thought it would take a couple of good programmers a few days to roll out a national lottery system for vaccinations. My buddy at Apple thinks that claim was a bit overconfident! I guess that’s one thing I really appreciate about some of the senior posters here–they aren’t afraid to say something to the effect of, “Well, I don’t know! But here’s an idea…” or “Well, I don’t know, but a colleague of mine with expertise in the field thinks…”
Sounds like my proposal. I really do think a website that took your name, age, and some click box health status questions and output a QR code and a priority number that you could print out and take with you to a line would have taken very little time to implement. Another static web page that said “now serving X” updated once a day say on a per-state basis… It didn’t have to be complicated, the QR code generator could be a static page with some javascript, the “now serving” page could be static with a cache lifetime of 12 hours. Basically pay a programmer to write two static web pages and a person in each state to increment the now serving each night…
I’ll also say that I was absolutely right when I posted on Jan 22 to Facebook while everyone was scrambling to try to get a vaxx, that in a few months we’d be BEGGING people to take them.
In any case, you do realize that saying that you “appreciate” that I will spout off nonsense like that is just asking for more ;-)
Also one of my favorite things about this blog is that it’s a great place to spout off some half baked ideas because smart people will push back. Carlos Ungil has more than once showed me I was missing something important for example. So has Christian Hennig.
Anoneuoid –
4 days in, we’re at 431,000.
Is it too late for me to jump in on the bet?
I’ll even give you better odds. Let’s say over 500k or over you’ll pay me $99. Under 500k I’ll pay you $35.
Deal? 😉
So it is pretty clear I’m losing this bet. Unless there is something the severely reduces testing, final cases for the week ending next Tues will be around 700-750k per week. That is about halfway in between the median CDC prediction and my prediction.
The bet was motivated by the presence of seasonality in these waves, in particular that if it is very cold/hot/humid then people spend more time indoors breathing HVAC recycled air which spreads aerosolized virus. Basically when the temperature is around 65-70 F and relative humidity between 40-60%, people will open the windows and go outside much more often.
Starting to do a post-mortem on this we see that the south behaved as I expected as the summer cooled into fall. Cases did indeed drop by ~50% there. Meanwhile the west kind of did (~25% drop), but not the more northern states:
https://i.ibb.co/k2YSdty/covid-10-2.png
I found some state-wise monthly avg temperatures as of Aug 2021 here (NB: Alaska data was a separate download from there and for some reason the NOAA ignores Hawaii, which had % drop of 66.7%): https://www.ncdc.noaa.gov/cag/statewide/mapping
If you download the data there is also data from last year. So I plotted the avg temperature by state (for this Aug and last year Aug-Oct) vs the percentage change in covid cases by state we saw during the course of the bet (Sept-21):
https://i.ibb.co/NZLNYpT/tempvscovid.png
As you can see, there is an exceptional correlation between the average temperature and change in covid cases. I did not expect it would be this good, since average monthly temperature averaged over an entire state is a pretty weak proxy for what we really want. Ideally there would be data on something like: total volume of recycled air inspired by everyone in the state for the last week of August-21 compared to first week of October-21.
For comparison, here is what happened last month vs vaccination rates (according to what I got from the mayo clinic vaccine tracker today):
https://i.ibb.co/HYDpRYK/vaxvscases.png
It is pretty much flat.
Anoneuoid –
> Starting to do a post-mortem on this we see that the south behaved as I expected
I’m skeptical given, that you were completely off in your understanding of the death rate in Florida – which was by far the biggest contributor to the death rate. Even after you were given the reason for your error, you still seem to have way undercounted.
Seems to me the most parsimonious explanation for why, not only was your predicted number not “near certain” but not even particularly close, is that you significantly overestimated the impact of seasonality.
I encourage people to be skeptical of everything I say. That is a good thing to me.
I feel there are some really fundamental differences for the reasons we post here, and you simply have no mental model for someone trying to get at the truth rather than convince people of some agenda. But please do not respond to that either since its unproductive.
Anoneuoid –
> I feel there are some really fundamental differences for the reasons we post here, and you simply have no mental model for someone trying to get at the truth rather than convince people of some agenda.
You’ve made it clear that you have an “agenda.” You’ve said or than once that other analysts have “ignored” seasonality. You can’t even know that. But let’s be charitable and what you really mean is that you think they have underestimated the effect of seasonality.
And on that stated basis you made a statement about a “near certainty.”
But you were flat out wrong. So your premise was flawed. And yet you conducted an analysis that you say proved you were absolutely right.
Again, you didn’t even know the correct count in Florida. Not only did you not know it, you believed in a trend that was highly implausible. I’d say based on your willingness to fit the data to your “agenda” of seasonality.
It doesn’t make you a bad person. It suggests that you’re just as human and the people that YOU regularly accuse iof having an agenda (without actually having sufficient evidence to support that assertion).
Anoneuoid –
Also. This statement also suggestes an “agenda” to me.
> That is about halfway in between the median CDC prediction and my prediction.
You’re comparing your “near certainty” to the median of the CDC prediction.
So you aren’t comparing your median to their median. You’re comparing the near extreme range of your confidence interval to their median.
We all have agendas. We all want to be right. We’re all subject to cognitive biases that lead us to confirm that we’re right andiss where we’re wrong.
Whenever I see someone donning a cloak of agenda-free, pure science, I get extremely skeptical. All the more so when that same person regularly accuses hordes of others of having agendas at the drop of a hat (meaning often when they lack the evidence basis to support that claim).
Anoneuoid –
FWIW,this paper suggests you might want to add “air drying capacity” and UV into your look at the “seasonality” of COVID
https://agupubs.onlinelibrary.wiley.com/doi/10.1029/2021GH000413
@ Phil
Do you want your winnings, or do a double or nothing about what happens this winter? How do you want to do this?