Andy Garland Timm writes:
My package for working with Type S/M errors in hypothesis testing, ‘retrodesign’, is now up on CRAN. It builds on the code provided by Gelman and Carlin (2014) with functions for calculating type S/M errors across a variety of effect sizes as suggested for design analysis in the paper, a function for visualizing the errors, and implements Lu et al.’s (2018) closed form solution for type M error, which is a nice speed boost. You can find the vignette online here, which goes into more detail about its functionality. Next on my to-do list for the package are tools for working with these errors in regression more easily.
If you want a visual for people, this little example of type S/M error with simulated N(.5,1) data could be good (Is including images often still a thing bloggers care about?):
Here, the dotted line is the true effect size, and the full lines are where the statistic becomes statistically significantly different from 0, given our standard error of 1. The grayed out points aren’t statistically significant, the squares are type M errors, and the triangles are type S errors.
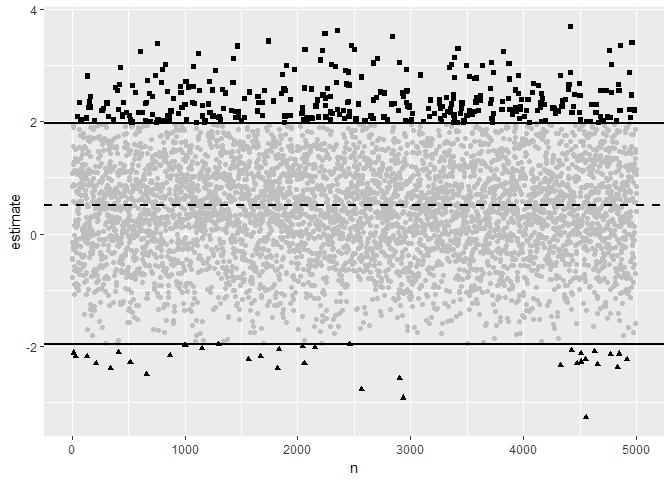
wouldn’t the full lines converge on the true effect size with increasing n?
I think N here is replication of the “experiment” rather than size of the sample.
The idea is you have an experiment that uses a sample size that produces a standard error of 1. And you have a mean value calculated from your sample. The “data points” here are as if they were that mean value. The “true mean” is 0.5 but the standard error of the mean is 1… so you put your statistical significance filter on this and you get the dark black results if you repeat the experiment 5000 times.
It shows that *conditional on using statistical significance to decide whether a ‘real effect’ is there* you are either massively overestimating the effect (type M, dark squares near the top) or you aren’t even estimating the effect in the right direction, *and* in this case the magnitude is silly too… (type S, dark triangles at the bottom).
Basically conditional on using statistical significance… you are getting the very wrong answer.
That makes sense. Thank you for the explanation!
I am quite happy to see this, as I’ve recently become fascinated by the Type-S/M analyses. In fact, I sent an email to Professor Gelman a little over a week ago asking about instances “in the wild” that would be good examples to work through. I believe there may be a blog post in the future. Fingers crossed. However, as long as this is a topic for blog discussion I might as well ask here about the requirement that it be conditioned on using statistical significance. Here is my question, and I’d appreciate feedback from anyone who wants to comment:
Would apply this methodology in cases where there was technically no statistical significance. I’m thinking primarily of these two cases:
(a) There was no alpha value chosen before the study, and the authors weren’t testing a p-value against an alpha, but just reporting a p-value (such as 0.06) and deciding that it was sufficiently small to conclude that there was likely an effect and worth further experimentation/investigation. (Fisher-ian?)
(b) There was an alpha value chosen (0.05), and the t-test didn’t reject the null because the p-value was, say, 0.08. However, in addition to this NHST analysis, the authors generated a Bayes Factor of 2.0 and claimed this showed that a difference between the two groups was twice as likely as having no difference between groups, and, therefore, conclude a difference in groups exists.
Letter (a) is a decent description of the type of analyses that I often do (mostly DOEs), since I don’t use alpha-thresholds unless required by a third party.
Letter (b) is (basically) something from a paper that I’m analyzing, and it would be great if I could estimate the Type-S/M errors without violating any statistical laws.
In the Beyond Power Calculations paper, it does say:
“If the result is not statistically significant, the chance of the estimate having the wrong sign is 49% (not shown in the Appendix; this is the probability of a Type S error conditional on nonsignificance)—so that the direction of the estimate gives almost no information on the sign of the true effect.”
…so I do have hope that the methods are generally applicable to nonsignificant results as well.
Well, you can tighten those lines up to any p value you like, not just 0.025 and 0.975, and then you’ll see ever more points being black… I think that handles your case a) it just instead of being “conditional on p < 0.05” it’s now “conditional on p = my_p_value_here”
as for b) you can do this one using just the p=0.08 and see what you get, conditioning on the Bayes Factor in some sort of general way doesn’t help you much because it’s highly model dependent so there’s nothing generic to say there.
Daniel,
The problem with Bayes factors (and variations thereof) is that they are quite dependent on priors. IMNSHO, they may be useful when one has a credible set of prior information (such as a meta-analysis of prior results) ; when this is missing, a Bayes factor can get almost any value by selecting the convenient prior. This applies also to the “weakly informative” priors, the “researcher degree of freedom” being here the enxtend to which said researcher whishes to be “weakly” informative…
Aki Vekhtari’s position of comparing models by estimating their out-of-sample predictive behaviors is (partially) a way out of this conudrum… but answers a different question.
Daniel, thanks for the feedback. On point (a), then, couldn’t the same logic apply to using the observed p-values in the Kanazawa and Durante examples from the paper? The p-values for those two examples were 0.015 and 0.035. Why use the selected alpha value instead of the observed p-values for calculating Type-S and Type-M error rates? I’ve played around with it a bit, and it doesn’t seem to make a substantial difference, but I’m just trying to understand when it would and would not be appropriate to move from the alpha (if there is one) to the observed p-value.
For (b), yeah, I wasn’t thinking of conditioning on the Bayes Factor. It was more of using an example from a scientific paper where the authors didn’t reject the null for their chosen alpha (0.05), yet had another line of statistical reasoning to conclude that they demonstrated a real effect.
I just find it so interesting how the smaller the p-value, the greater the Type-M error, given the same other inputs. I realize it’s because in order to get the smaller p-value the observed effect has to be further away from the externally estimated effect size, but I still find it fascinating.
Michigan:
From the Bayesian perspective, the right thing to do is to condition on data. If there’s only one sufficient statistic, then all data summaries are equivalent, so you can condition on the z-score or the p-value or whatever. When I did those analyses conditioning on “p less than 0.05,” that’s because I was evaluating the frequency properties of claims made with confidence using standard methods.
Ah, thank you.
So, if I am interested in evaluating one particular study from the past, it makes sense for me to take the Bayesian perspective and condition on the data (such as the p-value from the study) rather than looking at frequency properties, yes?
I’m thinking of this as being analogous to confidence intervals vs credible intervals. Only credible intervals can give me information about a particular result that I’ve obtained from the data, since confidence intervals speak to the characteristics of the procedure but don’t technically tell me anything about what has happened after I’ve collected the data.
Would that be a not-too-shabby understanding?
Much better to build your own model of the science and condition on the dataset rather than condition on a p vslue.
Daniel, right, but in the case where I don’t have the data and only have access to summary statistics, how would you answer my previous question about looking at a past study and the confidence/credible intervals parallel?
Suppose you have some data summaries and some prior information about parameter sizes, then you can build a Bayesian model of the process using your prior, generate prior predictive data, run inference of the type used in the paper, and determine the simulated ratio between the paper methods estimates and the underlying generated parameter, then see what the distribution of this ratio is in cases where the summary stats are similar to ones from the paper
For people interested in reproducibility of findings and applications of S and M type errors to DOE the paper in https://papers.ssrn.com/sol3/papers.cfm?abstract_id=3035070 might be of interest.
The basic idea is that findings should be presented with alternatives, some with the same meaning, some in ways that appear similar but carry a different meaning. Tis sets a boundary of meaning (BOM).
An example of a findings is: “When I increase X, Y will also increase”. An alternative is to show this with a graph. All this is based on semiotic representations and meaning reusable learning object (MERLO) used in educational psychology.
To evaluate the BOM one can apply an S type errors. i.e. I make the above claim, and I am wrong, Y decreases. The paper refers to an application of the JMP software for doing it.
I don’t like the idea of “boundary”, because who decides where the boundary lies? However the basic idea of distinguishing between explanations with a certain result is sound: https://en.wikipedia.org/wiki/Experimentum_crucis