About Jon Zelner

Assistant Professor of Epidemiology at the University of Michigan School of Public Health. Interested in infectious disease, inequality and other fun stuff like that.

Calling all epidemiology-ish methodology-ish folks!

I just wanted to share that my department, Epidemiology at the University of Michigan School of Public Health, has just opened up a search for a tenure-track Assistant Professor position.

We are looking in particular for folks who are pushing forward innovative epidemiological methodology, from causal inference and infectious disease transmission modeling to the ever-expanding world of “-omics”.

We’ll be reviewing applications starting October 12th; don’t hesitate to reach out to me ([email protected]) or the search committee ([email protected]) if you have any questions!

Also – you can find the posting here.

What is spatial epidemiology, anyway?

Every time I talk or teach about spatial epidemiology, I find myself confronted with the difficulty of defining what it is. More specifically, I have a hard time defining what my version of it is, why I do research in this area, teach about it, and just think about it a lot of the time. I also worry that students who came for maps, GIS, fancy statistical models, and all that good stuff will be a bit disappointed when they get my version, which has some of that but is also more eclectic and navel-gazey.

Sometimes, I think about changing the name of the class to something like “relational epidemiology”, “spatial and contextual epidemiology” or just health geography – but I’m not a geographer and I’m not totally sure what health geography is, either.

At the end of the day, spatial epidemiology is interesting and important to me because it is relational in nature. Maybe this just reflects the way my brain has been poisoned by training in the social sciences and infectious disease dynamics, which are all about relationships and interpersonal dependence. But if we called it relational epidemiology, what would the most important relationships be?

  • Relationships between individuals, e.g. in a classic social network.
  • Relationships between people and the environment, i.e. climate change and other types of human-driven ecological change.
  • Relationships between areas of the physical environment, e.g. dispersal of dust and other pollutants through the air, movement of bacterial and viral pathogens via water sources.
  • Hierarchical relationships between social units, i.e. neighborhoods within cities.
  • Within-individual change over time, e.g. the progression of chronic illness, natural aging.

This defines the problem space for what I think of as being the super-group of “relational epidemiology” topics. Then we have a set of ideas or approaches that act as useful frames through which to view these ideas: Spatial analysis clearly falls under this heading, but so do network analysis, time-series analyses, non-spatial hierarchical models, individual-based models, and on and on. These also touch on other well-established fields like ecology, social epidemiology, environmental health, sociology, economics, political science, and on and on.

Making Choices

One of the early lectures in my online spatial epidemiology course is titled “Making maps means making choices”. I like this one because it gives me the opportunity to feel smart by reiterating a point that has been made many times before: Spatial approaches to public health are powerful because they are decidedly non-neutral. Maps have the pleasing appearance of something settled and clear, but we know they obscure more than they show. A disease map includes the information on risk and relationships we want to highlight. The stuff that is left out is implicitly understood to be less important than what is left in. This makes it just like any other model, statistical, mathematical or otherwise.

I guess this is why I keep calling the class spatial epidemiology rather than something more expansive that could allay some of the mildly guilty feeling I get about teaching a version of this class that is heavier on ‘spatial thinking’ (whatever that is) than ‘spatial methods’. (Honestly I’m not even sure what exactly belongs in that set or doesn’t – but that’s for another day).

When I say it’s a course about spatial epidemiology, to me that ultimately means that space is the starting point rather than the destination. In other words, if we put things on a map or estimate a model of the distances between individuals with different attributes or outcomes, then we have to ask why the patterns we see are the way they are. We get to tangle with all the wooly questions about relationships and interdependence, but we start from a place that most people grok on at least some level.

This can be done as effectively through other lenses: social network analysis, ethnography, agent-based modeling and others. But to me the reason space is particularly powerful for building a relational perspective in epidemiology and public health is that you can put anything on a map: Everything that is within the concern of public health can be pinned down to some location on a map. Whether or not that location is meaningful is another question, but at least it gives us some place to start.

Ok, so what?

I don’t know – up here in Michigan we’re on spring break (it’s above freezing!), and I’m taking a few minutes to think about why I do the things that I do. But more than that, spatial analysis feels like one more slippery set of tools or concepts among the ones I care about. Asking why I care about spatial epidemiology is not that different from asking why I think Bayesian statistics, transmission models, hierarchical analysis, and many other things that sound kind of well-defined but aren’t are good and important things other people should care about.

Teaching about these things, but also publishing on them and writing grants to get people to pay for the work, forces us to articulate what they are all about. But it might be helpful sometimes to zoom out and admit to ourselves and everyone else that these are all fuzzy concepts, more like a question we have to continually ask and answer rather than one that has a fixed meaning.

And maybe you already knew that – but I wrote this to remind myself for the next time I forget.

(Thanks to Krzysztof Sakrejda and Joey Dickens for ideas & feedback! h/t to Justin Lessler et al. for their great paper “What is a hotspot anyway?” that got me thinking about this.)
“There are no equal opportunity infectors”

Flow diagram of relationships between dimensions of social inequality and infection risk.
Just a few of the ways social inequality drives infectious disease transmission, severe outcomes, and death.

We (myself along with Nina Masters, Ramya Naraharisetti, Merlin Chowkwanyun, Sanyu Mojola and Ryan Malosh) just put out a mildly polemical paper in PLOS Computational Biology titled “There are no equal opportunity infectors: Epidemiological modelers must rethink our approach to inequality in infection risk”. The paper came out of a lot of discussion between all of the authors about why the broad majority of infectious disease transmission models have not typically treated equity – the distribution of who gets infected as a function of wealth, race/ethnicity, gender, and on – as a first-class concern alongside population-level patterns of incidence and mortality.

The reasons for this disconnect are likely at least partially historical: Transmission modeling arose out of theoretical ecology and population biology, and for a long time evolved on its own track somewhat independent of key subfields of epidemiology, and social epidemiology in particular. In the realm of HIV and STI transmission modeling, where the mapping between social and sexual networks and infection risk is more widely appreciated, inequality has long been a prominent concern. And for chronic infections like Tuberculosis, the long-established link between poverty, social disadvantage and disease has been impossible to ignore and is also reflected in the models used to look at TB transmission.

For acute infections – like SARS-CoV-2, but also influenza, RSV, and others – a tacit assumption that highly-infectious respiratory infections are essentially “equal opportunity infectors” that don’t care about lines of class, race, income and other distinctions, may have biased the modeling toolkit away from explicitly including the mechanisms that generate inequity in infection outcomes in the models that we use to represent transmission.

So, this paper is our attempt to close the gap a bit and to begin the process of building a bridge between the mechanistic inferences and whiz-bang tools of infectious disease transmission modeling and the critical insights into inequity and hierarchical approach of social epidemiology. We are not the first to highlight this gap and make suggestions about how it should be closed: Dolores Acevedo-Garcia’s excellent paper “Residential segregation and the epidemiology of infectious diseases” is a mainstay of basically all of my teaching and cited in almost all of my papers for a reason (If you want to play around with a model that puts some of the mechanisms in this paper into action, check out this Shiny app I put together awhile back). But our hope is to plot an actionable agenda for how to tackle these difficult problems going forward.

If you want to hear more but don’t want to read the paper for some reason – or if you just can’t get enough – check out this video of me giving a talk about this idea at the MIDAS Conference to Increase Diversity in Mathematical Modeling last month:

What I learned from teaching online

Or: How I learned to stop worrying and just plan my teaching and writing

Much has been written about the downsides of online education in the covid era. This can lead one to the common – but largely false – conclusion that all online education represents a poor substitute for its in-person counterpart. Of course, most of the kinds of pandemic-related online learning that happened in 2020-21 and now will play at least a temporary role in 2022, were *ad hoc* in nature and came about in response to the impracticalities of putting a bunch of people together in a room during the pandemic.

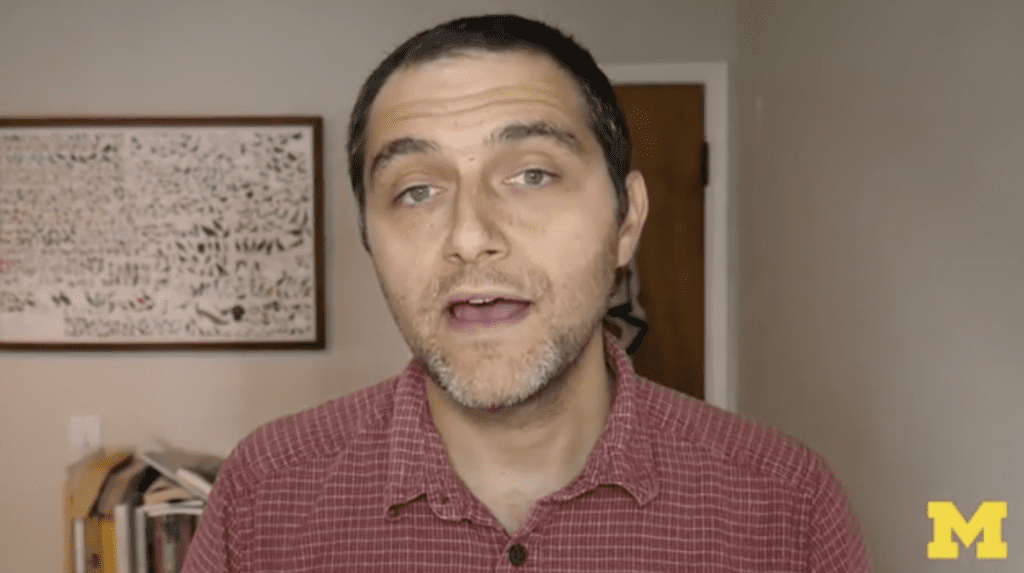
However, by total coincidence, I was slated to develop a course on Spatial Epidemiology for the new-ish online MPH program at Michigan during the Fall of 2020. It didn’t quite go off with a hitch, and the process of putting it together was oftentimes quite torturous for pandemic-related reasons: You can see me below, looking bleary-eyed and exhausted in front of a very messy bookshelf in my home office. This was during what was likely the 5th or 6th attempt at recording a video that was repeatedly interrupted by my dog barking or one of my kids busting through the door behind me.

Me in front of a messy bookshelf while recording lectures in the early days of COVID-19

Backwards Design

But the very structured nature of the online course taught me a few things about not only how to structure my classes – in-person and otherwise – but also about how to think about writing up research papers and other forms of documentation in a more-structured way. Because a well-produced online course is a team effort involving graphic designers and video editors in addition to the instructor, more planning is required than in the one-man-band version of course design I was previously used to.

Notice I said required rather than necessary, because this experience has made me re-consider the ‘forward’ approach to course development and writing I have typically followed. (Full disclosure: My partner – Sarah Zelner – is a pedagogical consultant at UM, so credit for any of my ideas about this also belongs to her.) The forward approach to course development is to come up with a list of specific content you want to cover, string it together into a series of class sessions, craft assignments that sort of align with that content, and go ahead and teach the class.

Many great classes have – and will continue to be – taught this way. I have personally taught what I felt like were effective graduate and undergraduate courses over the years which were developed and taught in this seat-of-the-pants fashion. But in every class, there has been something – or a bunch of things – that felt out of place. Often, it was a book or set of articles that I knew we interesting and important, but that didn’t quite link up with the other content in the class. Or it was an assignment that was engaging and exciting, but didn’t necessarily allow students to extend and demonstrate their competency in things I had been ostensibly teaching them. Those things felt not-right, but my only solution to them was to keep bashing away, iterating readings and assignments one semester at a time, trying with limited success to work out the kinks.

My online experience working with course designers at UM introduced me to the ‘backwards’ approach to course design: This involves starting by defining the overall learning goals of the course, using that to guide the assessments and in-class activities, and then using that to figure out what should happen during the class meetings. This made it easier to see how the pieces should fit together, which content was extraneous, what needed more time, etc. In other words: if you thought about why you were doing what you were doing before you did it, it might make more sense to everyone!

Enter ‘backwards paper writing’

Then, along with my colleagues Ella August and Kelly Broen at UM, I began to wonder if this approach could also help with the process of scientific writing. Ultimately, a paper is a pedagogical document where we explain what we did as clearly as possible, justify why we did what we did, and argue for the importance or relevance of the whole thing. Despite the fact that the sections of a paper have clearly-defined reasons for being that are right there in their names – Introduction, Methods, Data, Discussion – I often find myself writing ‘forwards’ rather than backwards.

Rather than thinking about what I want to accomplish with the overall paper from a scientific or professional perspective, I typically find myself bashing through the sections roughly in order and then editing to make them cohere. But what if some of that ‘backwards’ magic could work in scientific writing?

Well, all of this is a long-winded way of saying we think it can, and the product of it is this new paper in Patterns called “A guide to backwards paper-writing for the data sciences”. In it, we provide a set of ideas about how to make sure that the goals in writing are well-defined in advance so that they percolate through all of the sections of the paper.

It was a nice opportunity to think on the page and shouldn’t be taken as definitive in any way, but instead to act as the beginning of a conversation about how we can make the procerss of paper-writing more focused, more effective, and possibly even somewhat enjoyable. Excited to see what people make of this and whether the ideas in here translate out of our small corner of the world!


What can we learn from COVID burnout?

Burnout has become a central theme of the COVID-19 pandemic, impacting essentially everyone in different ways, from those who were, and continue to be subject to endless, stressful ‘essential work.’ to those in the relatively privileged position of being trapped at home for more than a year. While there is a pretty clear, clinical-ish definition of burnout from an occupational or psychological perspective, it’s important to attend to the different potential types of burnout and their implications for what we should be doing with our lives, careers. In this post, I want to take the opportunity to think about what can and should be learned from the experience of being ‘burned out’ as a working quantitative epidemiologist.

For many of us working in public health – or I’ll at least speak for myself – this experience has been destabilizing because it has shaken our faith in the meaningfulness of what we do, even as it has also become a painfully relevant and routine part of everyone’s lives. This is a moment where epidemiological data are presented as frequently and casually as the weather. But it’s also a time in which epidemiological models have often been wrong, where our tools and techniques have been drawn into intense and politicized scrutiny, and as individuals we have become characters in the never-ending culture wars.

While before the pandemic, we might have been sometimes too confident in our ideas, models, and authority, many of us – again, I’ll speak for myself – are now working through a sort of crisis of confidence. Some of it just comes from the exhaustion of confronting an enormous crisis and being continually reminded of how difficult it is to make a meaningful impact on large-scale outcomes. This exhaustion will likely pass, and when it does, we need to focus on the very real needs to change, innovate, and respond more effectively to future crises that have been illuminated by the crisis.

The following three issues have – and continue to – dog me as I try to figure out what to do next. I don’t claim to have come up with all – if any – of these ideas, but instead have found them to be among the more significant challenges I’m wrestling with as we stare into the murky post-crisis future:

  1. We are political actors whether or not we like it or want to be. This point is now so obvious and trite that it belongs alongside “all models are wrong” in the COVID-19 rhetorical hall of shame. But it is – I think – an existential question for those of us who work in this field. The limits of our ability to impact the covid crisis as individuals should turn our attention towards collective action in all its messy forms. We need to be able to think more broadly about ‘intervention’ than the action of the state or a quasi-governmental authority operating in a top-down fashion on populations. What this means pragmatically remains unclear to me, but I know that meaningful, sustained, and opinionated engagement with politics and social movements is the only path to long-term utility for the work we do. Otherwise, we can expect to see the same ‘shit rolls downhill’ pattern play out in the next crisis, as the benefits of the insights and innovations of public health and medicine are funnelled first to the wealthy and other privileged groups.
  2. Top-down approaches to interventions generally fail, infectious disease epidemiology policy is not an exception. We can easily mistake the ability to impose a well thought-out intervention cleanly on a simulation model to be a ground-truth, base-case from which deviations represent failures. The problem with this is that when the real world is more messy and dysfunctional than the idealized one we imagine, it is a short leap to blaming individuals and groups for not getting with the program as we imagined it. I sometimes think of this as analogous to a problem I have with my daughter in the winter: If she would get her boots and coat on quickly, we wouldn’t be late for school essentially every morning. I find her inability to move at the speed I want her to to be extremely frustrating, especially on a freezing Michigan morning when she needs to wear eight layers of clothes. But the tendency to dawdle is so central to her existence – and to being a four year-old – that there is no point in comparing our outcomes against those of an alternative universe in which she is an AM speed demon. And rather than asking why she can’t move more quickly, I should probably ask why I don’t start the process of getting ready sooner and make it a bit more fun for her? (But hey, I don’t want to think about that…)
  3. There are sharp limits to the tools of quantitative analysis in public health. Epidemiologists may have long prided ourselves on being one of the hard health sciences in much the same way that economists and other quantitative social scientists have long been held up as the rigorous thought-leaders of social inquiry as compared to their more-qualitative peers. But just as the faith in economic models was at least partially responsible for our collision with the financial iceberg of 2007, we should ask what role quantitative epidemiology may have played in worsening or slowing progress in this crisis, in addition to all the good it has done. For example: What was the potential impact of overly-optimistic transmission modeling projections earlier in the pandemic on the trajectory of infection and death? Is there a process for presenting modeling results and their uncertainty in a way that makes it harder to cherry-pick the most politically convenient ones? Should we be making public forecasts at all?

To me, these existential questions are frustrating and somewhat confounding, but they also reflect what is – I hope – a once-in-a-career opportunity to reassess the alignment between what I do and the impact I hope to have on the problems I want to address. While my insights are obviously specific to the realm of infectious disease epidemiology, I think they might carry over into the broader world of people who want to do good things – broadly construed – with the tools of the quantitiative sciences.