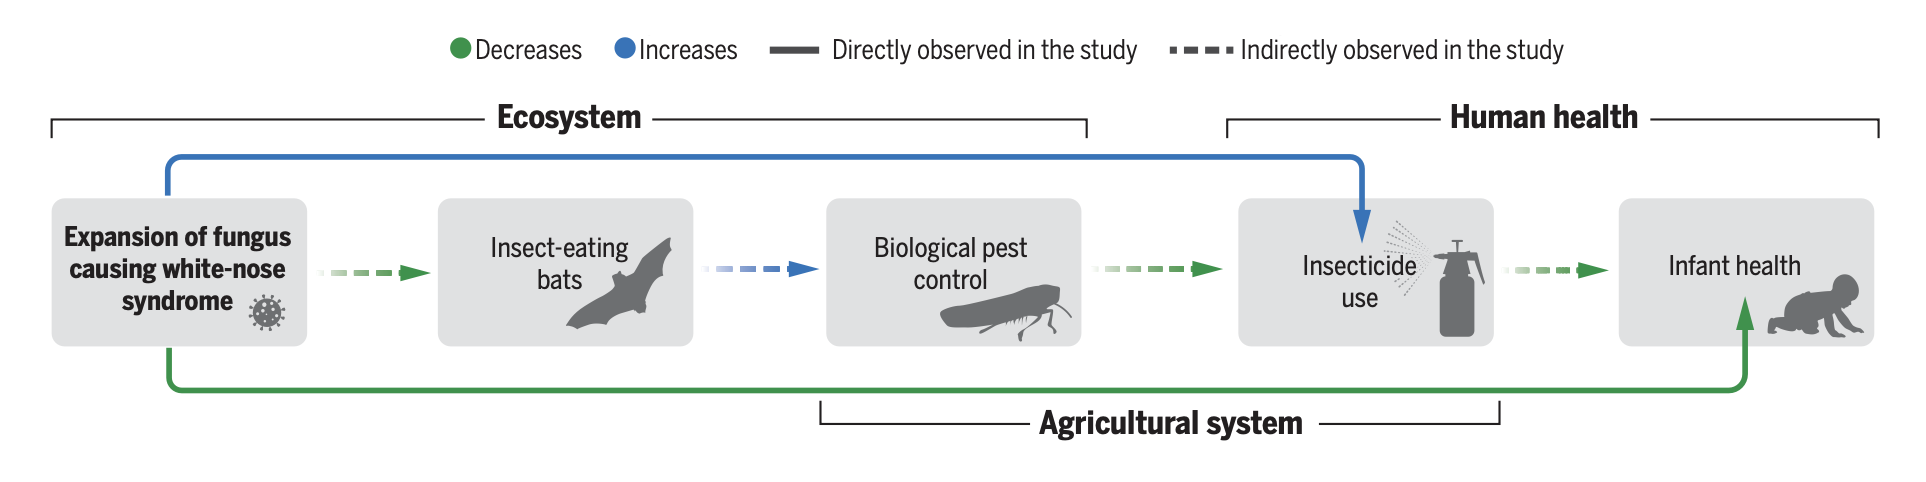
This post is by Lizzie. The Figure is take from Frank 2024.
I was in a meeting a little over a year ago in which I asked a student to define causal inference. The definition he gave me focused on complex approaches often used to try drag causality out of observational data. So I asked if causal inference involved experiments at all? “No,” came the reply. I double-checked. “No.” The student was certain. Someone else following up later did not change their mind.
Experiments cannot help with causal inference.
I knew we had a problem then, but how did it happen? I’ll tell you my version of what happened and some of what I can put together for how this happened, but I am open to other theories and ideas. And if perhaps the new ‘causal inference’ movement in ecology really has — finally — struck on a way for us to figure out ecology, then time will obviously prove me wrong, and you’re welcome to beat time to it in the comments section.
I could start back with Sewall Wright and the demes of cows I was once told he used to visit and Fisher and his fields of corn (or some agreeable consistent crop just waiting for its split plot design), but I will just start in the 1990s with path analysis in ecology. Path analysis (what I would call structural equation modeling with standardized coefficients) was hot in the 1990s in ecology. There was a chapter on it by Mitchell in the book ‘Design and Analysis of Ecological Experiments’ in 2001 (perhaps around its peak). It had this on the first page:
plant traits → visitation → pollination → reproduction
Isn’t that great? I could link plant traits to plant reproduction via those traits’ effects on (insect) visitation (to flowers) and how all that racey visiting led to pollination and then — reproduction (and then I might even make a run at … plant fitness!). I mean it is great. I like the idea. I liked the chapter. I did a path analysis. But I didn’t call it path analysis, I called it structural equation modeling because, by the time I was publishing, path analysis had hit some bumps.
Namely, everyone had done path analysis and many of those people had done it poorly in one way or another and suddenly all those little paths looked like a lot of made up stories with lots of little asterisks representing lots of significant p-values that didn’t really hold up to scrutiny. Shocker! (No, not shocker.) So, we all stopped doing path analysis and (within a few years it seems to me) we started doing structural equation modeling, sometimes with standardized coefficients. But we never called it path analysis again.
We couldn’t let go of path analysis because the dream was still alive. We wanted causality. We wanted to link things to explain how the world works. And manipulating plant traits is hard (have you ever tried to paint flowers different colors in a field? Or paste on tiny hairs (which we call trichomes)?), but measuring them is comparatively less hard. We wanted causality from observational data. That was the dream.
And, the dream is still alive. After all this time.
And the dreamers seem to have just discovered some of the basics of causal inference for observational data from the social sciences and econometrics literatures. With this, they have discovered that diversity (more species) in grasslands leads to lower productivity, not higher (Dee et al. 2023) and linked white nose syndrome in bats to increased infant mortality across the eastern US (Frank 2024). This latter paper is the one that rattled me because I attended a discussion group with colleagues and found out how many of my colleagues are excited by these ‘new techniques’ and how they have learned from them the amazing power of fixed effects for finding causality and the dangers of random effects to lead us astray.
Huh? Fixed effects to save the day and random effects of doom?
I tracked some of this down to me thinking of the common ecology definition of fixed versus random (I think some closer to definition #2, page 245 of Gelman and Hill: “2. Effects are fixed if they are interesting in themselves or random if there is interest in the underlying population. Searle, Casella, and McCulloch (1992, section 1.4) explore this distinction in depth.”) whereas the ‘new’ methods in ecology are using (I believe) definition # 5 (“5. Fixed effects are estimated using least squares (or, more generally, maximum likelihood) and random effects are estimated with shrinkage (“linear unbiased prediction” in the terminology of Robinson, 1991). This definition is standard in the multilevel modeling literature (see, for example, Snijders and Bosker, 1999, section 4.2) and in econometrics….”).
This explains some of the interesting lines I found in these papers, including:
Random effects account for clustering in data via the error structure of the model (Bolker et al. 2009; Gelman and Hill 2006), rather than estimating cluster means as part of the data generating process of a model (i.e., via fixed effect for each cluster’s mean, using the terminology of the mixed models literature). (Byrnes & Dee 2025)
The time-varying site attributes (μ_{st}) are also modeled in a fully flexible way that allows a year- specific effect for each site (in the estimation, an indicator for each year is interacted with an indicator for each site). (Dee et al. 2023)
I think the authors of this new Tower of Babel for ecology have also defined random and mixed effects to mean only ever linear models with lmer-style partial pooling on intercepts (never slopes I presume?) with fixed effects on slopes (back to definition #2). They even go so far as to refer to this as the “Common Design in Ecology” (they also capitalize Ecology and Ecologists in Byrnes & Dee 2025, which I find odd — is this high German? Personally, as an ecologist, I don’t think I need an capital letter) and explain:
Without more variable transformations, the multi-level modeling approach does not easily lend itself to controlling for as many unobservable sources of confounding as can be done in our linear, additive, fixed-effects panel data estimator. (Dee et al. 2023, in supp)
I thought about calling this post ‘The Tower of Babeling Causality’ or ‘The Problem with Statistical Terminology,’ but the real problem is not how lost in the weeds of words we get in with terminology. It’s partly how easily ecologists do want ‘new’ terms and approaches that will solve everything. The authors who have come armed with econometrics panel data approaches and instrument variable analysis (when most ecologists don’t know what is an instrument in their experiments) had the ground laid for them by all the ecologists who are enthralled by ‘random effects.’ I agree we have too many people trained to believe that chucking enough categorical covariates (site, plot, year …) on the intercept of a simple linear model will save the day. It’s a problem how much we sway from this being correct statistics to that being correct statistics. And how quickly think a new approach will change everything in ecology. We seem to quickly learn — and re-learn — that bad stats can easily lead you astray, but never take on that good statistics alone will not save you.
To be clear, I don’t have a giant problem with these methods. I have a problem with how they are presented as saviors (and somewhat how they are presented as new, but perhaps we need the ‘new’ and ‘savior’ angle to follow Grace) but I have a bigger problem in how rapidly they are being taken up. I fear the next 10 years I will live in a sea of piranhas where lots of ecological problems explain 5-10% of infant mortality and plant productivity.
And that’s the other problem — the bigger one: how much people want this causality. They want to believe that we have the data and methods to show that a disease that wipes out bats leads to an 8% increase in infant mortality. Of course we should want causality, we’re scientists, but the drive for causality seems to jettison a lot of the stuff we also need as scientists, especially estimates of uncertainty and the ability to leave room for uncertainty so that we search out better methods and better answers. I don’t know if bat decline has increased infant mortality 8% (though I highly doubt that number given the language of the author and how ‘outrageous’ he thinks it is that he is expected to share all his data for people to believe his claims). I just know we have managed to do science before and make progress and it wasn’t because we got better statistical methods or memorized a glossary of one particular set of people’s definitions of DAGs and fixed effects.
I am cited in one of these papers for old work I did where I compared shifts in the timing of flowering and leafout with warming over time (due to anthropogenic climate change and natural variation) and experimental warming (due to infrared heaters or teeny tiny plastic greenhouses — also, hello instruments in ecological experiments!). Estimates from experimental and observational data were different — the effect of warming in observational data was bigger. I did lots of different statistical analyses to figure this out, I even did something probably close to the ‘Common Design in Ecology’ (although the authors don’t seem to ding me for this) and the effect never went away. With Ailene Ettinger and other colleagues, I eventually got all new data and found the same thing using slightly different statistics. But that wasn’t why we got all the new data, we got it to test hypotheses about what drove the difference. And we found out that it appeared to be two things: warming experiments dry out soils which delays leafout and flowering and warming experiments over-report their warming (so their per degree estimates look smaller than they should).
I did all of this without ever invoking the term ‘causal inference.’ And that’s what really worries me for trainees today; that ‘causal inference’ will now mean a narrow branch of amazing ‘fully-flexible’ completely un-confounded statistics. We’re ecologists; we actually can manipulate some stuff. And somehow we’re going so gaga for econometrics statistics to give us causality through time-invariant fixed effects (or whatever) that we have students who don’t know how experiments could relate to causal inference.
What’s the solution? If you ask me, be less gaga over any statistical method (and I do love my own statistical methods so I could practice a little more of what I preach) and teach everyone basic mathematical notation and basic biological models. Teach them that generative modeling doesn’t belong to any one part of statistics or to only fixed or random effects. Teach them to be able to write out a simple biological model and simulate data from it and then fit their statistical model to it. ‘Only connect!’ Connect the models you learn for ecological theory with those you learn in stats. (And maybe teach them about the long debate in conservation biology about Cassandra’s curse, but that is a topic for another post.)
It’s true that causal inference is trendy in ecology at the moment and that, perhaps under the pressure of novelty statements, some of the methodsy work that is published neglects to mention that some of that stuff is not particularly new. (But we are all familiar with that pressure I think?)
There are various groups of people that are trying to (re)introduce causal inference to ecologists. Some, like Dee et al., tend to carry over the jargon used in other fields which can be very alienating (perhaps that also serves the novelty goal…). But others, like Suchinta Arif (https://doi.org/10.1002/ecm.1554) do their preaching in familiar words.
To be fair to Dee and company, they have also done some work on the use of causal inference in an experimental context. (https://ecoevorxiv.org/repository/view/7123/) So it’s not on them if some people don’t see the relevance of causal inference in experiments and vice versa.
There are plenty of papers out there that, whether in a manipulative experiment or in a purely observational context, follow the kitchen sink approach when it comes to fitting a model to answer a research question. So I am not sure that we don’t need that kind of work. I just find Arif’s work far more helpful than anything else I’ve read on that topic recently.
I was surprised when I saw how many reviews on this topic had suddenly emerged in ecology. I don’t know what has caused the sudden glut. Obviously Grace had been developing this for years, and others are actually using the methods to answer questions rather than just representing methods from other areas for ecologists (e.g. https://onlinelibrary.wiley.com/doi/10.1111/ddi.13698).
I too would like to know. The latest fad has just ended?
I was trying to sneak in a reference to Grace in the post. He has lots of papers on effectively the same topics (e.g., https://esajournals.onlinelibrary.wiley.com/doi/10.1890/09-0464.1) now being touted as new and amazing, but he doesn’t push them as the hottest new thing, and he often invokes the connection to theory. I wonder if his papers also have more math written out (and this could make them less attractive to folks).
I read the recent Grace papers (despite him being a popularizer of SEMs) as pushing back against the causal inference (and instrumental) crowd as not being realistic for ecology and arguing that we can get at causality through more old fashioned, mostly non-statistical, thinking methods like experiments, models, and knowledge of systems.
Why is statistics a part of the natural sciences that every field has to use, but not master?
Why don’t every department either work with statisticians or have statistical support, similar to IT support?
PI: “I want to do this research. I have this data and these experiments. Find me the best statistical model and methodology to test it and find patters in it. Thank you.”
Stat: “Okay. Here is the Stan code for the model I made for you. Just put your data here and run it.”
Also, Peer review could use division of labor as well. If the statistics was done with statistician, peer review could be done with statisticians consulting as well. “We are not familiar with this Stan guy and this statistical method. Normally we would reject the paper if it’s not basic linear regression, but we consult this statistician.”
“To consult the statistician after an experiment is finished is often merely to ask him to conduct a post mortem examination. He can perhaps say what the experiment died of.”
R. A. Fisher
Angelos:
The only thing Fisher will be sure of is, if the experiment died of cancer, this wasn’t caused by smoking!
You made me snort my coffee.
I’m no statistician but I serve as statistical consultant on a few studies outside my own research. In my admittedly limited experience trying to seek advice from people in statistics departments, I found them to be often focussed on mathematical formalism while remaining blithely ignorant – even uninterested – in the nature of real data, its collection and peculiarities. This limited the scope for productive interaction. It would probably be best if each department hired a couple of quantitatively-skilled grads/postdocs trained in their own fields as long-term staff.
Testing:
I’ve seen statisticians give good advice, but I’ve also seen three bad things:
1. What you say, when the statistician tries to turn the applied problem into a math problem without caring about the context.
2. The attitude that applied problems are trivial, so the statistician just gives some sloppy advice without thinking.
3. The opposite problem, which is where the statistician asks lots of questions about the applied problem without engaging any statistical insight, just saying platitudes about random sampling or whatever.
I am a statistical consultant. I think there is a huge gap between what I learned from class and what is in the real world. Applied statistics means far more than merely running t-test or regression models on a data set from the real world. I think it is really difficult to be a really good applied statistician.
I have a little anecdote that perhaps illustrates testingthewaters’s point.
About twenty years ago I was added to a project that was already at the end of the planning stage; I was going to be the one to do the data analysis. The experiment involved providing different amounts of fresh air to office workers and seeing how their productivity changed. The control group would continue to get the same ventilation they had always gotten — actually this was not a fixed amount, it depended on outdoor temperature and humidity and some other factors, but anyway the controls would not be changed from the way the building had operated for years. The intervention group would get more ventilation; sometimes a lot more, sometimes just a bit more (and sometimes the same as the control group, just to check). Sometimes the amount of ventilation would vary from one day to the next, e.g. low-high-medium-low-high. But sometimes there would be a whole week when ventilation was high, and a whole week when it was low (i.e. normal). The test subjects were people in a health call center. Some of them basically just made appointments and other simple clerical stuff; the others were nurses and would provide some health advice, mostly just “you should go to the emergency room” or “you should take some aspirin and check your temperature in an hour, and go to urgent care if you are running a bad fever”, or things like that. The main metric for productivity was the average number of calls handled per hour, per staff member.
The project had a university statistician who was helping with the experimental design, and by the time I was brought onto the project it was already supposedly decided upon. I didn’t like it. The whole experiment seemed to depend on the idea that nothing would change during the multi-month project other than the ventilation rate. I pointed out that all of the full-week high ventilation periods were near the end of the study, and asked what happens if something happens that increases call times then, such as a bad flu season or something: you could imagine the nurses needing to spend longer on the phone to get symptom information, or getting fatigued by having call after call after call so they eventually can’t work as fast. Or maybe it could go the other way, there’s a relatively problem-free period when the size of the queue is short so the employees don’t feel the pressure to go fast. Or maybe something else. Basically I thought the experimental plan was rather naive. I raised these points and got a collective shrug from the rest of the team: nah, none of that is that big a deal, we can control for queue length if we have to, just carry on. So, OK, we carried on…and about halfway through the experiment, a new computer system was brought in that took about two weeks for the employees to get completely comfortable with, so for at least those couple of weeks the rate of handling calls went down substantially. Was the effect gone after two weeks? I don’t know and neither does anyone else. Plus, all the while there would be occasional tranches of new hires, who worked much slower than old hires, but they didn’t trickle in continuously during the period, they came in tranches of maybe two weeks or something, corresponding to the end of their training periods.
Taking all of that into account, the result was that the statistical power of the study was much, much lower than had been anticipated. It was still somewhat informative, maybe — at least we could rule out really large effects from increased ventilation, and the central estimate was in the expected direction (slightly more productive with lower indoor CO2 levels), but it was an unfortunate situation.
Which finally brings me around to testingthewaters’s comment. I think the university statistician who was advising on the project wasn’t any kind of expert on survey design, I think they just wanted a side hustle and maybe were the first to raise a hand when the principal investigator asked if anyone in the stats department was willing to give some advice. Their main work was on the theoretical side and I think they didn’t appreciate the extent to which real-world data collection is almost always much messier than the simple abstraction of the problem would lead you to believe. I was more puzzled by the fact that the senior experimenters also didn’t expect that there might be some big problems; perhaps this blind spot is related to the fact that they were not used to dealing with human subjects so there was a whole dimension of potential issues that they had never encountered before. Anyway my experience echoes testing’s: the academic statistician seemed ignorant about the difficulties inherent in a lot of real-world data (although, to be fair, so did the other investigators!)
It feels like it’d be obvious you should assign the amount of ventilation in a week randomly between some low allowable amount and some high allowable amount. If you were to do that, you’d be in the infinite length limit surely uncorrelated with anything, and in the finite sample of 10 or 15 weeks or whatever, low correlation with most real world conditions…
That would seem to be fairly obvious thing to do, so how did they actually assign the ventilation level? Was it systematically using some plan like ramp it up and then ramp it down and ramp it up again? or just “let’s try high, then low, then medium?” or what?
I’d also hope they consulted a building science consultant on that one. Air interchanges across the building envelope would be highly correlated with the tinkering with the mechanical supply. You can’t just say “hey I supplied more or less air from our mechanical system therefore that much more or less air actually was interchanged in the experimental group rooms over this time interval”.
Incidentally, this is a reason why retrofitting existing buildings with leaky facades (e.g. via interstitial sprayfoam) can often cause significant issues for existing HVAC systems. If the building relies on air interchanges across the envelope, and you suddenly cut that off, the mechanical systems are often not adequate to facilitate the required air interchange frequency.
Daniel, the university statistician came up with the plan, I don’t remember the details but as I recall the first few weeks had something that at least superficially looked like a random assignment of low-medium-high, and then the last half of the study had what looked like random assignment of weeks. But the study was only three months long or something — nowhere near long enough that you can assume you’re in the ‘infinite length’ limit, I think there were only two or maybe three high-ventilation weeks. Throw in the issue with the computer system switch and some seasonal variability and you can’t really trust that what you think is the signal is the signal. I mean, there was a control group, so that helps, but still.
AllanC the experiment was performed by building scientists, and the ventilation levels were confirmed by checking CO2 concentrations or maybe they even adjusted the air exchange rate based on CO2, I don’t recall,
The answer to your question, “Why don’t every department either work with statisticians or have statistical support, similar to IT support?”, is that everyone needs roughly the same thing from IT (a working computer and network), whereas everyone needs different things from statistical models.
As @testingthewaters says below, it’s not so easy to come in to an applied project as a statistician and help. Or I should say, it takes a lot of work to even understand the problem they’re trying to solve and the shape of their data. And like many customers in business, they often think they want you to do X, when they should really be doing Y (the last applied project I worked on with biologists, they showed up at my door and asked if I could help them fit an HMM to population data—we wound up fitting a first order ODE compartment model to individuals in the population). And they’ve often already monkeyed with the data in dangerous ways, like removing observations they consider to be “outliers” from the data (I convinced them to put them back in with the aforementioned study). When we were working with the UK government on Covid, we needed to understand what England, Wales, Scotland and Northern Ireland did differently to classify patients dying of Covid, we had to understand the differences between the Imperial and Oxford surveys of Covid, we had to understand UK parliamentary and local decision making to make the model at the right granularity, we had to understand basics of pharmacology and epidemiology like diagnostic testing, viral load, transmission, etc. It’s hard work, but rewarding.
In my opinion, Causal Inference is about inferring the accuracy of a model of the causality of a process.
We specify a model: A affects B and C, C affects D, D is also affected by E and F… etc. Preferably not just that there is an effect, but in the ideal circumstances **what is the dynamics of that effect**. Specifically how, through time, do changes in the causal variables cause changes to occur in the caused variables. The ideal model is a differential or finite difference equation, or a rule based equation for agents.
Once we have a hypothesized model, we can make predictions. We can observe the causal variables A(t), E(t), F(t) and soforth. And we can say if we know the unknown coefficients in the mathematical expression of the model q1,q2,q3… etc then we know that measurements of D(t) will be near to some prediction d(t,A,E,F,q1,q2,q3 etc)
Bayesian statistics can give us the most plausible q1,q2,q3
we may have multiple competing explanations, there might be a d2(t,A,E,F,r1,r2,r3…) which is an alternative explanation, or whatever. We can use Bayesian statistics to infer whether one of these does a better job than the other.
The role of experiment is to enable us to distinguish between different models d1,d2,d3 etc. We can look at the model and say “under certain circumstances if we were to change A from A1 to A2 then d1 predicts a very different outcome from d2” if these are possible conditions for us to set up, then we can set them up and do the experiment, changing A1 to A2 and seeing which of the models correctly predicts the observed dynamics. The role of experiment is then to intentionally amplify differences in outcomes so as to discriminate against different explanations.
However, if we have some naturally occurring conditions, under which A changes from A1 to A2 and the models predict very different outcomes, and one or the other is much closer to observed, this also does the same thing for us… it lets us discriminate between models.
The biggest problem comes, when we refuse to take risks, we refuse to let it be possible to be shown to be wrong, and we create models which could predict literally anything… then, we can’t distinguish between them, sure maybe d1 requires us to have coefficients q1,q2,q3 and d2 requires the coefficients to be r1,r2,r3 which are different numbers from q1,q2,q3 but in the end, both of them can be made to bend into the shape of the data…
now we have career protection… we can always say “yes we weren’t perfectly correct but no model is, our model simply needs to be set to r1,r2,r3 and it performs as well as their model”
And this can go on for decades. And we can teach our students to dodge the possibility of being wrong, and we can create whole fields where no-one takes a risk of being wrong, and nothing is learned.
Another serious possibility is that we refuse to consider *dynamics* and remove time from our equations. There is just observations at time T1 and observations at some other time T2. For example measure the smog days in May this year, apply some pollution controls to vehicles and measure the smog days in May 1 year later. Many trajectories are compatible with the dynamics, perhaps smog decreases then increases, or increases then decreases, or oscillates and then stabilizes, or oscillates stabilizes and then decays as the controls wear out… whatever. All we have is year 0 and year 1 at two particular timepoints we don’t know how to distinguish between different trajectories. Many times there is no thought to the trajectory, just the differences as if they were critically important.
In my opinion, you can’t effectively do causal science without thinking about dynamics, because all of causality is about at time 0 doing something and then that *causing* an alteration to the future trajectory of some other things… (or more generally, continuously doing some things and this continuously causing a trajectory to vary from what it would have been otherwise)
DAGs are the current hotness I guess, but they are specifically useful when trajectories look like quick-changes immediately after the causal variable has changed followed by settling at a new equilibrium. So then, it doesn’t matter exactly when your second timepoint is the outcome is nearly independent of the particular choice of time because the dynamics have come to a new equilibrium meaning they are near-constant. For example, we turn on the sprinklers, and then for hours afterwards the pavement is wet, so if we measure wetness at 10 mins, 20 mins, 60 mins, 200 mins… it doesn’t matter, they all show fully wet pavement. But of course, if we measure the pavement a week later, there will be no direct connection between sprinkler valve and pavement because pavement can easily dry in 6 hours say.
There are lots of processes that are much more dynamic than that, and many of them still don’t commonly employ models of dynamics.
Daniel:
This reminds me of my much-misunderstood post, “Causal” is like “error term”: it’s what we say when we’re not trying to model the process.
Indeed, I’d say the part you call causal inference isn’t the causal inference part. The causal inference part is where you have some number of plausible models of the causality and estimate it and try to distinguish between different possible causality models etc.
The part where you just want to know what in the particular case at hand was the size of the difference that you caused… that should have its own name, maybe “causal difference estimation”
This post perfectly captures my feeling lately in ecology!
I’m not sure quite how to fit this anecdote into this paradigm, but it seems relevant so I’ll put it here. Way back in the 1970s there were studies by…I’m going to guess it was the EPA, which had just been formed, but it might have been someone else (but I’m going to say it was the EPA)… trying to figure out if lead in gasoline was contributing to high lead levels in people, especially children, in whom lead interferes with brain formation. People had pretty high blood lead levels back then, especially near cities, and since lead was in gasoline (mostly as an anti-knock additive, but it also provided some lubrication) it make sense that lead in gasoline would be part of the problem, maybe even a big part. On the other hand, there was also a lot of lead paint, especially in old buildings (which made up a large proportion of housing in cities, and a lower proportion in newer suburbs) so it wasn’t necessarily obvious that lead in gasoline had to be the main issue. And lab experiments in which animals inhaled air with vaporized lead in it seemed to indicate that vaporized lead wasn’t a big deal: you breathe it in, and you breathe most of it right back out. When they modeled the effect of airborne lead, using those lab results, they concluded that it was a minor issue…which meant the main problem must be lead exposure from other sources.
But that was wrong, most of the lead in people was caused by lead in gasoline. The problem was, they had done the lab experiments with clean air with vaporized lead in it. If there’s dust in the air (or dust on the ground that later becomes airborne) the vaporized lead deposits on the dust. When you inhale dust, some of it sticks in your lungs or trachea, where a mucus layer is in constant motion bringing mucus to your esophagus where you eventually swallow it. Effectively, it was like eating tiny lead paint chips every day.
Without the right conceptual model they weren’t doing the right experiments, and without the right experimental data they weren’t ending up with a good causal model.
Thanks Phil! I have heard something like that before myself, and yeah not only is it a great example of why you want to be working on conceptual mechanism models, it’s also super relevant today to me given that now I live in a region that just burned to the ground in January and it polluted the area with lead from the vaporized lead paint, which is now attached to all the dust, etc… yikes
Great example of people implicitly applying Bayes rule. You can’t rule out leaded gasoline until there is a working explanation. It doesn’t matter how poorly it fits in an absolute sense.
But also, I didn’t find mention of this story. Instead it sounds like leaded gasoline is the very reason for the EPAs existence:
https://www.epa.gov/archive/epa/aboutepa/lead-poisoning-historical-perspective.html
I doubt the mentioned studies would stand up to much scrutiny. There is a clear bias in play here.
Daniel, could you elaborate on some points?
“Once we have a hypothesized model, we can make predictions.”
While this seems intuitive, this is typically not done in social science. Nobody makes predictions or even looks at model fit. Rather the estimate of some supposedly causal effect is justified by randomization or a DAG. There are some justifications. A good fit may not be causal but relying on spurious effects, for example. Still, I feel we lose a lot when not predicting outcomes. Maybe this is just too difficult? I believe this is what Paul Krugman says. A model clarifies our thinking, and that is the role of models in the social sciences, not to accurately predict some outcome.
“The biggest problem comes, when we refuse to take risks, we refuse to let it be possible to be shown to be wrong, and we create models which could predict literally anything… then, we can’t distinguish between them, sure maybe d1 requires us to have coefficients q1,q2,q3 and d2 requires the coefficients to be r1,r2,r3 which are different numbers from q1,q2,q3 but in the end, both of them can be made to bend into the shape of the data…”
This part I do not understand. You seem to be talking about theories (not models) that are extended whenever new data shows up. Like, oh yeah, yesterday my theory could not explain this, but look I just forgot to include gender/ age whatever and now my theory again explains the outcome. Is this what you mean?
Now I can make a simple linear model, maybe modeling the effect of years of education on later income. Since the model is linear, it can be wrong in many ways (when the true effect is non-linear). Does that make it a good model? I believe it does not. So I guess I see a contradiction between your goal to accurately predict and your goal of being wrong.
It’s important not necessarily to *be wrong* but to be *possible to be wrong*. That is, whatever your important core causal ideas are, they are expressed in such a way that their implications show up in the model and if the data is different from their implications, then you can discover that fact.
For example, I’m working with a collaborator on a model of internal migration in Germany. The information about how German citizens move between districts is public data. The movement data identifying the municipality flows (municipalities are sub-regions of districts) are not public, because of privacy concerns…
Nevertheless, the model is built on continuous or approximately continuous variables like distance, density, and the UTM coordinates of the center of the region, and the populations (which tend to measure in the many thousands to a couple millions so reasonable to model continuously). So if we were asked how may people move from some set of 12 municipalities which are spread over the border between two districts… to the 15 municipalities that are spread between the border of two other districts… our model has an opinion. A model built off “mixed effects” of districts which doesn’t really use distance or density or whatever can’t have an opinion, because it’s a model of the repeated sampling of random observed events (measured district level flows), not a model of unobserved causally connected events such as the movement between municipalities.
Our model is causal in the following sense. Suppose we have district A, and C in a line with each other each district very similar in size and demographics and soforth… Now we can choose one of the districts in between and call it B and build something there that is attractive. Our model says increasing distance causes lower flows. In the sense that if we choose B between A and C but closer to A then our model says more flows will come from A and fewer from C, if we had gone back in time and approved the building of the amenity at B2 which is closer to C, then the flows would have been smaller from A and larger from C. Indeed if we have municipality level data about the location where the amenity will be built, we can tell you even the expected effect of building in different municipalities within a district. Something that just isn’t about repeated sampling and linear mixed effects modeling.
It’s possible for our model to be wrong. We could look at various municipality data in a secure data processing center where the govt allows you to do some research on private data, and confirm or disconfirm the validity of our municipality level predictions. Since fixed effects models with fixed effects for the districts don’t have such capacity to predict municipality level, they simply could not do that.
I think you could pick any number of methods and complain about misuse in ecology in the context of trendiness and fashion (stepwise variable selection? Multimodel averaging? Occupancy-detection models?) Most of it seems to come down to a wish to make big statements from inadequate data, and not to confront the fundamental inferential purpose of any given exercise.
To expand on this, I suppose I mean that I dislike the title of this post: it seems a little unfair to use the word “desperation”. Sure, there are no doubt uses or takes on causal inference in ecology that are dubious, but to imply that the ongoing improvement in understanding and identifying inferential targets in ecology is, overall, “desperate”, seems equally desperate to this ecologist.
I am sorry you don’t like the title, but I think you missed my post on stepwise regression and multi-model averaging (https://statmodeling.stat.columbia.edu/2025/05/28/ecologists-endless-quest-for-automatic-inference/). It’s interesting how much more support there was for a post about a fad on its way out versus this hot new approach (and by ‘new’ I mean to ‘new to many ecologists) ….
Lizzie,
Yes that’s a fair point. I probably wouldn’t have bridled if you’d titled a post “the desperation of SVS in ecology”! I suspect I have just been exposed to a different subset of the newer tranche of CI/DAG papers in ecology.
I always enjoy new posts from Lizzie a great deal.
One thing we can all agree on is that it is better to be transparent about causal claims (“Of course we should want causality, we’re scientists”) rather than approaching those without stating any assumption or choosing a model that seems appropriate, linear or not. As a young ecologist approaching these methods, I think the greatest value of graphical causal models is to clearly state assumptions and how to deal with confounding. It shouldn’t lead us to an increased confidence in the results, which means a carefully designed analysis shouldn’t result in more piranhas than one without a causal background, but also in small effects.
The bats example seems far-fetched to me too, because it involves a complex mediation network where assumptions and unobserved confounding lurks around every corner. This seems to me an issue with most SEM models (or alternative namings) in recent ecology: there’s not just one causal estimand, they want their cake and eat everyone else’s too by also trying to model everything in between.
About fixed vs. random effects: I’ve encountered this debate only for modeling causal effects in longitudinal data (as referenced in the “time-invariant fixed effects”), admittedly a small subset of causal inference problems. In that setting, it doesn’t make much sense to me to have a parameter for each year-site combination, and you can use random effects with the various mean centering approaches, in contradiction to the quotes from Dee et al., 2023.
Indeed. It would be interesting to review how many papers using graphical causal models actually include sensitivity analyses relating to the possibility of different graphs being plausible (whether with respect to additional nodes and/or edges). Or whether such papers ever even simply just acknowledge in the text that their model might be vulnerable to such.
It could be worse—the ML folks now use the term “causal” to refer to anything predicting forward in time. So any kind of autoregressive model that predicts the future based on the past is now called “causal”; see, e.g., Hugging Face on causal language modeling.
What’s the reason for this? I find it really annoying when a second discipline start using the terminology of another discipline without it actually meaning the same thing. It’s hard enough to try and talk about causal inference to people without having to disentangle it from the latest fashionable usage elsewhere. The cynic in me wonders if this is to sell tech to managers who like the sound of something being ‘causal’.
Tom wrote:
“I find it really annoying when a second discipline start using the terminology of another discipline without it actually meaning the same thing. It’s hard enough to try and talk about causal inference to people without having to disentangle it from the latest fashionable usage elsewhere. The cynic in me wonders if this is to sell tech to managers who like the sound of something being ‘causal’.”
When I mentioned on this blog that climate scientists were using the word “feedback” for a phenomenon that was clearly not feedback, I was told that “we use the word differently.” So there, take that, you nattering nabob of negativity! The cynic in me wonders if this was simply that the valid term “knock-on effects” just doesn’t sound as sophisticated.
I have been getting annoyed at some of the words that have crept into the discussion of chatbots, specifically words that anthropomorphize aspects of chatbot performance when the chatbot is doing something completely unrelated to how the human brain works. The recent discussions of “memorization” and “belief” are examples. To be clear, I am not implicating those who simply mention the terms being used in the literature, we sort of have to do that to communicate, but rather the people applying the terms in what turn out to be influential papers. Especially galling are the papers that treat LLMs as black boxes so that the output can be treated as having come from some sort of mysterious homunculus simply because we lack access to what the algorithm actually did.
As commenter Joshua put it, we don’t really have the syntax to discuss chatbot behavior.
See also: casual self attention. It confused me unduly due to this terminology co-opting.
See here (I like this post/blog a lot, to be clear):
https://magazine.sebastianraschka.com/i/140464659/causal-self-attention
“Causal self-attention ensures that the outputs for a certain position in a sequence is based only on the known outputs at previous positions and not on future positions.”
It’s just masked; whence the causality? Raschka writes that earlier in that section, to be fair, but I must echo Tom’s question and wonder why the field overloaded the term.
“This causal self-attention mechanism is also often referred to as ‘masked self-attention’.”
That’s the same autoregressive use I was talking about. It was originally just called an “autoregressive mask”.
The real workhorse in ML is “bias”. They use the term “inductive bias” to mean model priors, algorithmically induced priors, and model structure, they use the term “bias” to mean the intercept of a regression (or bias units in neural networks), “bias” to mean that the output overrepresents some categories (if you asked for nurse names in early versions of GPT, men were underrepresented—now they’re overrepresented after diversity fine tuning), and then there’s the use to mean expected error, which is what the term means in statistics.
This usage is just intended to distinguish between autoregressive models (like GPT) that only condition on the past and masked models (like BERT) that condition on both the past and the future to “predict” the present. Obviously models that look at the future are violating the causal arrow of time. The people using “causal” in this way are not making any claim or connection to causal processes in the world. But it is confusing.
Then there is the whole Granger Causality literature…
Continuing this line of thought, Numerical Ecology by Legendre and Legendre, a well known text in the discipline, goes the other way. What we usually call “causal” is called “predictive”, as in “predictive of potential outcomes”, opposed to “forecasting”! What a mess! I enjoy many things about the book, aside from the focus on hypothesis testing, but I quickly ran past that paragraph!
“and how they have learned from them the amazing power of fixed effects for finding causality and the dangers of random effects to lead us astray.”
I find it funny that apparently now ecology says the same things that were hot in sociology maybe 15 years ago. But yeah, sociologists always seem to envy economists. I remember vividly writing an enthusiastic assignment about fixed effects as an undergraduate with the exact same point: We can control for all time invariant heterogeneity, isn’t that great (and totally superior to stupid random effects)?
Now, I agree that all this terminology is confusing and I still do not really know what fixed effects are. As I see it, some non-random slope or intercept is not automatically a fixed effect. Rather fixed effects are typically not of interest in themselves, they are used only to create an unbiased estimate of some average treatment effect. And this is the goal of the econometric causal inference stuff. They want to estimate some average treatment effect and they want to control for everything that might bias such estimate. Now, one problem with this is that just because you can (or so you hope) get an unbiased estimate of something, it does not automatically make sense to estimate it. One obvious example is where the treatment varies across some time-invariant trait (individual level heterogeneity is another great (not) jargon for this). What if men benefit from some treatment and woman do not? The true average effect could be zero and a fixed effect model may recover it, but it is still a useless model.
So yeah I agree with you, Daniel and Andrew above (if I read them correctly). Causal inference means getting a black-box estimate of some average treatment effect.
Btw there is something I find totally confusing about such analyses: They never care about prediction error. Typically R^2 is very low. But that means that there are likely many important predictors that are all not included in the model and that are unknown. And now I shall believe that all these unknown important predictors are uncorrelated with the predictor of interest? Hmmm not so sure.
So what to do? I don’t know. But I do think experiments are overrated, at least in sociology. They may help to differentiate between theories, but we do not really have theories that it is worth differentiating.
Hey there! Seems like you’ve got some confusion/misconceptions about both the methods discussed and our goals as authors (not to mention our positive view of experiments). I wish you’d dropped me a line or a zoom call to talk about them (still miss the stan meetups you hosted in Boston), but, happy to answer any here in this forum, as that would probably be good for all Ecologists who read the blog!
Lizzie – I salute you for a very stimulating post that first points to several pervasive problems in the literature and then quickly moves to a very reasonable suggestion – to be less gaga of statistics and to focus on biological models that emphasize “generative modeling”. Let me offer some support for your discerning insights into both of those ideas.
First: The literature on causal methods, and especially “causal inference methods” is indeed a House of Babel. There has up to this point been an insufficient language to make sense of the topic. I recently published a first attempt to describe an expanded multi-evidence paradigm for causal investigations that hopefully better describes the subject, https://doi.org/10.1002/ecm.1628
Second: Ecologists are faced with exposure to a variety of historical and more recent ideas that compete with one another without any hope of resolution. What is perhaps most important to recognize is that the emergence of literature in ecology touting “causal inference” refers to something very specific. I think we can understand this literature best by recognizing that it comes to us from source materials describing what is conveniently summarized as the Causal Inference Paradigm, https://ndl.ethernet.edu.et/bitstream/123456789/29399/1/Hua%20He_2016.pdf#page=16. (see Chapter 1).
Third: Papers promoting the causal inference paradigm are growing very rapidly. This material is “promotional” in that is promotes a particular viewpoint and associated set of ideas. I believe it is very easy to demonstrate, as you have in your offered “Solution”, that this literature falls short of being “educational”. You again have recognized why it falls short – it relies much too heavily on statistical models. In particular, it fails to recognize the importance of the non-statistical mechanistic knowledge that scientists who conduct studies and collect data have at their disposal. Most recently, I just published a paper entitled, “Causal Interpretations can be Based on Mechanistic Knowledge” (https://doi.org/10.1111/1365-2745.70152). This paper demonstrates “Mechanistic Causal Determination”, the technical term that corresponds to the article’s title. It is complementary to our second paper out earlier this year that compares statistical and mechanistic approaches https://doi.org/10.1111/ele.70029.
Fourth: Independent support now exists for the idea that the Causal Inference Paradigm (aka the Statistical Causal Inference Paradigm) is incomplete and insufficient. This comes from a National Academies Consensus Study Report on Causal Methods (2022). https://nap.nationalacademies.org/catalog/26612/advancing-the-framework-for-assessing-causality-of-health-and-welfare-effects-to-inform-national-ambient-air-quality-standard-reviews?utm_source=NASEM+Math+and+Statistics&utm_campaign=085f0f9ad7-EMAIL_CAMPAIGN_2022_10_14_05_07&utm_medium=email&utm_term=0_fa16bc02ed-085f0f9ad7-564182182
This finding provides general support for the Multi-evidence paradigm (starting on page 30), though without the necessary detail found in the linked journal articles.
I am pleased after decades of study to provide what I hope will promote less Babel-ish discussion and understanding of this topic, which as you also point out is foundational to the aspirations of scientists.
Jim Grace c/o [email protected]
I am really disappointed by the condescending tone in this post. I haven’t met most of the people Lizzie tried to dunk on here. But… having read papers from Dee and company, and met her in person before, it was my impression that she has a) a long background in econometrics b) a really very nuanced perspective in observational causal inference methods and supports everything from experiments to hierarchical process models all as parts of a spectrum with “Causal Inference” a shared goal.
It seems to me that Lizzie spoke with a misinformed grad student and then fabricated a debate here. Throwing punches at other scientists doing their best for their interest in a particular research method and then retreating to a position of “we should be less dogmatic and respect research methods for their corresponding strengths and weakness” is a motte-and-bailey argument.
While I agree that econometrics often has the effect of radicalizing poorly informed scientists, the entire point of these observational causal inference methods is to be explicit and transparent about the assumptions modelers are making and then we can collectively examine the results to hash out our disagreements, preferably in peer review, collaboration, or personal comms… not rambling blog posts.