Palko writes:
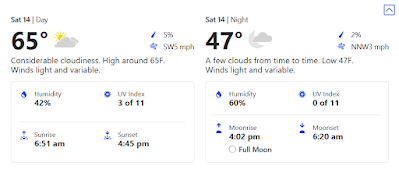
Last Saturday, I [Palko] checked Google and saw the forecast for a week from that day was a 75% chance of rain. That would have been very good news–it’s been dry in Southern California this winter–perhaps too good to be true. I checked a couple of competing sites and saw no indications of rain in the next seven days anywhere in the vicinity. A couple of hours later I checked back in and Google was now in line with all the other forecasts with 5% or less predicted.
As of Thursday, Google is down to 0% for Saturday while the Weather Channel has 18%.


Wow. I’ve noticed sometimes that different online sources give much different weather forecasts, even for the next day. But I’ve never looked into this systematically. I’m reminded a bit of Rajiv Sethi’s evaluations of election forecasts and our earlier post, What does it mean when they say there’s a 30% chance of rain?
Palko continues:
We’ve talked a lot about what it means for a continuously updated prediction such as election outcomes, navigation app travel time estimates, and weather forecasts to be accurate. It’s a complicated question without an objectively true answer. There are many valid metrics, none of which gives us the definitive answer
Obviously, accuracy is the main objective, but there are other indicators of model quality we can and should keep an eye on. Barring big new data (a major shift in the polls, a recently reported accident on your route), we don’t expect to see huge swings between updates, and if there are a number of competing models largely running off the same data, we expect a certain amount of consistency. If we have a prediction that is inaccurate, displays sudden swings, and makes forecasts wildly divergent from its competitors, that raises some questions.
I am a weather forecast addict – always have been, but especially now that I am a golfer, a bad one who plays even worse if it rains. I’ve observed that the forecasts vary substantially between the National Weather Service, Foreca (itself a combination of a number of forecasts), Accuweather, and the Weather Channel. This is true even a day or two out. Worse yet, the forecasts change – not daily, not even hourly, but sometimes within a few minutes. I’ve found (without careful analysis) that Foreca seems to be the most accurate, but disturbingly, the hourly forecast for a few days out changes within minutes. It will show showers between 3AM and 8AM then cloudy or sunny the rest of the day, only to change to cloudy until 8AM then showers all morning – changes that show up within minutes of each other.
My belief is that weather forecasting is improving over time. Yet the rapidly changing forecasts make me uncomfortable about that belief (I think political polls are far more stable than the weather forecasts). So I’m not sure how forecast “accuracy” can be meaningfully measured. There is the obvious time dimension – accuracy will vary according to how far in advance you want to measure it. But there is also the variability dimension – forecasts that constantly change are likely to look “accurate” at some point in time. Do we measure whether the forecasts become more stable as a measure of accuracy (subject to eventually being right)? Given 2 forecasts equally accurate 2 days before, is the one that has varied less of the preceding week deemed to be more “accurate?”
Then, of course, there is the real problem of how to evaluate accuracy of a probabilistic forecast (what I think Palko is focusing on). When candidate A wins an election and one poll assessed the probability at 30% while another gave it 40% chance, does that make the second poll more accurate than the first? It seems like “accuracy” reduces an uncertain situation to a binary choice of right or wrong. The only measure that seems sensible to me is to examine how frequently the real outcome falls within various confidence intervals from the forecasts – a coverage assessment based on repeated events. Weather forecasts only provide a point estimate of probability and maybe that is a problem.
I will add that I believe the probability of rain in a weather forecast refers to the probability of a location experiencing rain within an x mile radius of a site. If that is the official definition of the probability of rain, then I think accuracy is more easily measured (in theory, perhaps not in practice). The more common interpretation is that a 30% chance of rain refers to an entire area – if that is a correct interpretation, I really don’t know how to assess its accuracy.
For the US weather Service, it’s the probability that there will be measurable rain (somewhere) in the forecast area. That’s whatever forecast area the particular Weather Service office covers. What it means for all those other forecast sites, who knows?
We could go deeper and ask what “probability” even means when used in this sense. For example, suppose the WS were to produce an estimated probability distribution for the day in question. How could it ever be proved right (or wrong), given that each day will have unique meteorological conditions? But maybe we had better not go there!
From https://www.weather.gov/lmk/pops:
“Probability of precipitation describes:
The chance of precipitation…
…at a particular point
…over a certain period of time.
So, in the example above, there is a 30% chance that at least 0.01” of rain will fall at the point for which that forecast is valid over the period of time given (“Tuesday” in this case). The time periods given in our forecasts are typically 12-hours long. The “Tuesday” period, for instance, is from 7am EST to 7pm EST (8am to 8pm EDT) on Tuesday. “Tuesday night” would run from 7pm EST (8pm EDT) Tuesday evening to 7am EST (8am EDT) Wednesday morning.”
I think two things that complicated this, and I may be wrong, is that the “probability” comes from the results of an ensemble of forecast runs, plus the obvious fact that if I have a 10% chance of rain each hour, the probability that there will be some rain during the 12-hour period (ie think 12 coin flips) is higher than 10%. So my often faulty intuition is it would not take too large a difference in the ensemble forecasts to produce a reasonably size difference in the probability (Andrew being much better at these things will whip out some R code to look at this). Also, for better or worse, some of the companies are using AI in conjunction with the ensemble models. I have no knowledge whether this produces better forecasts, but I imagine it can cause a larger amount of variation between forecasts from different companies. And the private companies have for a long time tried to cripple what the NWS can do for small-scale forecasts, and I am certain all of this will improve (not) with the proposed closing of a lot of local NWS stations.
slight edit: NWS says “(technically a 5 kilometer square grid around that spot).” So, spot is a small area (smaller than I thought). I suspect that the probability does not vary from one 5km2 spot to the next; i.e. that the forecast covers a wider area than that but is then disaggregated to those spots. But I don’t know and haven’t tried to check.
Its number of possible configurations of the universe where it rains, divided by total possible configurations.
Calculating this probability is intractable, so people try to approximate/estimate the value using past frequencies and so on. It is indeed impossible to know if an individual estimate was exactly right/wrong, and further its a priori expected to be strictly “wrong”.
Thinking of it this way transfers the trouble from the mind-bending “what is probability?” to a question of “what do we actually mean by ‘right/wrong’ in this context?”.
Okay guys…
As you might imagine, forecast verification is an important part of forecasting, and the weather forecasting discipline has been at it for over 100 years, so you might also imagine we’ve identified the challenges and pitfalls and come up with solutions or at least best practices.
The discipline of forecast verification really got going with the Finley Affair, wherein in the late 19th century J.P. Finley reported the results of an experiment demonstrating 95% accuracy in predicting tornadoes. Many of you might enjoy reading about it: https://journals.ametsoc.org/view/journals/wefo/11/1/1520-0434_1996_011_0003_tfaase_2_0_co_2.xml
Jumping to the present day, here’s
https://www.cawcr.gov.au/projects/verification/#Methods_for_probabilistic_forecasts
a good discussion of the quantitative metrics and graphical depictions used to evaluate the key desirable characteristics of a probabilistic forecast:
reliability – agreement between forecast probability and mean observed frequency
sharpness – tendency to forecast probabilities near 0 or 1, as opposed to values clustered around the mean
resolution – ability of the forecast to resolve the set of sample events into subsets with characteristically different outcomes
When I was in school, probabilistic forecast guidance came from statistical analysis of the relationship between various dynamical-model-generated predictors (temperature, moisture, vertical motion, precipitation, etc.) and the fraction of a given area experiencing precipitation >= 0.01″ in a specified time interval. Under the assumption that the relationship between predictors and predicated is uniform over such an area, the fractional area experiencing precipitation (easily measured) can be equated to the desired forecasted quantity: the probability that any given location within the area would experience precipitation.
Ensembles of output from dynamical models (generated by running the same model multiple times with slightly different initial conditions, or running different versions of the same model, or running different models) are a relatively recent invention, and while you can conveniently directly calculate the fraction of models producing a certain forecast outcome, it doesn’t make for a very good forecast. Most ensembles are not perfect: they have biases and they tend to be too clustered around a particular forecast. So an additional statistical correction step is applied to essentially calibrate the raw ensemble probabilities so that they have average values consistent with reality and uncertainty consistent with demonstrated forecast errors.
In the past few years, the more classical statistical approaches for generating reliable probabilistic forecasts have been or are being supplanted by machine learning approaches. Even more recently, AI models have been trained on historical data to produce forecasts that are more accurate than dynamical models and (once trained) orders of magnitude faster to run. How to get the AI models to directly produce superior probabilistic forecasts is research that’s ongoing at present, but it appears that AI models will at a minimum be useful for producing huge ensembles that can provide better guidance on unlikely but possible extreme events.
Ridiculous forecasts come from AI/ML or statistical tools that don’t have humans in the loop (making them too accepting of bad data) or haven’t been calibrated. A recent example that made the news was a few apps had Chicago air pollution skyrocketing to insanely high levels:
OMG, it might be real!: https://www.dailymail.co.uk/sciencetech/article-14640857/mystery-major-city-public-health-emergency-toxic-chemicals-air.html
No it’s not: https://www.msn.com/en-us/news/us/was-chicago-s-air-quality-actually-bad-wednesday-no-here-s-what-happened/ar-AA1DyLbs
The NWS forecasts still have humans in the loop, albeit not as many humans as a few months ago.
“…When candidate A wins an election and one poll assessed the probability at 30% while another gave it 40% chance, does that make the second poll more accurate than the first? …”
Yes, the prediction that assigned a greater likelihood to what actually happened was more accurate.
James:
Election forecasts should be on vote shares not win probabilities and can be evaluated based on the vote share. In that way they are different than a forecast of whether it will rain.
Andrew, I’d suggest the analogy to “vote share” is “amount of rain”. There’s some very detailed predictions of how much rain will occur, which are quite important when it comes to whether there will be flooding or not.
The National Weather Service site https://www.weather.gov/ has all sorts of great stuff on every weather variable you might care about. The forecast details are also very interesting, since they’ll sometimes talk about the different models giving different predictions, and why the writer thinks one or the other is better in a certain case.
Seth:
I was thinking about this, but the difference is that “amount of rain” is a mixed discrete-continuous variable with a high change of being exactly zero. So it’s really a different mathematical problem.
I think there is more similarity than this. In fact, a number of decision problems have a similar two stage structure. In the old days (really old), telecommunications demand models used to include a stage one model of whether or not someone would subscribe and a second stage model about usage, conditional upon subscription. In a similar vein, rainfall is a two stage problem: stage one is whether or not it will rain (frequency) and stage two is amount of rain conditional on it raining from stage one (severity). Now I can see voting as a two stage problem: stage one is whether or not to vote and stage two is who to vote for, conditional on stage one being a decision to vote. The 2nd stage problem is a continuous variable in the first two cases (telecom demand, rainfall) but discrete in the voting case (it is who to vote for, not how much to vote).
I’m not sure that the commonality of the two stage approach provides insight or whether the difference in the continuous/discrete nature of the 2nd stage decision makes these different qualitative problems. But I hadn’t thought of the somewhat parallel nature of these problems (especially since the telecom demand models along these lines predate the year 2000).
“Election forecasts should be on vote shares not win probabilities and can be evaluated based on the vote share. …”
What people care about is win probability so that is what forecasts should offer. In my opinion at least.
In any case it is possible to evaluate probabilistic forecasts of binary events. The forecast that assigned the greater probability to the event that actually happened was the better forecast for that event.
James:
Fair enough. Let me state it more carefully: Even if your only goal in election forecasting (or sports forecasting) is to predict the winner, your forecast will still perform better if you model and forecast the vote margin (or the score differential) and then use that to forecast the winner. See here for discussion. You can think of the forecast of vote margin as an intermediate step along the way to forecasting the winner.
Perhaps this is the right place to ask this question, and perhaps I’ll get an answer.
Over the past two weeks, Trump’s “approval index” rating has gone from a (-14) down to a (-2) to back to a (-10) across two weeks in the Rasmussen tracking poll.
https://www.rasmussenreports.com/public_content/politics/trump_administration_second_term/trump_approval_index_history_second_term
It doesn’t make intuitive sense to see such a change in views over a relatively short period of time. I guess it could be a “Forget it, Jake. It’s Rasmussen.” situation. But I assume their methodology is at least close to valid. Or I guess it could be an artifact of sample size and uncertainty range. But it just seems weird to me and I’m hoping someone could explain a shift of that magnitude back and forth over a short time period, especially since it’s not like there’s a vast difference one day to the next, suggesting that any one day is a big outlier.
” it’s not like there’s a vast difference one day to the next”.
There *have* been big shifts over a few days time span. Deportation news and tariff announcements, for example. Lots of whipsawing going on. All those numbers show, I think, is that the situation is very unstable and that’s reflected in the numbers.
maybe it is just most salient news: go from “eggs are too expensive” to he really showed those foreigners with those tariffs” to “why did he give up on tariffs” etc
My assumption would be that weather forecasting models operate on a set of variables (not the full meteorological state at a given moment, which would be unknowable), and that probabilities have their usual sampling interpretation: our central estimate is that x% of the times these variable take these values, there is rain. If so, a single episode should not alter the estimated distribution much, nor should it be dispositive about the usefulness of the model. Is this right?
With regard to this line from Palco, “Google was now in line”–it is not inconceivable that part of the model of a forecasting tool is to include the results of its worthy competitors. Does this make for a better model or is it just a form of hedging, a part of the learning process? A sort of “wisdom of the crowd”?
Paul:
This is related to an issue we’ve discussed on the blog, which is the distinction between statistical estimates as data summaries and statistical estimates as inferences or predictions. One way I’ve put it is, “A Bayesian wants everyone else to be non-Bayesian”; that is, when doing Bayesian inference we need a data model, and the inference is cleanest if the data being aggregated can be modeled as drawn independently. One place this has come up is with poll aggregation: the estimate from any given poll will be more immediately useful if it is partially pooled to where the other polls are, but when combining polls it is convenient if the individual polls are unpooled unbiased estimates.
When I am after an accurate forecast, I stop by NWS/NOAA (https://www.weather.gov/forecastmaps/). Commercial sites seem to optimize a consumer utility function, which introduces things like the web bias (https://en.wikipedia.org/wiki/Wet_bias)
Eric:
Here’s my NOAA story.
“…displays sudden swings, …”
It is my understanding that some weather forecasts are computationally expensive. Suppose it takes an hour to do the computation and every hour you start a new computer run incorporating an hour of new data. Then your forecast will be stable for an hour but then jump when the next run completes. I don’t think this really has anything to do with model quality.
I live in New York, and what I’ve found is that when they say it’s raining, it may not be everywhere. In fact, if you look at the NOAA maps, you will often see that weather requires time and location to make accurate predictions in many cases, and reporting the weather often sacrifices the accuracy of these predictions. In the summer, I used to commute from Long Beach to New York City by train, and I quickly realized that the weather I needed was the walk to the train for seven minutes, the walk from the train to my office for ten minutes, and an hour later. I could understand this if I looked at the NOAA predictive maps, but not from weather forecasts. DarkSky was the exception until Apple acquired them and dumbed down the projections. Today, when I ride, I often find that I can make adjustments as I leave and choose a route to avoid rain in near real-time – the immediate forecasts are that accurate. I’ve often noticed that Apple, Weather and Accuweather greatly diverge in their forecasts. Someone explained that the cost of being wrong about a rain forecast is nonlinear to the cost of being right. You lose users when you fail to predict rain, and many services overpredict rain until just before the moment when their accuracy improves.
Surprising Andrew did not mention the Hopf fibration, suitably oriented to yield the Bloch sphere. Qubit topology tells us to expect probability of rain nearer zero or one. Simply, if it didn’t rain as predicted at one point in time, it almost surely did at another.
There is no reason nature need comply with our expectations.
In ‘The Signal and the Noise’, Nate Silver discussed theories of prediction of natural events (weather, but also earthquakes, etc., at some length. He also wrote that some forecasting organizations use ‘value-added’ forecasts – forecasts adjusted to reduce any animosity listeners might feel about poor forecasts.
An election forecast has finite variance and, therefore, the variance is calculated in Euclidean space. Weather forecasts, from what I understand, are either ensemble methods using Monte Carlo simulation or use non-linear dynamics. The earlier would need a proof of convergence before a variance can be found. That is, it can’t be assumed that one weather forecast can be compared to another. For the latter, for non-linear dynamics, this is in Hausdorff space because this methodology uses n-dimensional manifolds. Then, the distance metric would have to be topological, such as the Hausdorff distance.
But, I’m not an expert. And I would love if an expert answered my question how variance is calculated using either non-linear dynamics or an ensemble method.
Sam –
Initial condition ensembles are generated by perturbing the initial conditions by an amount that’s much smaller than the accuracy of the initial conditions. So the ensemble forecasts are by design very close to equally plausible and interchangeable and are treated as such. Another class of ensembles uses models whose details differ but it is not known which set of details is best so out of ignorance they’re treated as interchangeable.
If I understand your point about n-dimensional manifolds correctly, that’s true for the state of the system but not for an individual predictand such as the probability of precipitation at a given location. Variance can then be calculated based on past forecasts. The expected variance can depend on the state of the system, though, and that’s an additional layer of sophistication in the forecasting endeavor (predicting not just the weather, but the accuracy of the prediction) that was a key reason for utilizing ensembles.
Thanks!