
Bruce Knuteson shares the above plot and writes:
Look at the strikingly suspicious overnight and intraday returns to Tesla’s stock noted by the Financial Times (cf. my rejoinder) and Forbes.
This suspicious return pattern in TSLA is easy to reproduce [data]. Nobody has articulated a plausible innocuous explanation for it. The only explanation that fits the facts is the market manipulation we have discussed. That has been the only explanation for nearly a decade now. Tesla’s stock is the source of much of Elon Musk’s wealth. The public still doesn’t know about this suspicious return pattern in the source of much of Elon Musk’s wealth because nobody has told them.
This has come up before, and it’s not just Tesla. Here’s a a graph that Knuteson sent me a couple years ago as evidence of market manipulation:
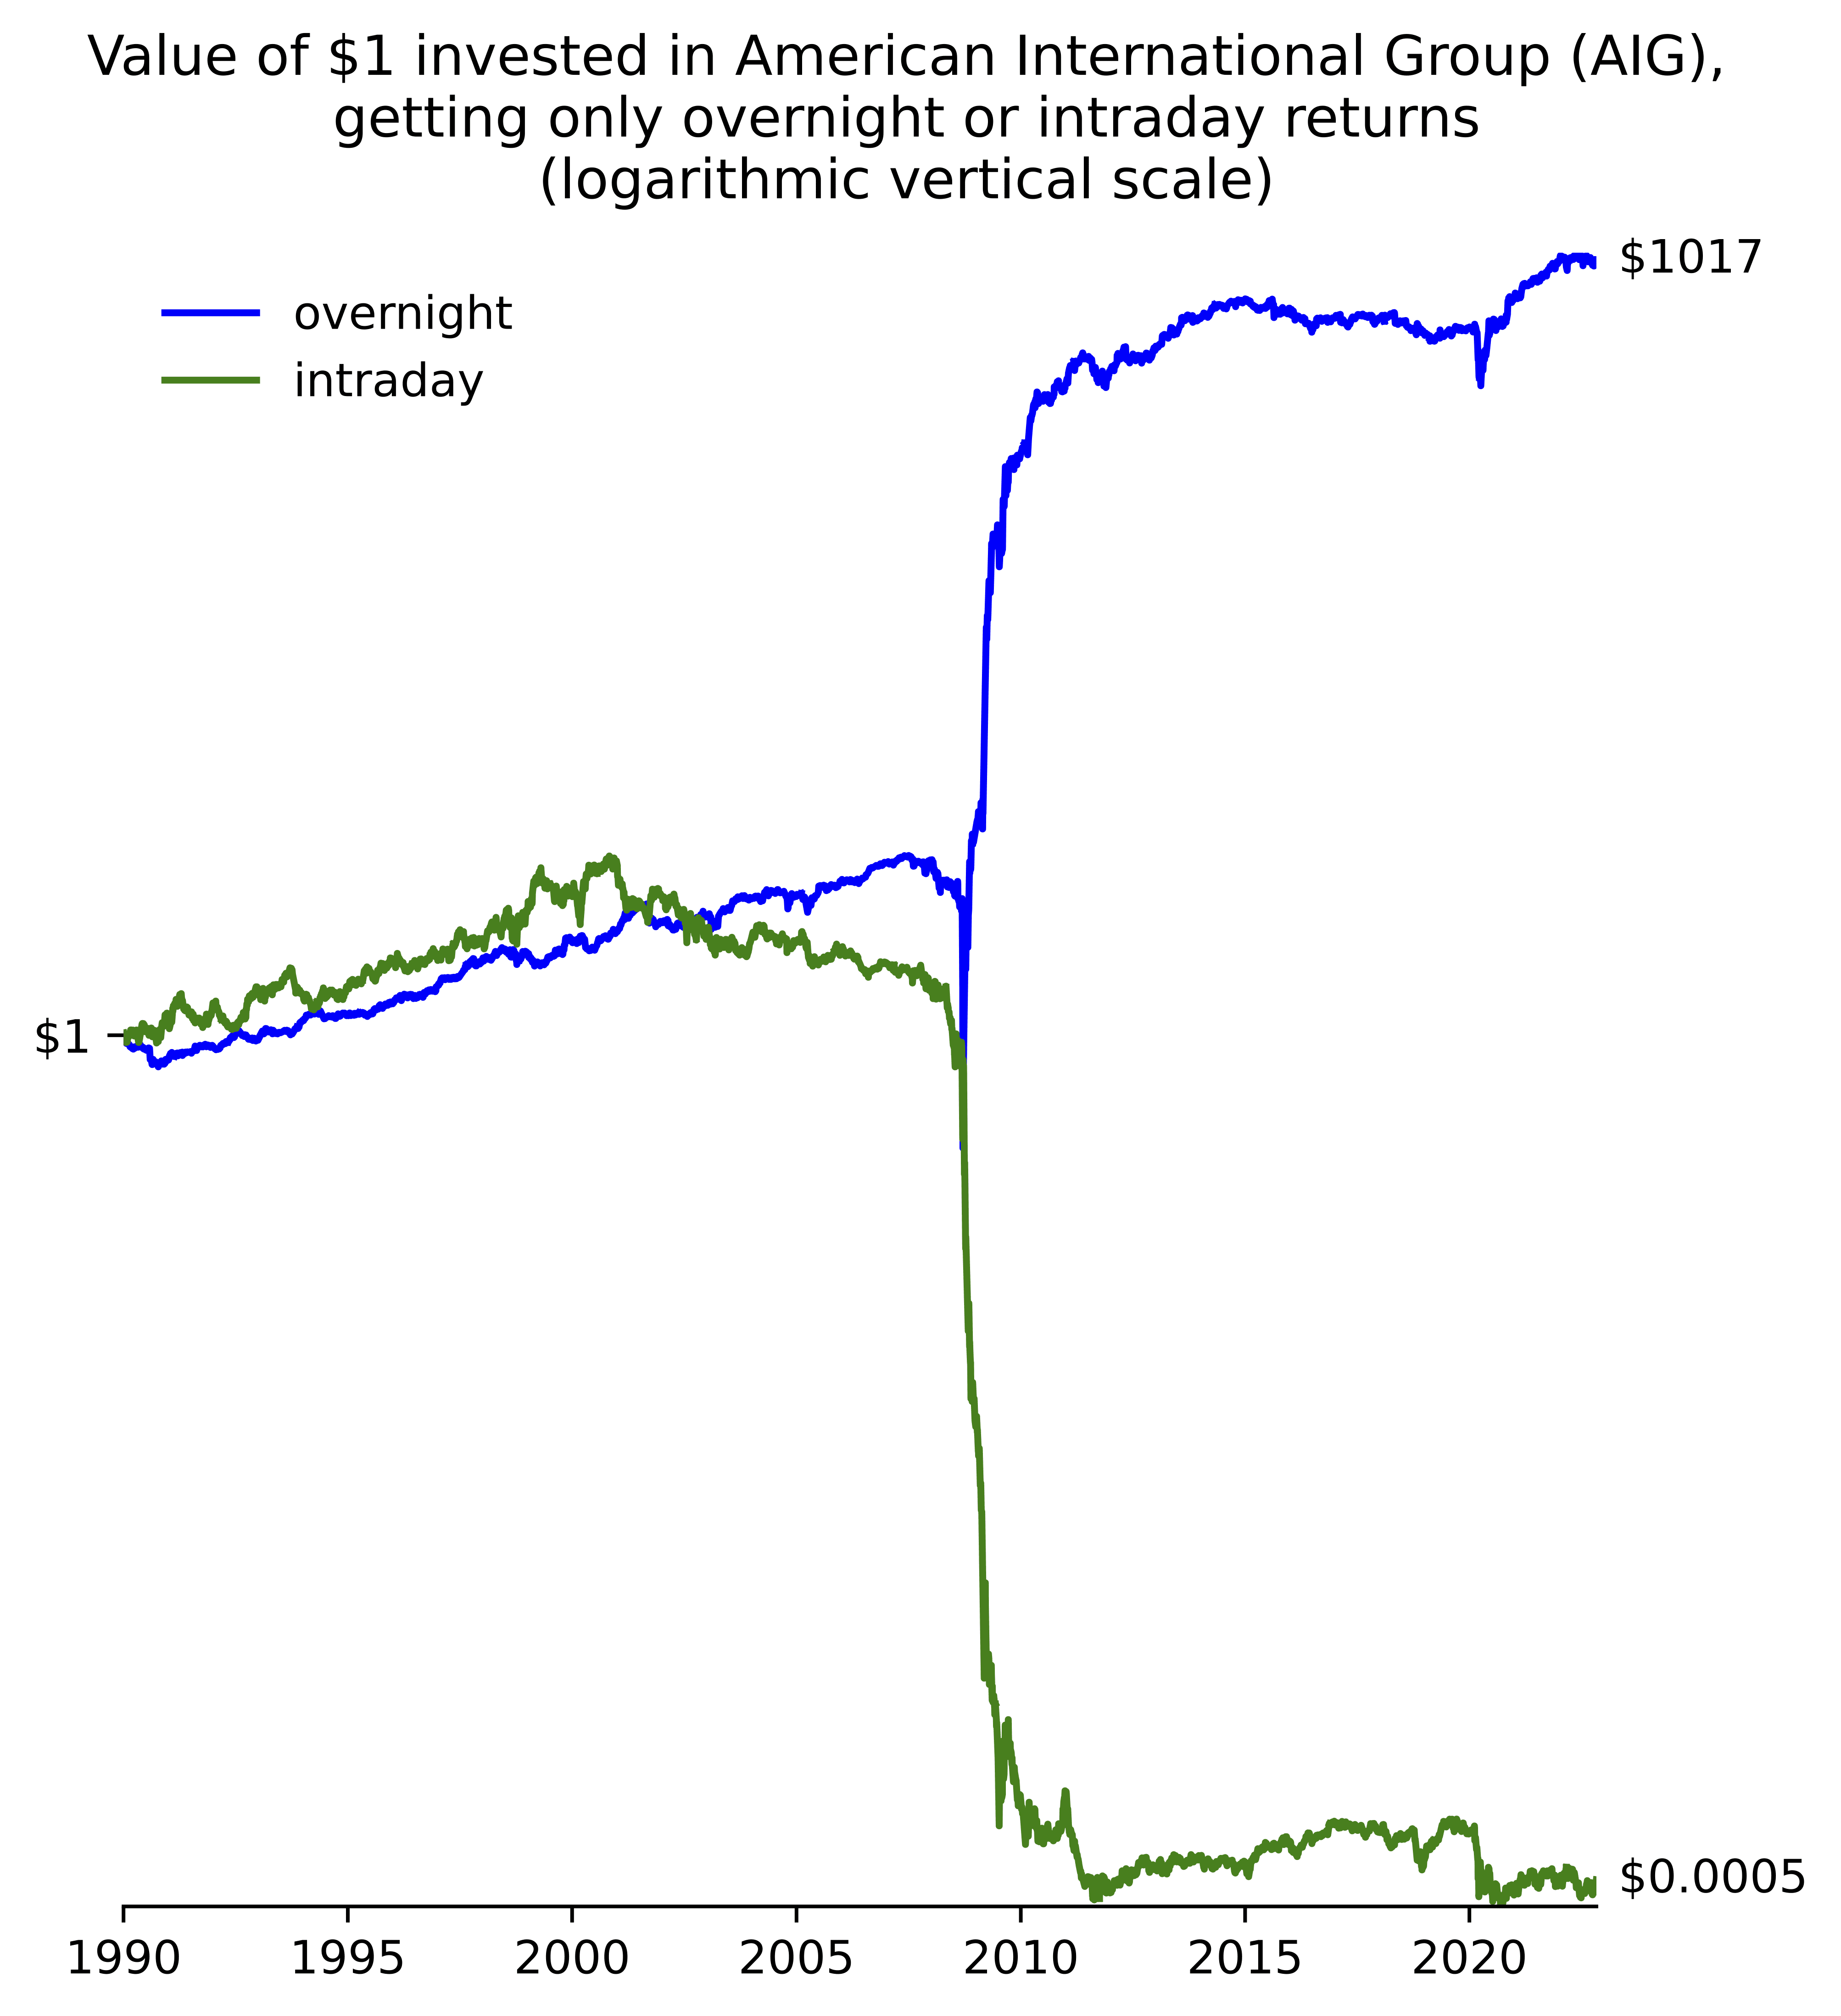
As I said at the time, I absolutely have no idea about this sort of thing. I ran into someone yesterday who used to work in financial markets and he was saying there was some class of high-volume traders who never like to hold onto assets overnight. And various theories came up in the comments to our previous post.
It’s an interesting statistical puzzles, in part because from my perspective it’s essentially impossible to understand without lots of subject-matter knowledge. And, unlike some other statistical puzzles (for example, the one discussed here) it’s a live issue.
One question that came up before is how this pattern looks for other financial assets. Knuteson shows a bunch of the relevant plots in this paper, for example:


Again, I entirely defer to others in trying to understand this one.
P.S. Knuteson also has this comment regarding the graphical displays:

There is some research looking at the exact timing of the overnight returns using index futures:
https://papers.ssrn.com/sol3/papers.cfm?abstract_id=3596245
After the prior exchange prompted by Knuteson’s message to Andrew (on the same topic), I am convinced that these financial puzzles are not my forte, and I won’t attempt to tackle this one. But the previous discussion has made me wonder about Knuteson’s claims regarding this phenomenon. A number of commenters pointed out practical issues with the apparent paradox of overnight returns being very large with intraday returns almost nonexistent, yet Knuteson keeps presenting these as evidence of some sort of market manipulation. So, I looked at some of Knuteson’s work, and found this recent paper (https://arxiv.org/pdf/1602.06188) offering to dramatically “increase the pace of scientific progress” and this one (https://arxiv.org/pdf/1609.03223) which purports to solve science’s replication crisis. My reading of both papers leads me to believe that the proposal hinges on having a third party in any dispute about evidence that will determine the ultimate validity of a claim (according to pre-specified rules). If I am understanding these papers, then the scope for these “solutions” seems quite limited to me, and the offered solutions quite over-hyped – much like the claims about the intraday vs interday returns puzzle highlighted here.
Perhaps someone can explain the insights offered in any of these papers that might justify the assertions. I’m not seeing it, but it might be due to my limitations.
For a concrete example of my questions about the two papers I linked, I would think the recent announcement about the causes of autism would make a good application. Kennedy has promised research to identify the causes of autism by September. This has been met with much criticism by medical researchers. I would think Knuteson’s mechanisms would offer some help in resolving this debate. All we need is to identify a third party (the stakeholder, in the traditional meaning of the word) to hold financial rewards that will be distributed according to the pre-specified rules regarding what would constitute adequate evidence regarding the causes of autism.
Aside from issues associated with specifying such rules, I am stuck trying to think of who this third party might be and how they would be chosen. Apparently, in the current political environment, nobody is willing to see the justice system as being capable of impartiality (one side sees all the Court decisions ruling against the current Administration as impartial judges while the other side is only willing to cede that judgement to the Supreme Court, and then only if that Court reaches a different decision). So, I’m not seeing how Knuteson’s proposal would resolve the autism causation question. Nor am I understanding whether the intra/inter day return question is evidence of market manipulation or an artifact of market (il)liquidity and stated vs actual market prices (though I will admit that the graphs are striking).
Well, there seemed to be agreement in the last thread about dividends* and rounding.
I think he has to get a better data source than yahoo charts open/close.
* Although I had a disagreement about whether the dividend effect was due to “fair value” or just trading.
Tesla has never paid a dividend (https://ir.tesla.com/node/16#accordion-1-does-tesla-pay-a-dividend-does-it-plan-to), so you certainly don’t need to worry about that in this case.
The plot of Tesla’s overnight and intraday returns in the Forbes article linked in Andrew’s post was made with CRSP data (https://www.crsp.org, a staple of academic finance), according to private correspondence with the author Hersh Shefrin. Checking that you get the same thing with different data sources is obviously a good idea, and in this case the Yahoo Finance data seem fine. If it makes you feel better, Yahoo Finance now charges $479.40/year for historical price data in a format that is easy to import into a spreadsheet. (Click the “data” link in Andrew’s post to get to the Yahoo Finance page, and then try clicking on “Download”.)
Thanks, I was wondering about looking at dividends vs not.
From your link:
https://www.crsp.org/research/crsp-us-stock-databases/
I would have to download to see, does this mean it only has daily open/close? Or can you get hourly, one-minute, tick, etc?
It looks like a great source if we can get historical tick data from those exchanges. Are the order books on there?
Foreign money has been flowing into the US for a long. To a large extent it’s an inevitable consequence of massive US trade and budget deficits, but it’s also in part caused by the US markets being more attractive. This becomes self reinforcing since as more foreign money flows in, US assets are bid up, and the US looks even more attractive to foreign investors. The amount of foreign money flowing into the US has been staggering.
One possible consequence of this is that US assets move more not when US exchanges are open, but when foreign exchanges are open, because that’s when foreigners buy US assets. Hence causing things like overnight-effects.
The amount of foreign money is staggering. $2T per year deficits, $1T per year trade deficit: all of which has to flow back into US asset markets. I’ve heard that the majority of net savings in places in like China have in effect been going into US markets. This is big enough to explain the housing and market bubbles of the last three years.
This should be visible in the data if looked at in detail. We basically know from where and how big the foreign inflows are. We also know when specific foreign exchanges open and close.
Putting those two together it should be possible to see if the foreign inflows hypothesis explains the overnight effect in detail.
A few comments.
The charts for the major US indices look similar to the chart for Tesla. So I see no good reason to drag Elon Musk into this.
If I figured correctly the US markets are open less than 20% of the time. And companies tend to announce major news like earnings reports (UNH) or drug trial results (LLY) when the markets are closed. So you would expect more movement when the markets are closed. If there is a trend over time (up or down) this will cause the cumulative closed market returns to diverge from the cumulative open market returns.
If for some reason whether psychological (when do people feel like buying or selling) or systematic (when do 401K plans invest your money) there is buying pressure at the open and/or selling pressure at the close this will tend to increase the opening price and/or reduce the closing price which will reduce open market returns. Arbitrage generally will not eliminate such anomalies entirely just reduce them to the point where it is no longer practical to profit from them.
If you don’t understand exactly how the database you are using computes open and closing prices and how it handles dividends, splits, rights offerings etcetera it is possible to introduce some small subtle systematic bias which will add up over time. In this regard rumor has it that free publicly available stock price databases are full of junk and cleaned databases cost serious money.
In the last thread I suggested checking the (free) IEX tick data:
https://www.iexexchange.io/products/market-data-connectivity
James, your expectation of “more movement when the markets are closed” doesn’t match reality. Nearly every stock and every index moves more when the market is open than when the market is closed. See for example Marie-Eve Lachance’s “Night trading: Lower risk but higher returns?” (https://onlinelibrary.wiley.com/doi/10.1002/rfe.1180).
It doesn’t seem like there needs to be a contradiction between the statement of ‘more movement when the market is closed’ and the standard deviation of daily overnight returns being lower than the standard deviation of daily intraday returns.
As an extreme example: suppose that every day the after hours return is exactly 1%, but the daily intraday returns in percent are given by N(0, .01).
I’m in general agreement with James. The patterns being described could have an innocuous explanation like the model where afterhours ‘gap’ movements in US stocks could be largely ‘fundamental’ (e.g. earnings announcements after the close or before the open) which persist and accumulate over time and intraday ‘technical’ price movements largely being due to trading volume (e.g. institutions repositioning their portfolios) which could just be mostly noise around a ‘fundamental’ value.
And Andrew’s acquaintance who suggests there’s some class of high-volume traders who never like to hold onto assets overnight” would be an explanation for the historical pattern of negative intraday returns. That is, if ‘buy on open sell on close’ was a very ‘crowded trade’ it would have created imbalances that specialists and market makers would have faded, collecting their ‘fee’ for providing liquidity.
JYD: The pattern is not concentrated around earnings announcements.
Replying to Anonymous (is that you Bruce?)
An individual stock’s earnings announcements are not the only information releases that occur after hours that represent a change in what is known about that company’s fundamentals.
The fundamentals of companies, especially in the same sector, are positively correlated. So if many other companies release earnings or make forward looking statements after hours we should expect that to influence the open of other stocks the next day.
In addition, a lot of market moving macro data (e.g. CPI, PPI) is released in the morning before the market opens.
If you think these patterns is evidence of “manipulation”, who is doing it and for what gain?
Who do you think is being harmed? Is this some sort of conspiracy against retail day traders?
“James, your expectation of “more movement when the markets are closed” doesn’t match reality. ..”
Yes it appears this is true. Thinking about this I came up with the following possible explanation. Markets move on new information. I was just considering fundamental information but there is other information. In particular that a big player has decided to buy or sell. Which the market learns about when they start buying or selling when the market is open.
It’s well known that most of the returns in US required are generated overnight. Quant funds don’t hold overnight because they are not in the speculation game.
You fell for a crank.
No wonder the FT rejected this story as per his LinkedIn post https://www.linkedin.com/posts/bruce-knuteson_teslas-stock-the-source-of-much-of-the-activity-7317201913706385408-3GX6?utm_source=share&utm_medium=member_android&rcm=ACoAAAxdNhQBeXh6yNa3RfBPWTuWqJtYoT5EJvA
Anon:
I didn’t “fall for” anything. I made it very clear in my post that this is not a topic I know anything about. It’s an intriguing data story that I wanted to share, and the comments in this and in the previous thread, including yours, touch on a bunch of interesting issues, which is what I was aiming for in posting this.
Your statement “Quant funds don’t hold overnight” is wrong. Many quant funds (and all the largest ones) hold overnight.
Would they make more money if they did hold on to stocks overnight?
It is safe to assume that they are acting roughly optimally given their trading strategies with the emphasis being on trading instead of investing. The idealized stereotypical view of a short term quant fund would be a box containing a huge number of different trades with positive expected value and low correlation. As a result you would have a stream of low volatility (ideally market neutral) returns that could be leveraged up.
One easy to understand example would be market making: the quoted bid and ask prices for stocks (buy and sell) are different, and market maker exploits this buy acting as a middle man between the buyers and sellers to collect the spread. The more trading with the less movement in prices there are the better the market makers returns.
What’s a plausible non-innocuous explanation for this?
I’m interested in the the sleight of hand related to the plots, also tying this back to the recent post about log scales. In plot (a) [middle of the panel], he transformed the data to show the cumulative value of the investment assuming one puts $1 in the stock on day 1. He applied a log scale on the vertical axis. This is fine. Then in plot (b), he retained the chart but changed the vertical axis labels so instead of absolute value of the investment, he shows percent changes relative to the initial value.
Why didn’t he just plot the relative percent changes? Let y(t) be the absolute values and r(t) = the percent change = 100*(y(t) -1) is a simple linear transformation of y(t). This is where the log transform creates problems! the y(t) series is guaranteed to be positive since hitting y(t) = 0 means the entire investment is lost. However, the r(t) series can hit negative values and also cross over zero many times over time. Thus, log r(t) is inoperable. The problem is using the log transform for data that are not always positive, and the sleight of hand buries the issue but does not fix it!
Oops I mixed up the chart indices. the middle plot is plot (b) while what I called plot (b) should be plot (c). Also, wrote up a blog post on this here: https://junkcharts.typepad.com/junk_charts/2025/04/logging-a-sleight-of-hand.html
> In plot (a) [middle of the panel] (…) Then in plot (b),
I think you meant (b) and (c).
> Why didn’t he just plot the relative percent changes?
Because “it nicely shows the informative log curve of (b) and the easily understandable returns on (a).”
Why do you feel “deceived” by the simple “minus one” transformation used to label the axis that maps 1 to 0 (0%), 0.80 to -0.2 (-20%) and 854.15 to 853.15 (85315%)?
It’s plotting one thing and labelling it something else.
What is plotted is (log y(t)) – 1; what is suggested is log(100*(y(t)-1)), which is undefined for non-positive returns which is a feature of this type of data
To me, that’s not a simple minus-1.
> What is plotted is (log y(t)) – 1;
I don’t understand what that could mean. When the axis is not labelled the plot of (log y(t)) – 1 is identical to the plot of (log y(t)) – or for that matter to the plot of (log y(t) + C) for any constant C. They are all the same plot up to a vertical translation.
If y(0)=1 and y(1)=0.80 and y'(1)=854.15 the thing that we’re plotting is some transformation f(y(0))=0 and f(y(1))=-0.223 and f(y'(1))=6.75 – plus a constant if you’re so inclined but it won’t really change the plot.
When we label those points as 1 and 0.80 and 854.15 we’re plotting one thing (0, -0.223, 6.75) and labelling it something else – just like when we label those points as 0% and -20% and 85315%.
Just in case, when I wrote (log y(t) + C) I meant (log y(t)) + C. I tried to use your notation but I think log(y(t))+1, etc. would have been clearer.
Try this. What would happen if you try making plot (c) using the relative percent changes i.e make the visual encoding and the labeling consistent? The time series of relative percent change can be computed.
What would happen is that I would plot log(1+y). Not that unusual of a transformation, methinks.
I always wonder about people publishing on stock market anomalies. If you are not a billionaire, don’t talk to me.