Kevin Lewis points us to an article, Adverse Infant Health Outcomes Increased After the 2016 U.S. Presidential Election Among Non-White U.S.-born and Foreign-born Mothers, which was recently published in the journal Demography. From the abstract:
Using data from 15,568,710 U.S. births between November 2012 and November 2018, we find that adverse birth outcomes increased after Trump’s election among U.S. and foreign-born mothers racialized as Black, Hispanic, and Asian and Pacific Islander (API), compared with the period encompassing the two Obama presidencies. Results for Whites suggest no change or a slight decrease in adverse outcomes following Trump’s election, yet this finding was not robust to checks for seasonality. Black-White, Hispanic-White, and API-White disparities in adverse birth outcomes widened among both U.S. and foreign-born mothers after Trump’s election. Our findings suggest that Trump’s election was a racist and xenophobic [italics in the original] macro-level political event that undermined the health of infants born to non-White mothers in the United States.
The political agenda is clear; that said, let’s look at the paper. We’ve been reading lots and lots about the supposed public health crisis among white men, so it seems reasonable enough that researchers should study what’s happening among nonwhite women.
As the saying goes, I read the article so you don’t have to, and in my judgment it’s a hack job.
I won’t go through the whole thing, because that’s not really the purpose of this post, but here’s a bit, just to give you a sense of things. The paper has two sets of graphs of raw data, one showing low-birth-weight births and one showing preterm births. I’ll show the preterm because those patterns are slightly more dramatic:

I have no idea what’s going on with the weird-ass y-axis labels or that glitch in the lines near the beginning of each fitted time series, and the whole discontinuity thing is a crock, in that (a) you could choose any arbitrary time point and break up the lines and you’d see that sort of pattern (see this paper with Zelizer for further discussion of that point) and (b) there’s no logical reason to think of November 2016 as any kind of turning-point month, given that the babies in question had been conceived nearly a year earlier. So, these graphs are just something that somebody did with some data.
In addition, aside from all that, is the question of how these graphs are interpreted. Here’s how it’s described in the paper:
A visual assessment of the data suggests that all mothers experienced a change in trends in adverse birth outcomes in November 2016. Consistent with our hypotheses regarding the racialized harms of Trump’s election, for all non-White mothers except for U.S.-born API mothers, the election corresponds with an increase in the slope of the trend line. For example, among U.S. and foreign-born Hispanic mothers, the monthly preterm birth rate declined in the pre–Trump election period but increased in the post–Trump election period.
There are so many things that are wrong in that short paragraph. They’re drawing lots of strong claims based on these super-noisy slope estimates, and they seem to be working really really hard to push the story that something different is happening among nonwhites, even though the general patterns are similar for all groups. Also, no, there’s no evidence in the graph that anything happened in November 2016. Choose a different month and you’d also see varying slopes and discontinuities. Ummm . . . let me show you using a simple simulation:
par(mfrow=c(4,2), mar=c(3,3,1,1), mgp=c(1.7,.5,0), tck=-.01)
T <- 72
x <- 1:T
before <- x < 48
for (k in 1:8){
  y <- rnorm(T, 0, 1)
  fit_before <- coef(lm(y ~ x, subset=before))
  fit_after <- coef(lm(y ~ x, subset=!before))
  plot(x, y, cex=.5)
  curve(fit_before[1] + fit_before[2]*x, from=1, to=48, col="blue", add=TRUE)
  curve(fit_after[1] + fit_after[2]*x, from=49, to=T, col="blue", add=TRUE)
  abline(v=49, lty=2)
}
The data are completely random but otherwise I'm doing what was done in the above graph, taking six-year monthly time series and fitting separate curves to the first four years and last two years.
Here's what comes up:
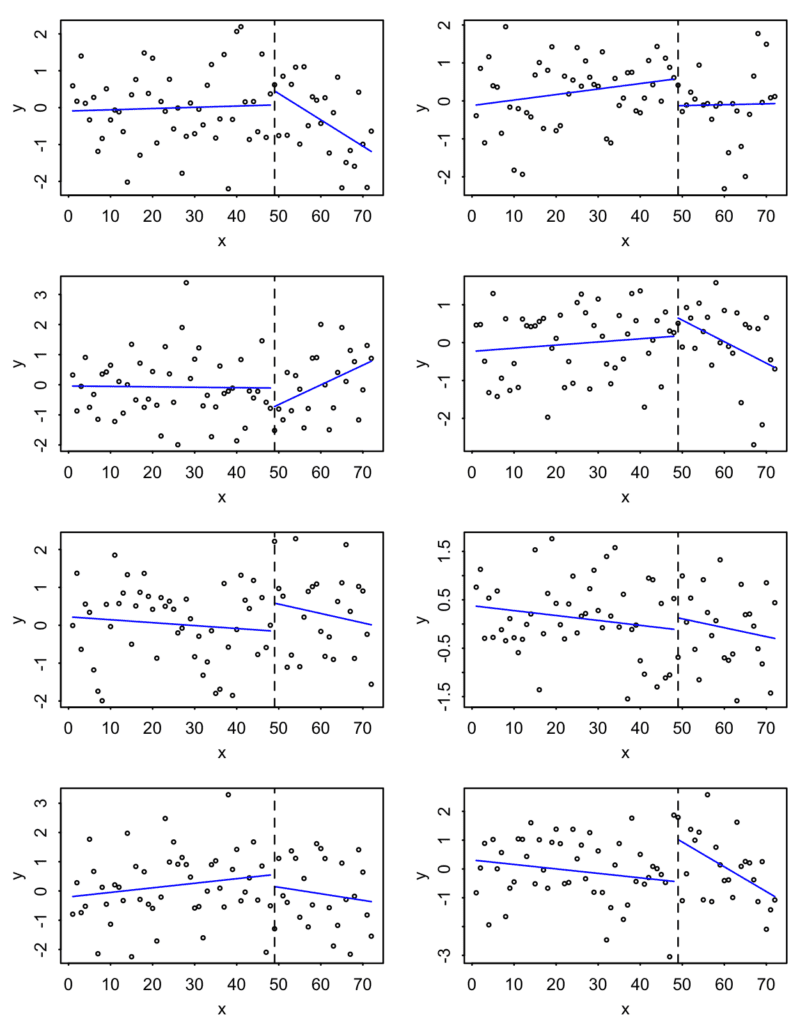
So, yeah, you see apparent discontinuities, as you would wherever you divide the data. The big difference is that the graph in the published paper showed similar trends for all 8 groups--but that works against their claim that the changes are "racialized."
I suppose that the authors might defend themselves from the above criticism by saying that their discussion above was just from their descriptive analysis, and that the meat of their paper is in their regression models. But their interpretation of the regressions have the same problems of reliance on the arbitrary Nov 2016 discontinuity and picking out various comparisons to tell the stories they want to tell, for example, "for API and Hispanic mothers, Trump’s election was more harmful for foreign-born mothers than for their U.S.born counterparts." The estimates have standard errors which I don't think have much meaning in the context of all the unmodeled trends in the data--a point they briefly mention on page 20 without much reflection on its impact on all their earlier reported results.
I don't think the authors would think of this paper as a hack job--I expect they view themselves as objective scientists--but when they make a statement such as "We find that rates of low birth weight and preterm births increased for Black, Hispanic, and API mothers in the two years following Trump’s 2016 election," even though their own discontinuity graphs show increases among Whites at that time, I have little choice but to include that this is a politicized version of the sort of "story time" we've seen so much of in the social sciences.
At this point you might ask: What would I want the authors and journal to have done? I'd start with the plots of the raw data, but without the discontinuities or those ridiculous lines. Beyond that, present what you've got without the storytelling and the selection of subsets. If you want to write something with a political agenda, fine, but then separate that from the empirical claims. Maybe such an article wouldn't be published in Demography, as it wouldn't hit the sweet spot of scientism + desired political conclusion . . . but maybe it's ok not to publish there.
Why write this post?
Why did I go to the trouble of writing all this? Not because this particular paper deserved all this attention; indeed it seems to have received minimal press. And I have nothing against the authors, who I'm sure are just doing their best; unfortunately, a lot of academic work in public health, public policy, and social science has this political feel. Rather, what interests me is how this sort of paper with weak science and a crude political agenda can get published in legitimate journals. I have some theories about this, which will appear in an upcoming post. But first I needed to get this post out of the way so I could refer to this particular study.
Also, I like that R example above. It's good to be reminded of how helpful a quick simulation can be.
In terms of an exploratory study, wouldn’t it be better to fit a single regression line (or nonlinear fit) without the discontinuity and then examine the residuals to see if there is a systematic change and when it occurs? As you’ve indicated a number of times, I also find these discontinuities unconvincing. It seems to me that it makes more sense to start without a discontinuity and then see if (and when) one becomes apparent.
An interesting exercise with data like this, for amusement if nothing else, would be to vary the discontinuity and compare the results for each side of the discontinuity. Does the proposed “treatment” discontinuity generate a substantially larger change than the others?
It’s considerate of you to suggest that these folks are doing their best, but if that’s the case, how did they ever get the idea that such an idiotic claim could possibly be true? Do they have a science education or not? If they do, some serious shade should be landing on the “research” establishment that put these people in a position to believe such a stupid claim, not to mention the undergrad programs they came from.
I like your random example, but I still think using their data to show that the discontinuity is meaningless would be much more powerful. They have monthly increments over six years right? So run the discontinuity analysis every three or even six months over that period for a few of the categories. Also I think you’d have to show that the discontinuity is not sensitive to the minimum unit. So you’d have to show that, if you ran the discontinuity at every month ±6mo from the proposed “treatement” increment, that the proposed treatment would still have a substantially larger effect than the other monthly intervals.
Another obvious flaw is that policy changes that vary how different medical conditions are counted seem to be ongoing constantly, so even if a disconinuity held up to rigorous scrutiny by varying the “treatement” date, there would have to be a substantial effort to account for any of tens to thousands of other factors that could drive it.
Assuming there is a Trump-driven trend, setting the discontinuity point in November 2016 would *underestimate* the effect, given that Trump didn’t take office until January 2017 (i.e. some of the pre-Trump “normal” would dilute the true Trump time). It would make more sense to set the break-point at the implementation of some specific legislation or executive order. But that would introduce a lot of researcher degrees of freedom. I like Dale’s suggestion of looking at the residuals, but again there can be bias in terms of deciding when the discontinuity “becomes apparent”.
The thing is, there are segmented regression techniques that will choose the breakpoint for you, based on the data. So, why not do that and work backwards? Probably, each regression will get different breakpoints with no clear pattern. Well, that’s a meaningful negative result: the data are too noisy to derive a strong conclusion. (And let’s face it, kind of expected: many different factors besides the president feed into public health outcomes). And I suppose it’s a lot less likely to get published.
If each segmented regression had a breakpoint around the same time point, and the slopes were vastly different before and after the breakpoints, and if there were a clearly identifiable public health change around that point, then the results would be greatly suggestive. But that’s a lot of ifs.
The very first thing we covered in regression discontinuity in my causal inference class is that time can NEVER be the forcing variable. The timing of events is never exogenous or random and before the treatment is administered, people form expectations about the treatment and act accordingly.
The R snippet above isn’t replicating the procedure from the paper, though, which features explicit parameters corresponding to the discontinuity (eqs 1 & 2). The figures thereby provide an “observation” of a discontinuity, but not a “test” of a discontinuity, and given political discourse at the time it seems very plausible to me that the resolution of a major election *does* correspond to a discrete event in the “macro-political environment… that Trump’s election disrupted”, producing both a discrete jump in an outcome variable at a point as well as a cumulative effect in whatever underlying process that manifests as a change in slope.
Modifying the snippet to include the pre-post indicator variable as both a main and interaction effect:
par(mfrow=c(2,1))
T <- 72
x <- 1:T
before <- x < 48
b4 <- before * 1
fit_lm <- function(){
y <- rnorm(T, 0, 1)
fit |t|)”]
}
nrep <- 1E5
pvals ks.test(x = pvals[,”b4″], y = punif)
Asymptotic one-sample Kolmogorov-Smirnov test
data: pvals[, “b4″]
D = 0.001908, p-value = 0.8598
alternative hypothesis: two-sided
> ks.test(x = pvals[,”b4:x”], y = punif)
Asymptotic one-sample Kolmogorov-Smirnov test
data: pvals[, “b4:x”]
D = 0.0024631, p-value = 0.5788
alternative hypothesis: two-sided
)
(of course this is not robust to other difficulties inherent to time series, eg confounding due to temporal autocorrelation. If we swap a y <- cumsum(rnorm(length(x))) in for the y assignment, we get: https://i.imgur.com/aCSqe62.png w/ obviously very significant ks.test()s. But that's not a regression discontinuity error, that's a time series modeling error)
(also, probably good not to mask variables like base::T in R — confused me for a sec w/ my syntax highlighting :p)
I’m guessing that the blog mangled your code due to use of angle brackets etc. I find it’s usually best to just point people at a github gist: https://gist.github.com/
ack sorry about that — can never remember if this blog uses eg markdown, and also what the code block syntax is for markdown. Didn’t want to experiment because you can’t edit posts — it even ate my imgur link! Hadn’t ever heard gist.github… will keep it mind going forward (normally use pastebin eg in comments here a few days ago: https://statmodeling.stat.columbia.edu/2024/07/31/age-gap-between-spouses/)
Can try using the apostrophe / tick format below; otherwise here is a gist: https://gist.github.com/NikVetr/ee902447e9cc7cbe56dadc75f0ad7ce1 and here is the output: https://i.imgur.com/gUbIspa.png
(and ftr my preferred approach here with n=72 is kriging — probably compose a squared exponential and periodic kernel to start)
“`
N <- 72
x <- 1:N
before <- x < 48
b4 <- before * 1
fit_lm <- function(){
y <- rnorm(N, 0, 1)
fit |t|)”]
}
nrep <- 1E5
pvals <- do.call(rbind, parallel::mclapply(1:nrep, function(i) fit_lm(), mc.cores = 12))
par(mfrow=c(4,1))
for(i in 1:ncol(pvals)){
hist(pvals[,i], breaks=50, main=paste0(colnames(pvals)[i], " ks-test p-val = ", round(ks.test(pvals[,i], punif)$p.val, 2)), xlab= "p-value")
}
“`
hmm well it now looks to have eaten my follow-up comment to this, which had the code in a link: gist.github.com/NikVetr/ee902447e9cc7cbe56dadc75f0ad7ce1
maybe the secret is not including the protocol and subdomain so it remains plain text and doesn’t automatically generate a hyperlink?
it also ate the imgur links with the actual plots D:
long story short, though, I’d probably go with kriging in this case w/ n=72, composing squared exponential and periodic kernels
People who do this kind of thing should simply run a loess through the data, with different widths (aka “span” or percentage of the data that’s included in the local fit). A good idea might be something like 0.5, 0.2, 0.1, 0.05.
As you make the window narrower, the behavior of the loess fit around the supposed transition is affected less and less by things that are “far away” in time from the region around the supposed transition.
If there’s something “going on” at the transition, the Loess fit will show some kind of fast-changing response, the location isn’t imposed by the researcher, and the result would be convincing if multiple different groups all had “something happening” in approximately the region around a certain time period.
On the other hand, if you do this exercise in this data, you will find… not that.
I looked at the article to see if the data was available, and it’s restricted use government data, so the answer is no. But if the researchers want to be more convincing they could run a series of loess curves through the real data with different scale/width/span settings and show the curves.
I like this idea and it is what I had in mind, but much better described. The worst thing about these discontinuity models (in my mind) is that the transition is either imposed or derived via some statistical test. If the transition is something real, it should be discoverable through an appropriate exploratory analysis such as what you suggest.
As for the data, I believe it is publicly available. See https://www.cdc.gov/nchs/data_access/vitalstatsonline.htm. The only restricted use data I can see is for the older data sets. I’ve used this type of birth data – fairly detailed birth data is available for all births each year (several million each year). It would take some work to assemble to match what they did in the paper (if a match is possible), but in theory this should be doable. For that matter, I don’t see why they don’t provide access to the data they used, since invariably there is some preparation they did that will make an exact replication difficult.
Dale Lehman helpfully wrote:
“As for the data, I believe it is publicly available.”
For years and years, despite the ridicule, I have maintained that the word, “data,” requires the singular form of the verb because, although we write “data,” we are using an ellipsis and we really mean “data set” so that “data” is not a noun, but rather, is an adjective–noting that a collective noun (such as set) in the United States takes a singular verb:
“Congress is in session.”
in contrast, in the UK, a collective noun takes a plural verb. For example,
“Parliament are in session.”
Usually, I am criticized because most of the critics having learned some Latin, resort to the pretentious word “datum” as the proper singular version of data. In case you have nothing better to do with your time, the proper plural of “datum” in the field of geodesy is “datums.”
I get your UK/US point, and as a from-birth speaker of UK English who employs quite a lot of Americanisms because they are generally “cleaner”, I approve of using the singular rather than the plural for things like “England crashes out of tournament”.
However, it turns out that in the specific case of Parliament, the standard UK confusion about whether an institution should be referred to in the singular or plural does not seem to apply. To the best of my knowledge, all media and other writing refers to the UK Parliament in the singular.
Andrew wrote:
“unfortunately, a lot of academic work in public health, public policy, and social science has this political feel”.
Although progressives activists dominate much of the social sciences, I strongly contend that they are most firmly entrenched in sociology where the political spectrum ranges from Left to Far Left. Economists and political scientists are far more serious.
All three authors of this paper have their doctorates in sociology. Given the all-pervasive leftist bias in sociology – and severe consequences for deviating from it – with few exceptions, sociologists have lived in an environment where non-leftist views are not deemed worthy of serious consideration. When they are given any hearing, they are presented weakly or misrepresented – to ensure their immediate dismissal.
Perceptive undergraduate students have observed that sociology has become a political tool of the Left. They start with a conclusion (i.e. America is systemically racist), and then find evidence that they think backs it up.
Recently a tiny but growing number of established sociologists, including John Iceland and Arthur Sakamoto, have put forward this argument:
https://link.springer.com/article/10.1007/s11186-024-09568-1
https://www.wipsociology.org/2018/05/26/are-asian-americans-disadvantaged-by-white-privilege/
In his 2023 resignation letter from the American Sociological Association, the exceedingly distinguished sociologist, Jonathan Turner, remarked that, driven by ideology and activism, sociology has “self-destructed”, and “something like sociology will have to be rebuilt again, by another name”.
Jon Turner’s personal politics are left of center. In 2024, the respected sociologist Alexander Riley published the following hard hitting critique of sociology.
https://www.jamesgmartin.center/2024/07/teaching-sociology-is-an-ideological-nightmare/
https://www.nas.org/academic-questions/37/2/the-warped-vision-of-contemporary-sociology
https://americanmind.org/salvo/sociologys-descent-into-woke-satire/
According to Professor Riley
“Today’s sociology is so patently devoid of any intellectual rigor that most of it evokes only contemptuous laughter. The arguments advanced, the “evidence” mustered to support its partisan claims, are so weak that it is genuinely amazing to realize that the people making these cases have spent many years in educational institutions and yet have come away from all that with either no understanding of or an utter contempt for careful and rigorous argument.”
Although I believe Professor Gelman (and presumably most the readers of his blog) do not share the political views of the websites on which this work was published, I hope you all judge Professor Riley’s conclusion worthy of serious consideration, and also consider the relation of sociology to the more serious social science disciplines.
(I have an MS Degree in Demography from Wisconsin and remained friends with my advisor, Franklin Wilson, until he died in 2020. He stood by me once when I encountered objections for proposing a politically incorrect position on ‘the welfare magnet debate’. At that time, I had enough sense then to leave that contentious topic to the economists who approached it with greater precision and superior statistical methods.
Over the years Franklin and I met when the ASA meetings were in New York and spoke by phone about I various issues – affirmative action, theoretical developments in migration and urbanization, the Bell Curve, local zoning regulations, statistical versus algorithmic approaches, non-academic careers, etc. I guessed he was a centrist Democrat and assume he sensed I was to his right, but we never once discussed politics. We shared an interest in applying social research and sound statistical methods – we differed here – to addressing social problems. Below is his obituary. Franklin fully embodied what the great economist Glenn Loury called the “Development Narrative” – as opposed to the ‘Bias Narrative”)
https://www.cressfuneralservice.com/obituaries/franklin-wilson
Andrew wrote that this paper has received minimal press.
It has been the number one top trending article on Demography over the past 14 days. Red meat for the fans.
https://news.berkeley.edu/2024/07/25/after-trumps-election-women-of-color-had-more-underweight-premature-babies-study-finds/
Joey:
Yeah, I was counting that press release as part of the “minimal press.” The study was featured in a press release, and . . . that was about it.
I looked at the webpage for the journal Demography and here’s the list of most-read papers:
And their list of most-cited papers:
There are some interesting differences between these lists. The most-read papers all look, based on their titles, like exercises in identifying politically-salient disparities, “red meat for the fans,” as you put it. The most-cited papers look more serious and more traditionally demographic in topic.
I think someone with access to the data should look into this.
1. It’s a demography journal, not a public health journal
2. There are reasons to consider effects of stressful events on birth outcomes at the point of birth rather than conception, and previous research cited in the paper has found effects of Trump’s election on birth outcomes for some mothers. Stress affects birth outcomes!
3. Agree the figures reproduced here are not good but the paper has a lot more analysis, including alternative specifications of the timing and variables in appendices.
So you might be right, and I haven’t gone through it all, but there isn’t enough here for me to conclude the paper is nonsense. I’ve been through review at Demography many times and it’s always been rigorous.
Philip:
I can believe that Demography is usually a rigorous journal but that they can also publish bad papers that push a favored political agenda.
I say this for two reasons. First, it’s my impression that Lancet is usually a rigorous journal but it’s notorious for publishing bad papers that push a favored political agenda. So this sort of thing can happen. Second, publication is a crapshoot—it depends on what editor handles your paper and on what reviewers they get. So it could be that the authors of this particular paper happened to get lucky and get an editor and reviewers who had some combination of political activism and low standards that allowed the paper to get through the review process.
I agree bad papers happen to good journals! It just gave me pause. I spent a little time looking at time series methods yesterday, and now have more confidence that I don’t have the knowledge to judge how this should be done (though clearly the figure you posted is not the way to go). I also looked back at the first article (I think) to find Trump-election effects on Latina preterm births, and it seems more persuasive to me. It’s here: https://jamanetwork.com/journals/jamanetworkopen/fullarticle/2738344. This uses an expected-births approach based on a simple model with only non-preterm and non-Latina births as controls. It also cites a bunch of reasons you might see birth outcome effects from this particular kind of stress, and looks more specifically at timing within pregnancy. (One critique is the Demography paper should have explained why their method was preferable, and what they added, because I don’t see that.)