Shane Frederick, who sometimes sends me probability puzzles, sent along this question:
Among married couples, what’s your best guess about how often the wife is taller than the husband?
• 1 in 10
• 1 in 40
• 1 in 300
• 1 in 5000
I didn’t want to cheat so I tried to think about this one without doing any calculations or looking anything up. My two sources of information were my recollection of the distributions of womens’ and mens’ heights (this is in Regression and Other Stories) and whatever I could dredge up from my personal experiences with friends and couples I see walking on the street.
I responded to Shane as follows:
I’m embarrassed to say I don’t know the answer to this question of yours. I’d guess 1 in 10, but I guess that 1 in 40 is not entirely out of the question, given that the two heights are positively correlated. So maybe I’d guess 1 in 40. But 1 in 10 is not out of the question…
Shane responded:
It’s roughly 1 in 40 if you assumed non assortative mating (just randomly picked men and women from the respective height distribution of men and women).
In reality, it is closer to 1 in 300. (Women don’t like shorter men; men may not like taller women, and shorter men don’t marry as often, in part because they earn less.)
1 in 300 didn’t sound right to me. So I did some calculating and some looking up.
First the calculating.
compare_heights <- function(mu, sigma, rho, n=1e6){
  Sigma <- diag(sigma) %*% cbind(c(1,rho), c(rho, 1)) %*% diag(sigma)
  library("MASS")
  heights <- mvrnorm(n, mu, Sigma)
  p_wife_taller <- mean(heights[,1] > heights[,2])
  cat("Assuming corr is", rho, ":  probability the wife is taller is", p_wife_taller, ":  1 in", 1/p_wife_taller, "\n")
}
mu <- c(63.7, 69.1)
sigma <- c(2.4, 2.9)
options(digits=2)
for (rho in c(0, 0.3, 0.5, 0.7)){
  compare_heights(mu, sigma, rho)
}
And here's the output:
Assuming corr is 0 :  probability the wife is taller is 0.076 :  1 in 13
Assuming corr is 0.3 :  probability the wife is taller is 0.044 :  1 in 23
Assuming corr is 0.5 :  probability the wife is taller is 0.022 :  1 in 45
Assuming corr is 0.7 :  probability the wife is taller is 0.0052 :  1 in 191
Using simulation here is overkill---given that we're assuming the normal distribution anyway, it would be easy enough to just compute the probability analytically using the distribution of the difference between husband's and wife's heights (from the numbers above, the mean is 69.1 - 63.7 and the sd is sqrt(2.4^2 + 2.9^2 - 2*rho*2.4*2.9), so for example if rho = 0.5 you can just compute pnorm(0, 69.1 - 63.7, sqrt(2.4^2 + 2.9^2 - 2*0.5*2.4*2.9)), which indeed comes to 0.22.)---but brute force seems safer. Indeed, I originally did the simulation with n=1e4 but then I upped the draws to a million just to be on the safe side, since it runs so fast anyway.
A correlation of about 0.5 sounds right to me, so the above calculations seems to be consistent with my original intuition that the probability would be about 1 in 10 if independent or 1 in 40 accounting for correlation.
Next, the looking up. I recalled that sociologist Philip Cohen had posted something on the topic, so I did some googling and found this press release:
The average height difference between men and women in the U.S is about 6 inches. . . . Cohen also analyzed the height of 4,600 married couples from the 2009 Panel Study of Income Dynamics and found that the average husband's height was 5'11" while the average wife was 5'5". Moreover, he found that only 3.8 percent of the couples were made up of a tall wife and a short husband . . .
Fiona Macrae and Damien Gayle of the Daily Mail picked up this story and compared it to similar research on couples in the U.K, where they found that for most couples - 92.5 percent - the man was taller.
Hmmm . . . 5'5" and 5'11" are taller than the numbers that I'd been using . . . perhaps the people in the PSID were wearing socks?
I also found this post from Cohen based on data from the 2017 wave of the PSID. He supplies these graphs:

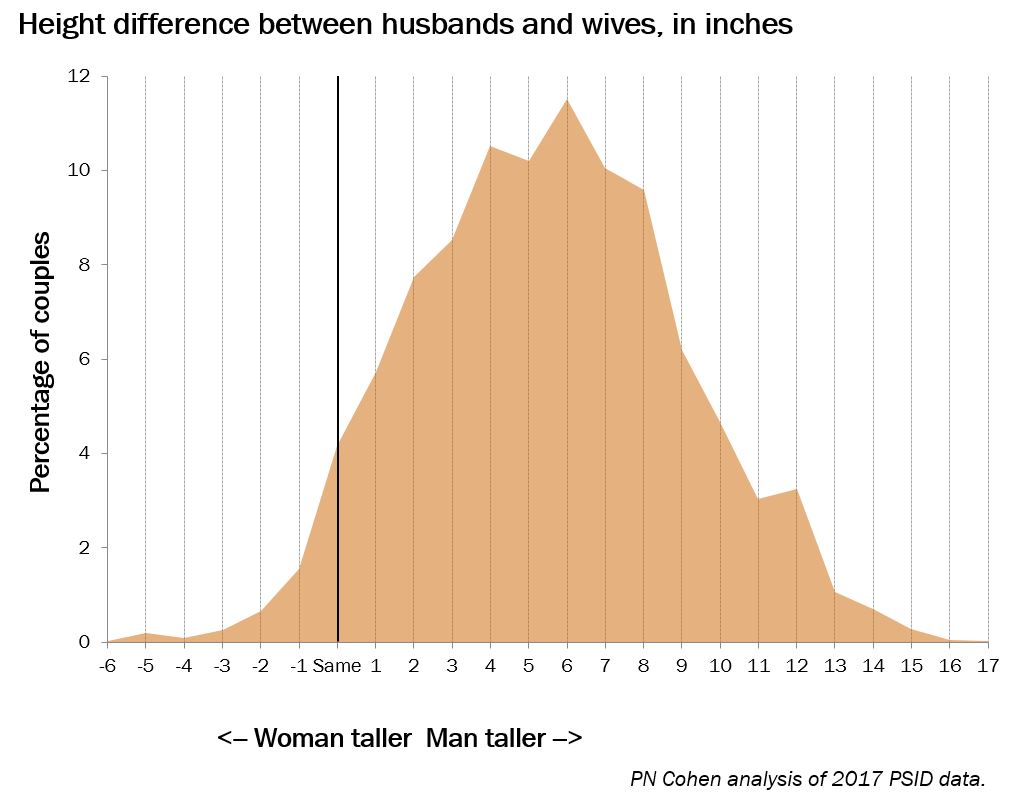
There's something weird about these graphs---if heights are given to the nearest inch, they should be presented as histograms, no?---but I think we can read off the percentages.
If you round to the nearest inch, it appears that there is a 4% chance that the two members of the couple have the same height, a 3% chance that the wife is taller, and a 93% chance the husband is taller. So for discrete heights, the probability the wife is taller is approximately 1 in 30. If you allow continuous heights and you allocate a bit less than half the ties to the "wife taller than husband" category, then the probability becomes something like 1 in 25.
Given all this, I wondered how Shane could ever had thought the frequency was 1 in 300. He replied that he got his data from this paper, "The male-taller norm in mate selection," published in Personality and Psychology Bulletin in 1980, which reports this:
Just as an aside, I find it a bit creepy when researchers use the term "mate" when referring to married couples. Wouldn't "spouse" be more appropriate? "Mate" has this anthropological, scientistic feel to it.
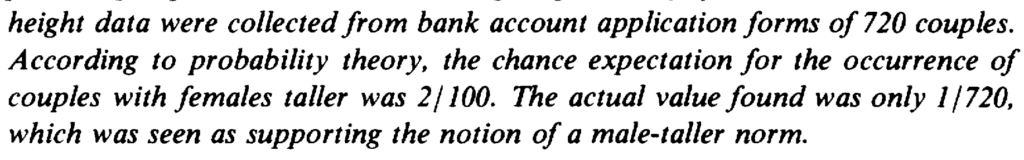
To return to the substance, there are two mysteries here. First, how did they calculate that the probability of the woman being taller should be only 2%? Second, how is it that only 1 of 720 of their couples had the wife taller than the husband?
The answer to the first question is supplied by this table from the 1980 paper:

Their standard deviations (2.3" within each sex) are too low. That sort of thing can happen when you try to estimate a distribution using a small and nonrepresentative sample. They continued by assuming a correlation of 0.2 between wives' and husbands' heights. I think 0.2 is too small a correlation, but when you combine it with the means and standard deviations that they assumed, you end up getting something reasonable.
As to the second question . . . I don't know! Here's what they say about their data:

My best guess is that people did some creative rounding to avoid the husband's recorded height being lower than the wife's, but it's hard to know. I don't fault the authors of that paper from 1980 for using whatever data they could find; in retrospect, though, it seems they were doing lots of out-of-control theorizing based on noisy and biased data.
I did some more googling and found this paper from 2014 with more from the Panel Study of Income Dynamics. The authors write:
Height was first measured in the PSID in 1986 and then at every wave starting in
1999. . . . In 1986, 92.7% of men were taller than their spouses; in 2009, 92.2% were taller.
They break the data up into couples where the husbands is shorter than the wife and couples where they are the same height. In 1986, 3.14% of husbands were shorter and 4.13% were the same height. In 2009, 3.78% were shorter and 4.00% were the same height. From these data, if you include something less than half of the "same height" group, you'll get an estimate of approximately 5%, or 1 in 20, couples where the wife is taller than the husband.
So, yeah, between 1 in 10 and 1 in 40. Not 1 in 300.
To be fair to Shane on this one, this was just an example he used in one of his classes. It's an interesting example how it's easy to get confused if you just look at one source, reminiscent of some examples we've discussed earlier in this space:
- What is Russia's GDP per capita?
- The contradictory literature on the effects on political attitudes of having a son or daughter.
- Various claims about the relation between age and happiness.
All these examples feature contradictory claims in the literature that are each made very strongly. The problem is not so much in the disagreement---there is legitimate uncertainty on these issues, along with real variation---but rather that the separate claims are presented as deterministic numbers or as near-certain conclusions. Kinda like this notorious story from Hynes and Vanmarcke (1977) and retold in Active Statistics:

Shane summarizes:
The general message has become even more cynical; transmogrifying from “You can’t trust everything you read,” to “You can’t trust anything you read.”
I wouldn't quite put it that strongly; rather, I'd say that it's a good idea to find multiple data sources and multiple analyses, and don't expect that the first thing you find will tell the whole story.
I feel somewhat compelled to point out an issue with the language here:
Among married couples, what’s your best guess about how often the wife is taller than the husband?
Where the language reflects no consideration of same sex marriages.
I mean using “wife” and “husband” sort of addresses the problem (I don’t know how many same sex couples use those terms) but not really.
Kind of reminds me of the riddle that ends with “I can’t operate on him, he’s my son.” – which I hear no longer stumps younger people.
I mean it’s not relevant to the statistics and for me isn’t really a big deal but it probably wouldn’t be a bad idea to be more specific with the language.
Agreed, as a member of a married couple that consists of two husbands and no wives, the language is mildly annoying though the intended meaning is clear in context. On the other hand, there is also a kind of quaintness to it, like reading older papers that exclusively use masculine pronouns to refer to generic hypothetical people.
Also, considering same-sex couples adds some interesting statistical wrinkles since the distribution of within-couple height differences would more clearly reflect any correlations between partner heights.
To add another interesting statistical variance, consider that apparently only married couples are considered as opposed to those who co-habitate? Could we use degree of height variance between partners to predict whether they’re married or co-babitate? :-)
Joshua:
Data are available on male/female married couples; see links in above post. It should also be possible to find data on cohabitating couples . . . less data, but probably something. Indeed, I think that PSID has some such data. Once we start going that route, it would be interesting to see how these things vary by cohort. My guess is, not much. But that’s just my guess.
Gec:
There must also be some survey data on married and cohabiting same-sex couples. A quick google turns up this page from the census. Nothing about height, but lots of other interesting things there.
Kind of reminds me of the riddle that ends with “I can’t operate on him, he’s my son.” – which I hear no longer stumps younger people.
When I was young, long enough ago that kids played Cowboys and Indians shooting each other, people got stumped by this version: A big Indian and a little Indian were walking along a road. The little Indian was the big Indian’s son, but the big Indian wasn’t the little Indian’s father. Who was the big Indian.
How often are tops taller than their bottoms?
There’s published research on the topic. (I found from google search; no opinion offered on the quality of the work.)
Mao marveling at the height of Kissinger’s wife
https://www.reddit.com/r/redscarepod/comments/17mdm2f/mao_marveling_at_the_height_of_kissingers_wife/
Gotta get the nudgelord into the picture somehow (it’s here, you just have to scroll down a bit).
Andrew–
I’m wondering where you got your figures for average height and standard deviations for your simulation. The numbers all seem to be in the ballpark, but the means are curiously precise; and, why do you think the female SD is noticeably smaller than that for males? Because the SD is correlated with the mean?
I would also expect male and female distributions for the whole population to *not* be the same as the distributions for married couples– I would expect a lower probability of marriage for individuals at the extremes of the height distribution, which would lower the SD, and perhaps raise the mean if the lowering of probability was not symmetric about the mean.
I have a bunch of data on heights of college students from years of statistics labs, and now I’m tempted to go back and compile the averages and standard deviations for the two sexes!
(Cohen’s graphs are just standard frequency polygons, no?)
Gregory:
I took the numbers from this article: Brainard, J., and Burmaster, D. E. (1992). Bivariate distributions for height and weight of men and women in the United States. Risk Analysis 12, 267–275.