Daniel Lakeland writes:
This one deserves some visibility, because of just how awful it is. It goes along with the adage about incompetence indistinguishable from malice. It’s got everything..
1) Non-statistical significance taken as evidence of zero effect
2) A claim of non-significance where their own graph clearly shows statistical significance
3) The labels in the graph don’t even begin to agree with the graph itself
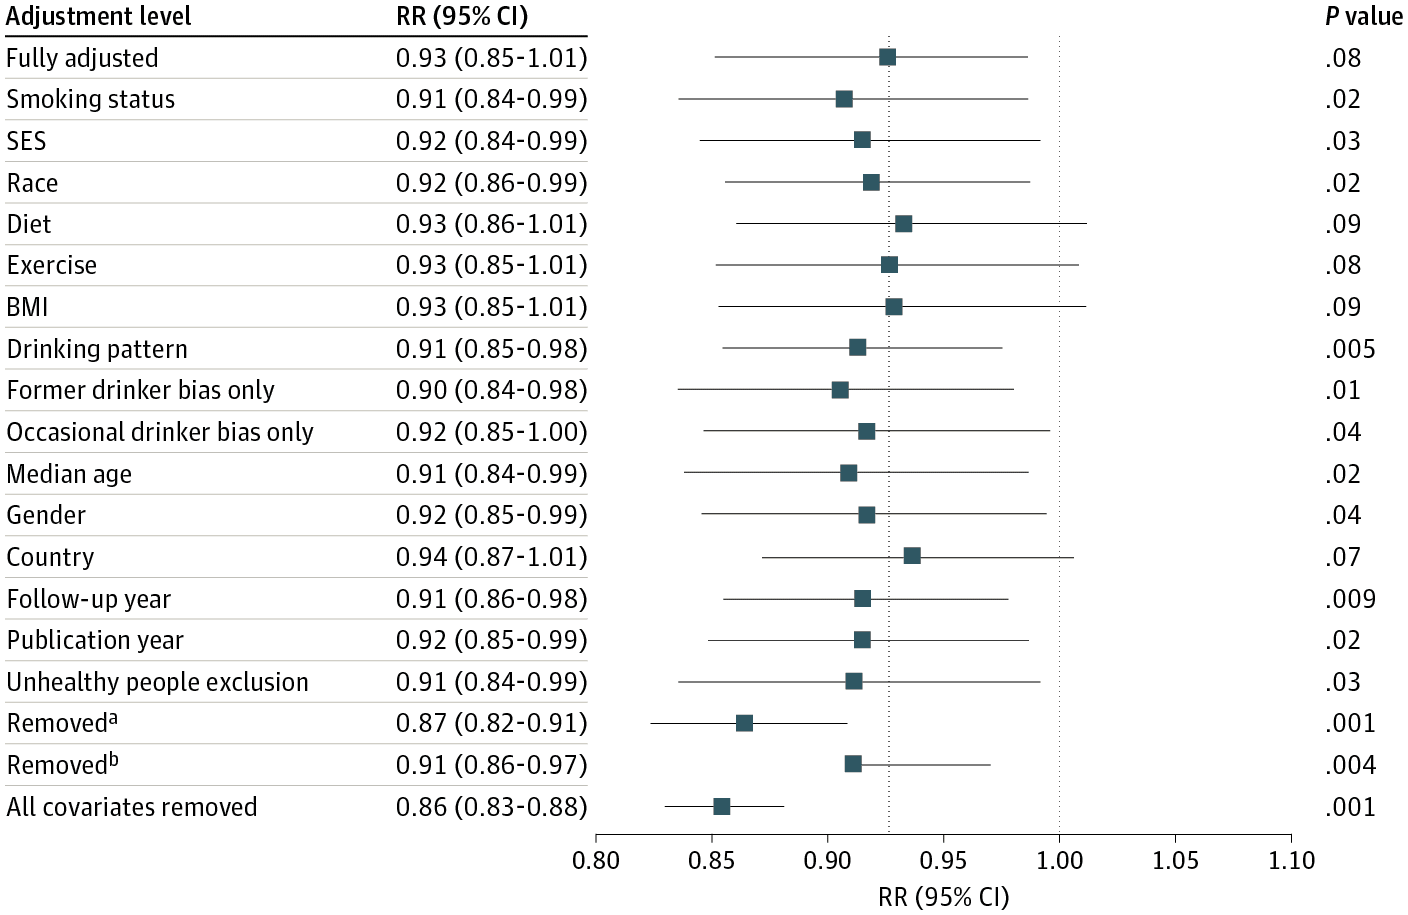
4) Their “multiverse” of different specifications ALL show a best estimate of about 92-93% relative risk for moderate drinkers compared to non-drinkers, with various confidence intervals most of which are “significant”
5) If you take their confidence intervals as approximating Bayesian intervals it’d be a correct statement that “there’s a ~98% chance that moderate drinking reduces all cause mortality risk”
and YET, their headline quote is: ” the meta-analysis of all 107 included studies found no significantly reduced risk of all-cause mortality among occasional (>0 to <1.3 g of ethanol per day; relative risk [RR], 0.96; 95% CI, 0.86-1.06; /P/ = .41) or low-volume drinkers (1.3-24.0 g per day; RR, 0.93; /P/ = .07) compared with lifetime nondrinkers." Above the take-home graph, figure 1. Take a look at the "Fully Adjusted" confidence interval in text... (0.85-1.01) now take a look at the graph... clearly doesn't cross 1.0 at the upper end. But that's not the only fishy thing, removed_b is just weird, and the vast majority of their different specifications show both a statistical significant risk reduction, and approximately the same magnitude point estimate ... 91-93% of the nondrinker risk. Who knows how to interpret this graph / chart. It wouldn't surprise me to find out that some of these numbers are just made up, but most likely they're some kind of cut-and-paste errors involved, and/or other forms of incompetence. But if you assume that the graph is made by computer software and therefore represents accurate output of their analysis (except for a missing left-bar on removed_b perhaps caused by accidentally hitting delete in a figure editing software?), then the correct statement would be something like "There is good evidence that low volume alcohol use is associated with lower all cause mortality after accounting for our various confounding factors." The news media reports this as approximately "Moderate drinking is bad for you after all."
I guess the big problem is not ignorance or malice but rather the expectation that they come up with a definitive conclusion.
Also, I think Lakeland is a bit unfair to the news media. There’s Yet Another Study Suggests Drinking Isn’t Good for Your Health from Time Magazine . . . ummm, I guess Time Magazine isn’t really a magazine or news organization anymore, maybe it’s more of a brand name? The New York Times has Moderate Drinking Has No Health Benefits, Analysis of Decades of Research Finds. I can’t find anything saying that moderate drinking is bad for you. (“No health benefits” != “bad.”) OK, there’s this from Fortune, Is moderate drinking good for your health? Science says no, which isn’t quite as extreme as Lakeland’s summary but is getting closer. But none of them led with, “Latest observational study shows moderate drinking associated with a very slightly lower mortality rate,” which would be a more accurate summary of the study.
In any case, it’s hard to learn much from this sort of small difference in an observational study. There are just too many other potential biases floating around.
I think the background here is that alcohol addiction causes all sorts of problems, and so public health authorities would like to discourage people from drinking. Even if moderate drinking is associated with a 7% lower mortality rate, there’s a concern that a public message that drinking is helpful will lead to more alcoholism and ruined lives. With the news media the issue is more complicated, because they’re torn between deference to the science establishment on one side, and the desire for splashy headlines on the other. “Big study finds that moderate drinking saves lives” is a better headline than “Big study finds that moderate drinking does not save lives.” The message that alcohol is good for you is counterintuitive and also crowd-pleasing, at least to the drinkers in the audience. So I’m kinda surprised that no journalistic outlets took this tack. I’m guessing that not too many journalists read past the abstract.
I downloaded the pdf of the article and neither of the issues you refer to are actually as you describe. The “Fully Adjusted” confidence interval clearly does cross 1.0 at the upper end, and the left bar on removed_b is not missing.
Perhaps the figure was corrected subsequent to original publication…
Indeed the article claims to have been corrected in May – but I can’t find anything stating what corrections were made nor can I find the original uncorrected version. So, I wonder if these issues are related to the 6 month time lag Andrew has for blog postings.
Here is the correction: https://jamanetwork.com/journals/jamanetworkopen/fullarticle/2804662
The figure was literally a screenshot from the PDF as published, so yes they did modify this figure in May apparently.
I thought the latest medical thought here was that observational studies of drinking are faulty because enough folks who don’t drink don’t drink for medical reasons (including addiction problems) and thus not drinking at all is selectional for early mortality.
And that any amount of drinkiing was bad for you.
That made sense to me. Of course, I’m now known for extreme radical positions…
(The latest WHO decision to list aspartame as a potential carcinogen was based on similar faulty reasoning: some folks with weight problems are trying to do something about it, some of those are drinking diet coke, and some of those are failing at weight control for other reasons. Thus aspartame has an observational study relation to early death. But it ain’t due to the aspartame, which as the FDA pointed out, is one of the most thoroughly tested food addtives we have; you can’t kill rats with it no matter how much you give them.)
My extreme position here is that the reason there are so many faulty studies desperately trying to show that aspartame is bad for you and alcohol is good for you is that there are folks with extremely deep pockets who would find it financially advantageous for those results to be true.
I agree but I wonder why people continually try to prove that caffeine is bad.
Same with tobacco smoke and lung cancer.
Eventually, after ~50 years of trying, it was figured out (~2005) that you have to put a strain known to be particularly cancer prone in a smoke-filled cage, immediately after birth. Then they live in the smoke through adolescence. But then you need to take them out of the smoke environment, and the lung cancer forms when the lung cells divide to heal. If they remain in the smoke their entire life, there is no elevated lung cancer risk.
https://pubmed.ncbi.nlm.nih.gov/15765916/
Indeed, lung cancer risk is highest just after quitting smoking in humans. But quitting is no doubt also correlated with the appearance of health issues. So we can’t say much from that.
Anyway, it could require similar herculean efforts to get aspartame to cause cancer in mice/rats.
David, my position is that not only are there powerful alcohol selling interests who would like you to believe that alcohol is good for you, but there is also a large industry of government employees who are in the business of trying to convince the public that *any* amount of alcohol is bad for you because in truth the number of people significantly affected by alcohol is ~ 3-4% of the population or so and the bad effect on those people is clear and unambiguous and has been known forever (like literally since the invention of agriculture) and doesn’t require hundreds of millions of dollars a year to study.
The budget for the NIAAA in 2023 was $595M
Am I seeing the wrong information that the program budget for NIH is ~$48B? So, like a little over 1% goes to NIAAA?
Something like that yeah. https://www.nih.gov/about-nih/what-we-do/budget
that site says $45B for NIH
I got the NIAAA budget from https://www.niaaa.nih.gov/management-reporting/fy-2023-financial-management-plan
Look at how alcohol consumption is measured in each of the individual studies, and you might feel that the statistical errors aren’t even worth sorting out.
You can’t blame the researchers for the inherent difficulty of precisely quantifying ethanol consumption over a period of years. But you can blame them for drawing the “definitive” conclusions that Andrew alluded to.
Here’s maybe a fairer conclusion: We can’t say anything with confidence about the health effects of moderate drinking. Measurement of consumption is just too flawed in the range from total abstinence to about one to two “drinks” per week, or slightly more. (That includes but is not limited to the misclassification of very, very occasional drinkers as “lifetime nondrinkers.”)
What are these numbers supposed to mean anyeay?
If you live life exactly like a drinker but dont actually consume the alcohol you are ~15% less likely to die than an abstainer?
But if you live like a drinker *and actually drink*, its closer to 5% less likely to die.
> 2) A claim of non-significance where their own graph clearly shows statistical significance
> 3) The labels in the graph don’t even begin to agree with the graph itself
The labels in the graph say RR (95% CI) 0.93 (0.85 – 1.01) and P value .08 – those results are consistent with each other and with the text of the article.
The graph shows an asymmetric interval – unlike every other interval except for another one that also seems wrong – which doesn’t agree with anything.
> Who knows how to interpret this graph / chart.
Maybe a better interpretation is that the upper limit of the interval in the chart is clearly wrong rather than clearly showing statistical significance.
On the subject of observational studies about moderate drinking I wonder if anyone has an informed opinion about the so-called Mendelian randomization studies (using genetic markers as instrumental variables).
For example https://jamanetwork.com/journals/jamanetworkopen/fullarticle/2790520
The ideal thing would be to actually measure alcohol consumption. In the absence of that, the usual method is to do a survey, ie ask people how much they drink.
The mendelian randomization study goes a step further. Now they do not even ask the subjects how much they drink, they take a dna sample.
Earlier, other people were asked how much they drink and the answers were correlated with small genetic variations. Then these correlations are used to “predict” what response the person *would have* given on the survey, if they had actually been asked how much alcohol they consumed.
That is really what it means.
> The ideal thing would be to actually measure alcohol consumption.
The ideal thing would be to decide the dose of alcohol that each experimental subject gets – not letting them choose and measure their consumption.
> The mendelian randomization study goes a step further. Now they do not even ask the subjects how much they drink, they take a dna sample.
The point of imputing how much the drink from genetic markers is not that you don’t even have to ask.
The point is that if you assume that these markers affect their consumption of alcohol but won’t otherwise affect the outcome you can do things that you couldn’t do even if you could actually measure their alcohol consumption.
Perhaps you are right. I guess it amounts to what is the x-axis of figure 2? The caption reads:
Then in the supplemental methods I read:
This sounds ridiculously byzantine to me. But we agree it is not actual alcohol consumption. Is the x-axis self-reported alcohol consumption, predicted consumption based on these allele scores, or something else?
Also, no two cells in the body have the exact same genome. Even worse, I was just looking into this for another reason and found different variants can cycle over space and time. So I question whether these genetic markers are even stable:
https://www.ncbi.nlm.nih.gov/pmc/articles/PMC5999106/
We’d need to look into how the UK biobank collected their DNA samples, and whether they checked for spatial/temporal mosaicism.
This figure has been changed since the originally published version (including in the post here). Besides the problems with the “Fully adjusted” estimate, you can see something really weird about “Removed^b”.
Even setting aside any remaining confounding, this study seems strikingly underpowered. As I wrote when the article came out: “The key CIs are ±10% for all cause mortality. But who would think quite light alcohol consumption would have such a huge effect on all cause mortality?”
So if your prior was a reasonably sized beneficial effect of low-volume alcohol consumption, then it seems like very little updating is required even if you think of drinking being conditionally as-good-as-random here.
Exactly, after this study I shouldn’t think anything different from what everyone has always said for the last 40-50 years which is “light to moderate drinking may have a small protective effect, probably doesn’t have a major detrimental effect, heavy drinking definitely has well known detrimental effects”. The confidence intervals in this study basically are identical to my prior intervals. So the study offers basically no new information.
If you search for reporting on this study I found:
“No Level of alcohol consumption is safe for our health” (WHO: https://www.who.int/europe/news/item/04-01-2023-no-level-of-alcohol-consumption-is-safe-for-our-health)
“Even a little alcohol can harm your health” (NYT: https://www.nytimes.com/2023/01/13/well/mind/alcohol-health-effects.html)
“Is there really no safe amount of drinking?” (Time magazine: https://time.com/6248439/no-safe-amount-of-alcohol/)
“No, moderate drinking isn’t good for your health” (WaPo: https://www.washingtonpost.com/wellness/2023/03/31/moderate-drinking-alcohol-wine-risks/)
None of those headline conclusions are supported by this study.
At the end of the paper, under “Article Information”, there is is a section that reads:
Data Sharing Statement: See Supplement 2.
You can click “Supplement 2” to find a link to a PDF of a “Data Sharing Statement”. All the PDFs says is the citation of the article and:
Data
Data available: No
Of course, individual-level health data is difficult to widely share. However, this is a meta-analysis. I don’t know compelling reasons why the data (which consists of estimates from prior studies and metadata about those studies) isn’t made available.
We all want definite, categorical answers to scientific questions, but we have to accept that this is frequently elusive. A mishmash of observational studies over decades is just not going to produce a noncontroversial answer. The best statistical analysis can not find answers that are not in the data. Well, I was glad to see that a man has to drink more than 45 grams of ethanol daily to have a definite statistically significant increased risk of mortality. My policy of restraining my intake to 40 grams/day is on the money.
The burden of alcohol (liver cirrhosis, traffic fatalities, abuse etc.) may not be part of ‘moderate/occasional’ drinking but just the sheer burden to society cannot be minimized by mostly ‘dubious’ personal health benefits.
I worked as a research scientist at an NIAAA center in Berkeley where most scholars drank moderately, but were uniform in their research outcomes — all drinking on average, lead to lower quality of life for the individual and higher cost to society.
And the legal ones, tobacco and alcohol, are the most addictive and remaining moderate is tough for many. Such ecological costs make medical studies deficient and require public health computing to clear the picture … Here’s one paper we wrote to show the burden of outlet locations on violence production ( https://link.springer.com/chapter/10.1007/978-1-4020-8509-3_7 )
Alcohol is truly problematic for some fraction of the population, and the spillover is considerable, children and spouses of alcoholics, etc. No one should minimize that. But the actual fraction of the population that experiences problematic drinking is what? I tried to quantify that at one point and the data was just awful. For example this graph was posted unironically back in 2014 https://www.washingtonpost.com/news/wonk/wp/2014/09/25/think-you-drink-a-lot-this-chart-will-tell-you/
That chart is I believe based on data from a govt survey of risky behavior. One of the questions on that survey was something like “during the last 30 days how many drinks did you drink on average per day”. There’s a certain population of people who answer 30 and another population who answer 60.
NOONE drinks 60 drinks a day on average every day for 30 days, that would be fatal after a couple of days for even the worst alcoholics who have built up a tolerance. There’s a separate population of people who answered much more clearly numbers like 12 to 18, because as serious alcoholics they carefully titrate their consumption. This is the actual alcoholics. Yet if you just take this data as is, which is what Philip Cook did, these people who clearly answered the question wrong account for some 3-5% of the population and they make up a similar fraction of people as the serious alcoholics.
Clearly what happened was 3-5% of people who drink 1 or 2 drinks per day misunderstood the question and answered their *total* over 30 days rather than the average per day. That’s why the quantity is exactly 1 or exactly 2 times 30 days (these stand out as spikes in the distribution)
A bayesian model that accounted for this clear error in data collection produces a very different view of the role of serious alcoholism when analyzing the same data.
What is far more likely is that 2-3% of the population consumes between say 7 and 20 drinks a day with an average around 10-12 perhaps. These people have serious issues.
The idea that say 25% of the population that consumes 1 or 2 drinks most nights is somehow suffering a serious decrease in quality of life is just not supported by the data.
On the other hand, all the most successful civilizations in history have consumed copious amounts of alcohol. The question from your perspective should be: how did they succeed despite this apparent net burden?
If you have a counter example, I would like to learn more about it.
I believe you have related blog posts outlining the lack of internal consistency content in papers:
(a) Nobody’s Fool post https://statmodeling.stat.columbia.edu/2023/07/14/nobodys-fool-by-daniel-simons-and-christopher-chabris/
(b) Supposedly longitudinal social psych study is 3 days:
https://statmodeling.stat.columbia.edu/2018/04/05/particular-corner-experimental-social-psychology-long-term-3-days-maybe-5-minutes/
It seems like one of the first steps to perform when reviewing/appraising papers is to simply check for internal consistency of claims and evidence (title and abstract -> figures, methods, results sections).
Given that peer review season is arriving, I’d love to synthesize what you’ve blogged thus far into a coherent synthesis for effective peer review. The points above jump out to some, but not many. Scaffolding the process into a system would be a very useful practical next step.