Michael Nelson writes:
I wanted to point out a paper, Stabilizing Subgroup Proficiency Results to Improve the Identification of Low-Performing Schools, by Lauren Forrow, Jennifer Starling, and Brian Gill.
The authors use Mr. P to analyze proficiency scores of students in subgroups (disability, race, FRL, etc.). The paper’s been getting a good amount of attention among my education researcher colleagues. I think this is really cool—it’s the most attention Mr. P’s gotten from ed researchers since your JREE article. This article isn’t peer reviewed, but it’s being seen by far more policymakers than any journal article would.
All the more relevant that the authors’ framing of their results is fishy. They claim that some schools identified as underperforming, based on mean subgroup scores, actually aren’t, because they would’ve gotten higher means if the subgroup n’s weren’t so small. They’re selling the idea that adjustment by poststratification (which they brand as “score stabilization”) may rescue these schools from their “bad luck” with pre-adjustment scores. What they don’t mention is that schools with genuinely underperforming (but small) subgroups could be misclassified as well-performing if they have “good luck” with post-adjustment scores. In fact, they don’t use the word “bias” at all, as in: “Individual means will have less variance but will be biased toward the grand mean.” (I guess that’s implied when they say the adjusted scores are “more stable” rather than “more accurate,” but maybe only to those with technical knowledge.)
And bias matters as much as variance when institutions are making binary decisions based on differences in point estimates around a cutpoint. Obviously, net bias up or down will be 0, in the long run, and over the entire distribution. But bias will always be net positive at the bottom of the distribution, where the cutpoint is likely to be. Besides, relying on net bias and long-run performance to make practical, short-run decisions seems counter to the philosophy I know you share, that we should look at individual differences not averages whenever possible. My fear is that, in practice, Mr. P might be used to ignore or downplay individual differences–not just statistically but literally, given that we’re talking about equity among student subgroups.
To the authors’ credit, they note in their limitations section that they ought to have computed uncertainty intervals. They didn’t, because they didn’t have student-level data, but I think that’s a copout. If, as they note, most of the means that moved from one side of the cutoff to the other are quite near it already, you can easily infer that the change is within a very narrow interval. Also to their credit, they acknowledge that binary choices are bad and nuance is good. But, also to their discredit, the entire premise of their paper is that the education system will, and presumably should, continue using cutpoints for binary decisions on proficiency. (That’s the implication, at least, of the US Dept. of Ed disseminating it.) They could’ve described a nuanced *application* of Mr. P, or illustrated the absurd consequences of using their method within the existing system, but they didn’t.
Anyway, sorry this went so negative, but I think the way Mr. P is marketed to policymakers, and its potential unintended consequences, are important.
Nelson continues:
I’ve been interested in this general method (multilevel regression with poststratification, MRP) for a while, or at least the theory behind it. (I’m not a Bayesian so I’ve never actually used it.)
As I understand it, MRP takes the average over all subgroups (their grand mean) and moves the individual subgroup means toward that grand mean, with smaller subgroups getting moved more. You can see this in the main paper’s graphs, where low means go up and high means go down, especially on the left side (smaller n’s). The grand mean will be more precise and more accurate (due to something called superefficiency), while the individual subgroup means will be much more precise but can also be much more biased toward the grand mean. The rationale for using the biased means is that very small subgroups give you very little information beyond what the grand mean is already telling you, so you should probably just use the grand mean instead.
In my view, that’s an iffy rationale for using biased subgroup proficiency scores, though, which I think the authors should’ve emphasized more. (Maybe they’ll have to in the peer-reviewed version of the paper.) Normally, bias in individual means isn’t a big deal: we take for granted that, over the long run, upward bias will be balanced out by downward bias. But, for this method and this application, the bias won’t ever go away, at least not where it matters. If what we’re looking at is just the scores around the proficiency cutoff, that’s generally going to be near the bottom of the distribution, and means near the bottom will always go up. As a result, schools with “bad luck” (as the authors say) will be pulled above the cutoff where they belong, but so will schools with subgroups that are genuinely underperforming.
I have a paper under review that derives a method for correcting a similar problem for effect sizes—it moves individual estimates not toward a grand mean but toward the true mean, in a direction and distance determined by a measure of the data’s randomness.
I kinda see what Nelson is saying, but I still like the above-linked report because I think that in general it is better to work with regularized, partially-pooled estimates than with raw estimates, even if those raw estimates are adjusted for noise or multiple comparisons or whatever.
To help convey this, let me share a few thoughts regarding hierarchical modeling in this general context of comparing averages (in this case, from different schools, but similar issues arise in medicine, business, politics, etc.).
1. Many years ago, Rubin made the point that, when you start with a bunch of estimates and uncertainties, classical multiple comparisons adjustments are effectively increasing can be increasing the standard errors so that fewer comparisons are statistically significant, whereas Bayesian methods move the estimates around. Rubin’s point was that you can get the right level of uncertainty much more effectively by moving the intervals toward each other rather than by keeping their centers fixed and then making them wider. (I’m thinking now that a dynamic visualization would be helpful to make this clear.)
It’s funny because Bayesian estimates are often thought of as trading bias for variance, but in this case the Bayesian estimate is so direct, and it’s the multiple comparisons approaches that do the tradeoff, getting the desired level of statistical significance by effectively making all the intervals wider and thus weakening the claims that can be made from data. It’s kinda horrible that, under the classical approach, your inferences for particular groups and comparisons will on expectation get vaguer as you get data from more groups.
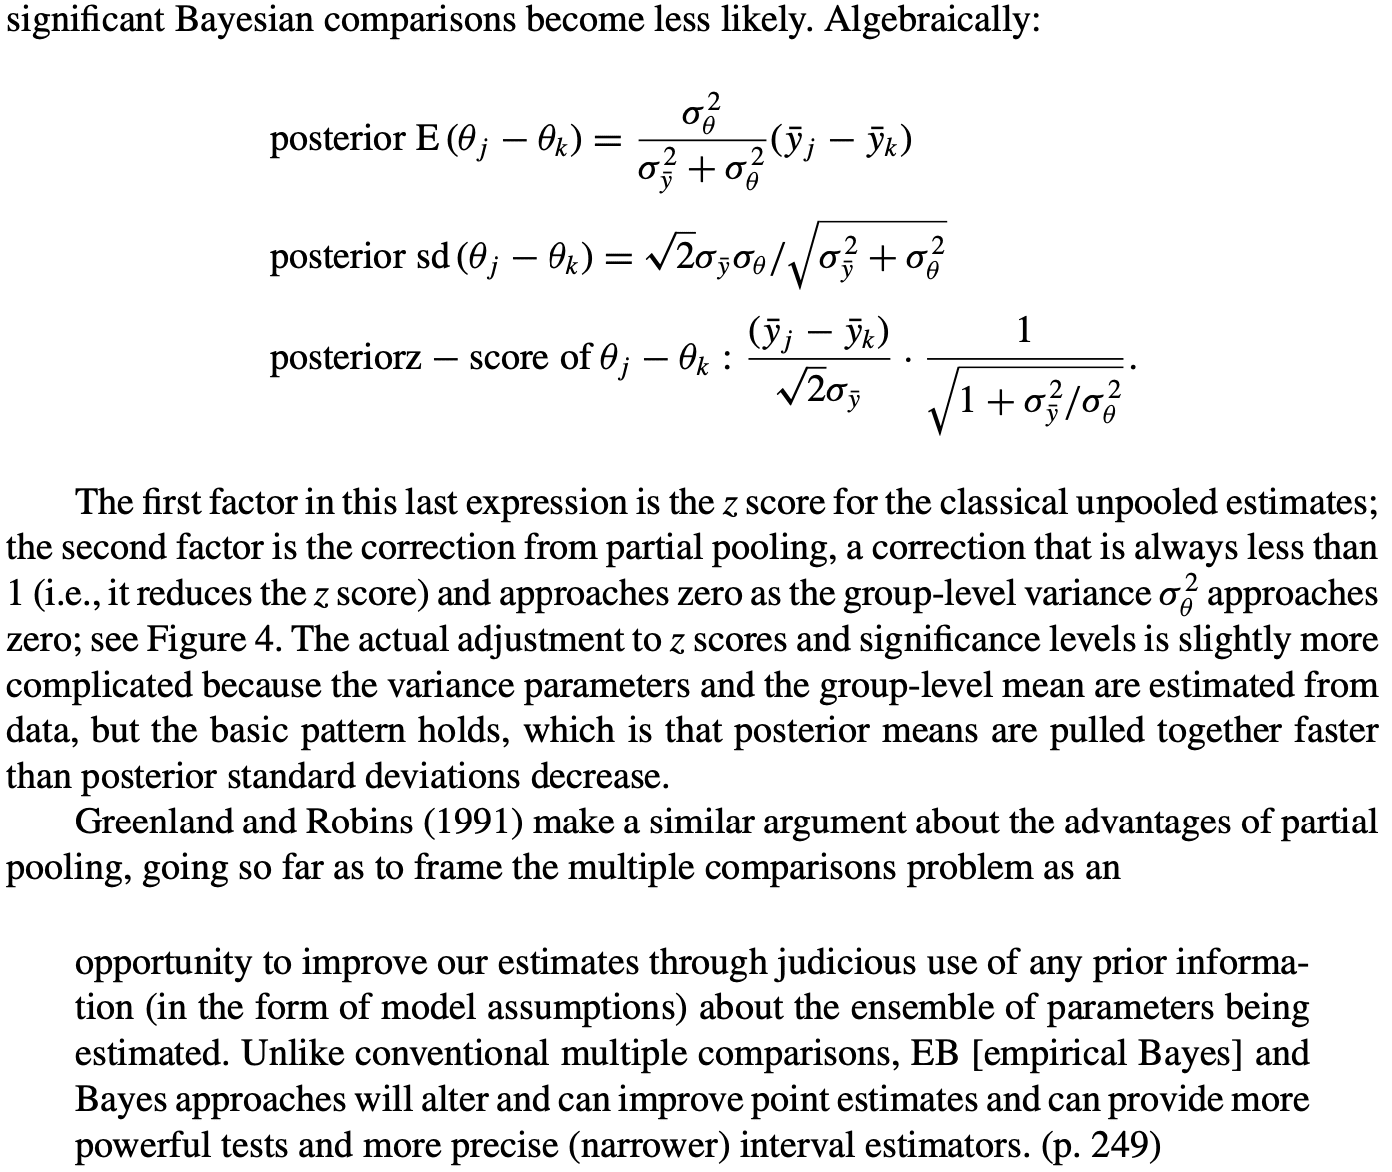
We explored this idea in our 2000 article, Type S error rates for classical and Bayesian single and multiple comparison procedures (see here for freely-available version) and more thoroughly in our 2011 article, Why we (usually) don’t have to worry about multiple comparisons. In particular, see the discussion on pages 196-197 of that latter paper (see here for freely-available version):

2. MRP, or multilevel modeling more generally, does not “move the individual subgroup means toward that grand mean.” It moves the error terms toward zero, which implies that it moves the local averages toward their predictions from the regression model. For example, if you’re predicting test scores given various school-level predictors, then multilevel modeling partially pools the individual school means toward the fitted model. It would not in general make sense to partially pool toward the grand mean—not in any sort of large study that includes all sorts of different schools. (Yes, in Rubin’s classic 8-schools study, the estimates were pooled toward the average, but these were 8 similar schools in suburban New Jersey, and there were no available school-level predictors to distinguish them.)
3. I agree with Nelson that it’s a mistake to summarize results using statistical significance, and this can lead to artifacts when comparing different models. There’s no good reason to make decisions based on whether a 95% interval includes zero.
4. I like multilevel models, but point estimates from any source—multilevel modeling or otherwise—have unavoidable problems when the goal is to convey uncertainty. See our 1999 article, All maps of parameter estimates are misleading.
In summary, I like the Forrow et article. The next step should be to go beyond point estimates and statistical significance and to think more carefully about decision making under uncertainty in this educational context.
I didn’t look at the article, but I would think there should be some hierarchical structure involved. So, for example, you wouldn’t just have varying intercepts and/or slopes for individual schools – it would be schools within districts within cities within regions within states, or something like that. The individual schools should be more similar within their district or part of town or whatever. So hierarchical structure with partial pooling and school level plus maybe higher level predictors. That’s a lot different than it seems what Nelson is describing about how the model works.
1. As Andrew pointed out, the pooling isn’t towards a “grand mean” but towards the model’s prediction on school-level predictors. So the small schools at the bottom aren’t necessarily pulled upwards; but are rather pulled towards trends that are better identified from the data than their limited direct samples. It’s possible for this to move them even lower. To take up a toy example, if the higher level model includes a relationship like school_performance ~ log(budget_per_student), … that’s strongly identified, and there’s one school with extremely low spending per student but somewhat higher performance than that would imply, the pooling would adjust its inferred performance lower.
2. Assuming a model without any school-level predictors, I don’t understand the objection to “schools with “bad luck” (as the authors say) will be pulled above the cutoff where they belong, but so will schools with subgroups that are genuinely underperforming.” I think we can all agree that applying no shrinkage to schools with very little data will inflate their variance and lead to overstating the prevalence of very good and very bad schools. Either way you’re misclassifying decent schools as bad or the other way around–who’s to say that the unbiased estimates aren’t failing too many schools? If the objection is decision theoretic, on the basis of asymmetric risk, then:
3. The nice thing about a multilevel modeling workflow like this is that it’s easy to propagate through different levels of uncertainty. When you look at the inferred school-level proficiency parameter, the small schools without much data will also have their parameters less well identified and the posterior distribution will be wider. If you want to choose your actions based on the the lower bound risk of school performance, then you can and the maybe good, maybe bad schools will still be caught. You just have to use something else instead of the inferred school mean. You could use a threshold based on lower posterior quantiles, but I’d probably use the expectation of some highly concave function of school performance. These are still “binary” cutoffs because sometimes the decision is just a binary one, but it propagates uncertainty through and discretizes at the *end* of the analysis.
I like the terminology “stabilization”, since I’d guess that’s much easier to understand for policy people and teachers then statistics terminology like shrinkage or bias.
A question for Nelson or the experts here: what is advocated here is Bayesian multilevel modeling to reduce the influence on decision making of measurement error due to small sample sizes. But I don’t see in the article any mention of post-stratification or adjustment of the sample covariates. In their case that wouldn’t even be possible, since they don’t have student-level data to compare with a census.
So my question is, if student-level data were available, and it turned out not every student in every school took the proficiency test, would it make sense to do a post-stratification step, and would that be something to do over and above the multi-level modeling? Do people do that in education, where in principle every student should participate in the tests?
I may be missing something, but Nelson’s concerns seem to be about bias of group-level effects in multilevel regression rather than about poststratification. To assuage Nelson’s worries, I would recommend the case study I wrote when I wanted to explain what was going on with a simple hierarchical regression (“multilevel” is usually brought out when there’s more than one hierarchical regression): Hierarchical Partial Pooling for Repeated Binary Trials. An added benefit is that it reproduces a non-Bayesian “empirical Bayes” analysis of Efron and Morris from 1975 where they want to show that adding bias helps reduce variance even more and thus reduces overall error. In my case study, I go over the no pooling, complete pooling, and partial pooling models to see what happens. What I don’t do, but have done elsewhere, is consider the case where there are different numbers of observations for each group. That’s what will happen if you do a whole-season analysis of baseball players, since they won’t all have the same number of trials.
Bob:
I agree that the above discussion is much more about multilevel regression than about poststratification. But I’m ok with putting it in the MRP framework because if you want to use the results in the real world you’ll be generalizing to a larger population, so poststratification arises, one way or another.
Regarding your last point, I agree except that I prefer not to frame in terms of bias and variance, because I think this can lead people into the trap of thinking that the “unbiased” estimate has some special virtue. The trouble is that “bias” as defined in that way is conditional on the true, unknown parameter value. As a mathematical concept, this is helpful in building models, but there’s no sensible reason to use an “unbiased” estimate. To put it another way, when I’m doing partial pooling, I’m not “trading off bias for variance” in the sense of reluctantly accepting some bias so as to reduce predictive error; rather, I’m giving my best estimate given my model and the available data.
Hi Andrew,
Thanks for the thoughtful summary of our article. We agree with your closing remarks, and wanted to share some recent work we’ve done in this vein: re-analyzing declines in state and local National Assessment of Educational Progress scores. Here, we report posterior probabilities of declines of educationally meaningful magnitudes.
https://mathematica.org/blogs/state-and-local-naep-declines-were-more-universal-than-commonly-reported
Best wishes,
Jennifer Starling, Lauren Forrow, and Brian Gill