Ruben Arslan writes:
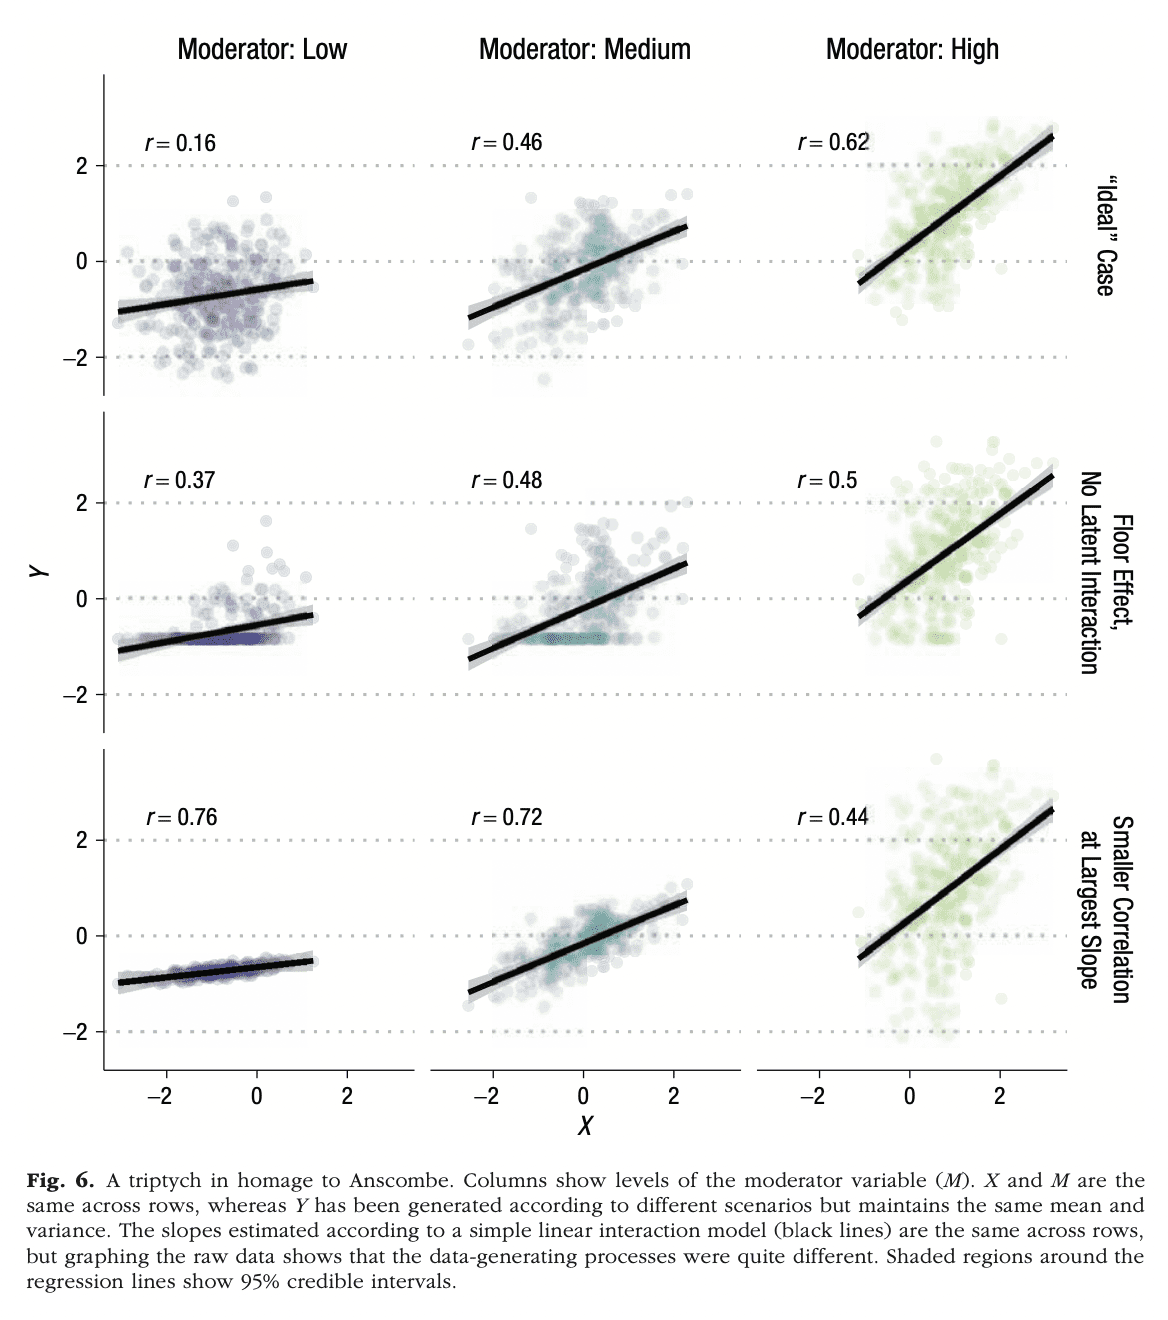
I liked the causal quartet you recently posted and wanted to forward a similar homage (in style if not content) Julia Rohrer and I recently made to accompany this paper. We had to go to a triple triptych though, so as not to compress it too much.
The paper in question is called Precise Answers to Vague Questions: Issues With Interactions.
What to do when a regression coefficient doesn’t make sense? The connection with interactions.
In addition to the cool graph, I like Rohrer and Arslan’s paper a lot because it addresses a very common problem in statistical modeling, a problem I’ve talked about a lot but which, as far as I can remember, I only wrote up once, on page 200 in Regression and Other Stories, in the middle of chapter 12, where it wouldn’t be noticed by anybody.
Here it is:

When you fit a regression to observational data and you get a coefficient that makes no sense, you should be able interpret it using interactions.
Here’s my go-to example, from a meta-analysis published in 1999 on the effects of incentives to increase the response rate in sample surveys:

What jumps out here is that big fat coefficient of -6.9 for Gift. The standard error is small, so it’s not an issue of sampling error either. As we wrote in our article:
Not all of the coefficient estimates in Table 1 seem believable. In particular, the estimated effect for gift versus cash incentive is very large in the context of the other effects in the table. For example, from Table 1, the expected effect of a postpaid cash incentive of $10 in a low-burden survey is 1.4 + 10(-.34) – 6.9 = -2.1%, actually lowering the response rate.
Ahhhh, that makes no sense! OK, yeah, with some effort you could tell a counterintuitive story where this negative effect could be possible, but there’d be no good reason to believe such a story. As we said:
It is reasonable to suspect that this reflects differences between the studies in the meta-analysis, rather than such a large causal effect of incentive form.
That is, the studies where a gift incentive was tried happened to be studies where the incentive was less effective. Each study in this meta-analysis was a randomized experiment, but the treatments were not chosen randomly between studies, so there’s no reason to think that treatment interactions would happen to balance out.
Some lessons from our example
First, if a coefficient makes no sense, don’t just suck it up and accept it. Instead, think about what this really means; use the unexpected result as a way to build a better model.
Second, avoid fitting models with rigid priors when fitting models to observational data. There could be a causal effect that you know must be positive—but, in an observational setting, the effect could be tangled with an interaction so that the relevant coefficient is negative.
Third, these problems don’t have to involve sign flipping. That is, even if a coefficient doesn’t go in the “wrong direction,” it can still be way off. Partly from the familiar problems of forking paths and selection on statistical significance, but also from interactions. For example, remember that indoor-coal-heating-and-lifespan analysis? That’s an observational study! (And calling it a “natural experiment” or “regression discontinuity” doesn’t change that.) So the treatment can be tangled in an interaction, even aside from issues of selection and variation.
So, yeah, interactions are important, and I think the Rohrer and Arslan paper is a good step forward in thinking about that.
One example I have seen this come up, people misinterpret fixed effect analysis (or if you prefer, within slopes vs between slopes), especially where the within effect is not well powered in the design (e.g. large N small T panels). So if you measure something that only slowly changes over time, the within person change is small and noisy and doesn’t tend to be well identified.
Instead of admitting it is noise though, many social scientists will spin it to try to fit some ad-hoc interpretation of {insert theory here}.
>”Not all of the coefficient estimates in Table 1 seem believable.”
I don’t think ‘believable’ is the right word choice here. I think you mean to say that not all of the coefficient estimates seem to be causal effect estimates, which is completely expected and believable. Given the well known Table 2 Fallacy (https://academic.oup.com/aje/article/177/4/292/147738), I would say it’s often a mistake to try too hard to interpret regression coefficients from a variable stew regression.
Z:
Yes, agreed. As discussed in the above post, even though these data have an experimental component (the randomization involved in each of the survey experiments), on the whole it’s an observational dataset.
Other important causes of estimates that don’t make sense are omission of an important confounder, or inclusion of an important collider.
Also, in studies with longitudinal data, people commonly are unclear whether the regression’s estimand is a within-unit effect, a between unit-effect, or a mixture of both. As within- and between-unit effects can be in opposite directions, this often leads to considerable confusion.
Rohrer has papers on both of these as well. Here’s the within/between paper: https://journals.sagepub.com/doi/10.1177/25152459221140842
This post raises a question that has interested me for a long time. Suppose your model has 15 independent variables. You’re really interested in one or at most, say, three or four; the others are in there only as controls. So you estimate the coefficients, and the ones you care about seem reasonable, and even most of the covariates. But one or two of the latter have egregiously “wrong” coefficients, either in sign or size.
What do you do? Do you glaze over them and say the main results look good? Or stress out about some control variable that has gone off the tracks?
I noticed that the situation was actually rather common, and that the overwhelming practice was the glaze over option. That left me feeling uneasy. Doesn’t it detract from the credibility of a model if some of its results, even the “extraneous” ones, are anomalous?
I wonder if others have had the same questions and what conclusions they came to.
Yes, I had similar questions. I came to the conclusion that there is a “multiverse” of equally plausible statistical models, so the coefficients for one specific model are arbitrary numbers.
Ie, unless you think the model is (at least close to) correctly specified, they don’t mean anything more than weights in a neural network. And we know the vast, vast majority are just models using whatever data happens to be available.
These types of models can be perfectly fine for prediction, but if you want meaningful parameters/coefficients there is no shortcut around deducing the model from a set of assumptions.
Can’t this often be explained by the Table 2 Fallacy? https://www.ncbi.nlm.nih.gov/pmc/articles/PMC3626058/
See https://www.ncbi.nlm.nih.gov/pmc/articles/PMC3626058/.
This is a nice article, and thanks for posting it, but the problem I’m interested in is a little less tractable. If you can readily explain an anomalous coefficient in terms of a direct-indirect causal matrix, great. If the explanation lies in collinearity, also great, at least for this issue. Or measurement error for that matter. But I wonder about perverse results on secondary variables where no evident explanations can be found other than, maybe this is revealing a serious flaw in the model.
Better to get out of the linear model and just match on those covariates?
Dean:
Sure, but that won’t work so well in this situation where we only have 101 data points and we still want to learn what we can. In a recent reanalysis of these data we used a nonlinear model which worked well. That paper is almost done . . .