
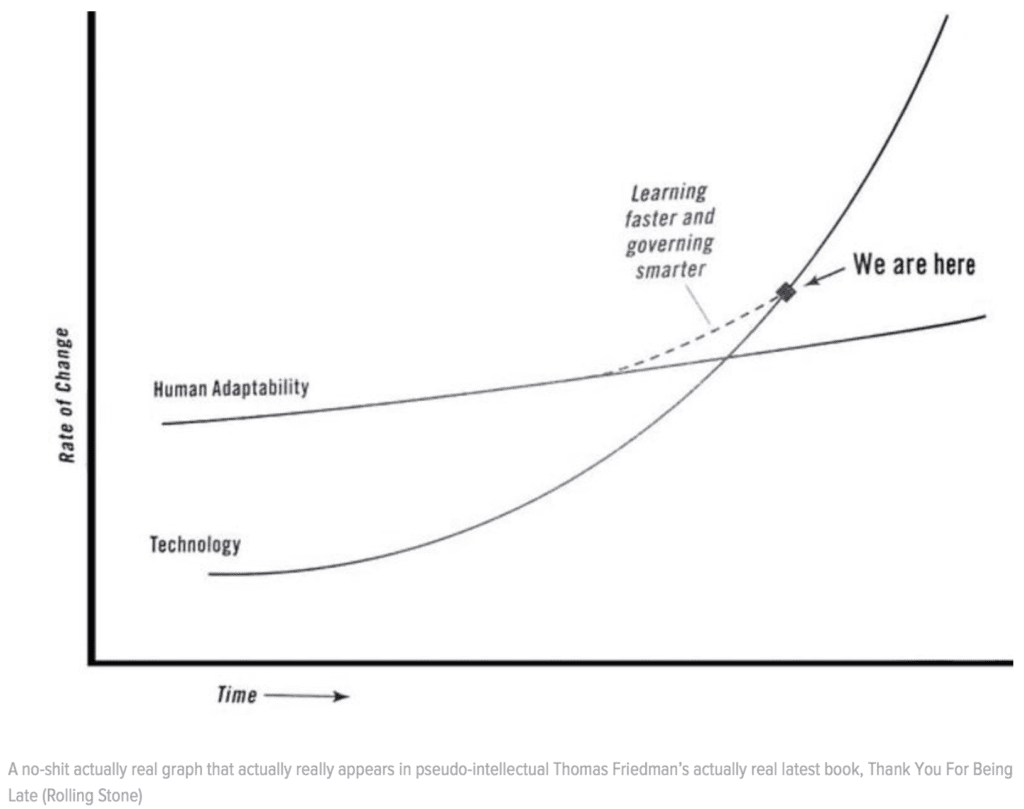
Palko links to this post by Russ Mitchell linking to this post by Hassan Khan casting deserved shade on this post, “The Third Transportation Revolution,” from 2016 by Lyft Co-Founder John Zimmer, which includes the above graph.
What is it about rich guys and their graphs?
Or is it just a problem with transportation forecasts?
I’m tempted to say that taking a silly statement and putting it in graph form makes it more persuasive. But maybe not. Maybe the graph thing is just an artifact of the power point era.
Rich guys . . .
I think the other problem is that people give these rich guys a lot of slack because, y’know, they’re rich, so they must know what they’re doing, right? That’s not a ridiculous bit of reasoning. But there are a few complications:
1. Overconfidence. You’re successful so you start to believe your own hype. It feels good to make big pronouncements, kinda like when Patrick Ewing kept “guaranteeing” the Knicks would win.
2. Luck. Successful people typically have had some lucky breaks. It can be natural to attribute that to skill.
3. Domain specificity. Skill in one endeavor does not necessarily translate to skill in another. You might be really skillful at persuading people to invest money in your company, or you might have had some really good ideas for starting a business, but that won’t necessarily translate into expertise in transportation forecasting. Indeed, your previous success in other areas might reduce your motivation to check with actual experts before mouthing off.
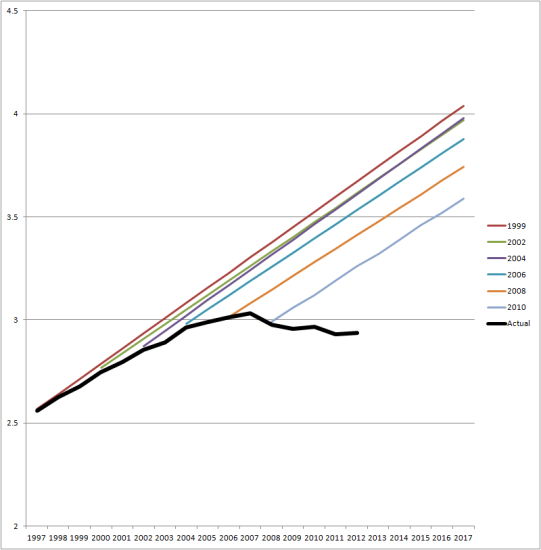
4. No safe haven. As indicated by the last graph above, some of the official transportation experts don’t know jack. So it’s not clear that it would even make sense to consult an official transportation expert before making your forecast. There’s no safe play, no good anchor for your forecast, so anything goes.
5. Selection. More extreme forecasts get attention. It’s the man-bites-dog thing. We don’t hear so much about all the non-ridiculous things that people say.
6. Motivations other than truth. Without commenting on this particular case, in general people can have financial incentives to take certain positions. Someone with a lot of money invested in a particular industry will want people to think that this industry has a bright future. That’s true of me too: I want to spread the good news about Stan.
So, yeah, rich people speak with a lot of authority, but we should be careful not to take their internet-style confident assertions too seriously.
P.S. I have no reason to be believe that rich people make stupider graphs than poor people do. Richies just have more resources so we all get to see their follies.
You’ve mixed a lot of things in this post. I think the poor and hype-prone graphics are a problem in themselves – not unique to rich people or transportation forecasts. Rich people have more access to media outlets and transportation is a favorite topic for many people, so there tends to be an overlap. But the graphics issues I think are not worse among the rich or in transportation than anywhere else.
I think much of the poor graphical displays was pretty well highlighted (and analyzed, to an extent) by Tufte. When created by media expertise, statistical integrity disappears in favor of attention grabbing displays. In fact, this week’s Economist magazine (often with excellent statistical graphics) has two noteworthy poor displays. I found their highlighted data graphic one of the worst of the year (I’m still trying to figure out how to read it). And there is a story from the USA section that highlights one particular feature of the graphic that seems at odds with all the other information in the graph. The headline could just as well have been the reverse!
Poor graphics can be intentional and those cases are inexcusable. I think that more often poor graphical displays reflect poor critical thinking. If you have the headline already then the graph becomes just “evidence” to support that headline. I don’t mean to excuse that practice, but it is not the same thing as intentional – it is more an error of omission, omission of critical thinking and open inquiry.
Dale:
I agree with everything you say. Regarding your statement, “the graphics issues I think are not worse among the rich,” see the P.S. in the above post.
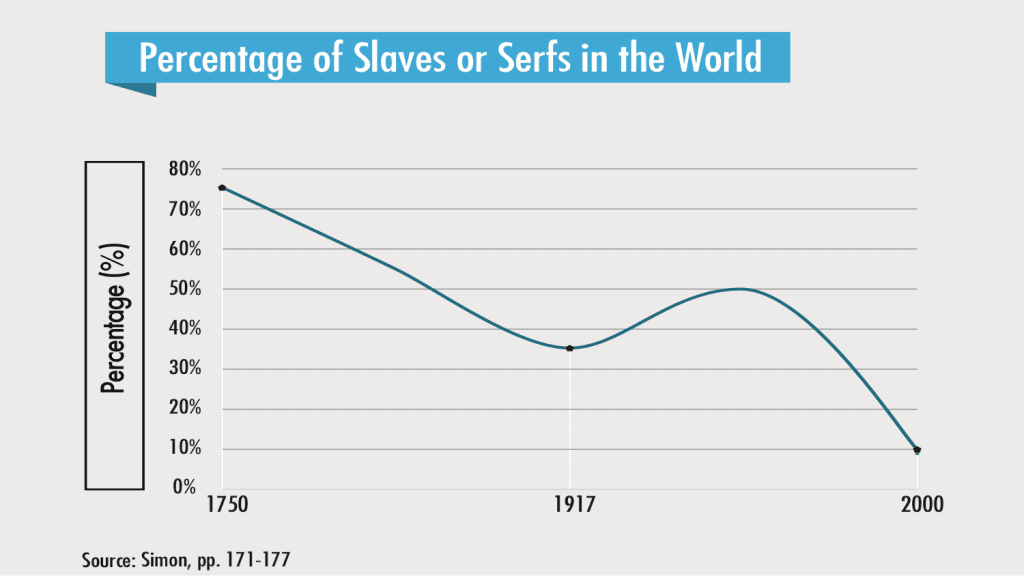
Also, yeah, I agree 100% that these errors are not intentional, at least not in the second and third graphs above. There’d be no reason for anyone to make these sorts of embarrassing errors on purpose. It’s possible that the first graph, embarrassing as it is, was made for business reasons. It’s ok to be embarrassed if it makes you a little bit of money, I guess!
This is one of the most interesting charts I have ever seen: https://statmodeling.stat.columbia.edu/wp-content/uploads/2014/01/VMT-C-P-chart-big1-541×550.png
There should be a textbook with this on the cover with dollar signs on the right of each curve (ie, line) indicating how much it cost to generate that forecast. It proves something about humans, I am not sure what.
“2. Luck. Successful people typically have had some lucky breaks. It can be natural to attribute that to skill.”
Yes, I see this all the time. Some people even have the skill to make their own luck…..
Tom:
The “skill to make their own luck” point is related to item #3 on the list, domain specificity. A person can have the skill to make their own luck in business deals, but that does not give them the ability to just make up numbers and have them be correct. To put it another way, the “reality distortion field” can work in some settings but not others.
How about another post where you substitute “full professor at ‘prestigious’ university” or “ML researcher for big tech” for “rich guy”? Substituting “politician” also works. Why? All of these people have to oversell their work to get noticed, published, funded, promoted, etc. It’s just the required bullshit marketing that seems to be required to get “ahead” (rich, tenure at a “prestigious” institution, research position in big tech, elected).
I absolutely love writing. It’s one of my favorite things to do. Nevertheless, my least favorite part of academia is writing grants and writing papers for “prestigious” journals. Grant proposals are absurd. I just read one on the train yesterday and I can’t get the bad taste out of my mouth. NSF requires you to write a proposal that literally asks how you will “transform science” for a mere few hundred thousand dollars. The result? Graphs that look like the ones in this post. It’s just standard marketing bullshit. For journal submissions, I believe it was Andrew who told me you can’t show any “sign of weakness”, so any qualifying remarks on results are redacted from drafts. And I mean this quite literally—co-authors ask me to take out qualifying remarks all the time.
Breck Baldwin put it best, when he said DARPA asks you to commit perjury and claim that you can achieve some ridiculously unrealistic goal. Back when I did speech recognition, the DARPA Communicator project targeted 95% accuracy (that’s always their goal unless it’s something that really matters) in transaction completion for spoken dialogues. This was in 1999 and 2000, when the state of the art for speech recognition was ridiculously bad, especially in academia. The graphs of performance looked just like the ones in Andrew’s post—a hockey stick with a kink as the program starts. The final systems from academia hit maybe 30%. I was working in industry at the time at SpeechWorks and our system actually worked, but it didn’t do it in the way they wanted, which was “conversational”. It was just a series of very directed questions with strong confirmations. Even though we were the “industrial baseline” (in another sign of academic hubris, the academics just assumed they could beat industry on this task), we were not allowed to participate in the final evaluation because the academic systems would come out looking so weak (we could hit about 90% completion or thereabouts). Anyone who’s been on a DARPA grant can guess what happened next. By the time the program manager got the weak academic results, they changed the evaluation criteria so they could sell a 95% result up the military chain of command. And they changed the criteria dynamically right up until the final evaluation. As Ralph Grishman said, and I paraphrase, how can I hill climb if they keep changing the shape of the hill?
Have you ever read reference letters? As Andrew put it, every letter writer claims their student is the second coming of Cauchy. What is it with these senior academics and their dumb papers, grant proposals, and reference letters?
None of these practices will change until the perpetrators are held accountable for their hype. It is similar with project budgets and timelines – they are notoriously optimistic because the planners are rarely held responsible for not meeting their targets. When the contract is written so that financial penalties apply when deadlines are not met, suddenly the plans become more realistic. So, how do we hold grant writers, reference letter writers, prestigious academics, and bad graphics authors responsible for their work? (we all know the answers but don’t know how to make it happen)
Dale:
I dunno, but maybe mocking them is a start. At least it sends the signal that we’re allowed to criticize these people when they make ridiculous claims.
Bob:
You write:
Are you kidding? I do those posts all the time!
Nope, not kidding. This is another instance where scalar implicature rears its pragmatic head. For those who don’t want to click through, here’s the relevant excerpt:
So when you write, “What is it about rich guys and their graphs?”, it implies that there’s something special about rich guys. As another example, you wouldn’t have said “What’s the matter with Connecticut?” if it had the same pattern of vote response to income as other states. So the linguistically cooperative way to make this point would’ve been “What is it about people trying to sell things and their dumb graphs?”
Bob:
Yes, exactly. I write about bad graphs made by academics and government officials all the time, so when these come up, I don’t need to write, “Another bad graph made by a tenured professor” or “Another bad graph produced by the government,” because we’re so used to talking about mistakes made by professors and government officials that we hardly need to point out the source. The “bad graphs by rich guys” is more noteworthy because we might expect rich guys to be more clueful, hence it’s newsworthy when they post such silly graphs. I guess it would be noteworthy when tenured professors posted silly graphs, if I hadn’t already been talking about it so much over the years.
Regarding the VMT stuff. My first thought is that it’s a product of decentralised decision making. Remember that individual states submit their traffic forecasts to the FHWA, and these forecasts are used in a section of the report entitled Potential Capital Investment Impacts. In short – these forecasts are used to determine how much funding each state gets in the future.
https://www.fhwa.dot.gov/policy/2013cpr/chap7.cfm
This creates a massive incentives problem. If a state tries to to be more accurate about their traffic forecasts, the only thing that is doing is encouraging the diversion of funding away from themselves to states that are more deceitful. After all, you’re saying you need it less!
Since that graph is from 2013 (and had only forecasts prior to 2010), I went and had a look at the latest report to see if anything has changed.
https://www.fhwa.dot.gov/policy/24cpr/
Well… the good news is that the report headlines now the FHWA’s own internal VMT forecast model instead of the state contributed HPMS model. Over 20 years they are now projecting a rise of 0.93 T instead of ~1.5. Still, this improvement probably isn’t enough to make the projections good – it still over-predicts the increase from 2010 to 2016 by about 50% (as opposed to 140% with the old estimate!)
I suspect the issue is their insistence on basing their models on extrapolations from their dataset going back to 1960. Or maybe the DOT has their own adverse incentives issue. That “YOU CAN’T CUT BACK ON FUNDING! YOU WILL REGRET THIS!” guy from Simcity may be more accurate than we think.