Kush Bhatia writes:
I recently came across this blog post titled All Statistical Models Are Wrong. Are Any Useful? by Ben Recht. While I expected to see mis-specifications affecting the confidence intervals of the logistic model, it was indeed surprising to see the results in the second half of the article when the true underlying model is correctly specified.
I wanted to know what are your thoughts on this and if you think there are scenarios where modeling the population statistics can indeed be helpful in the agnostic case.
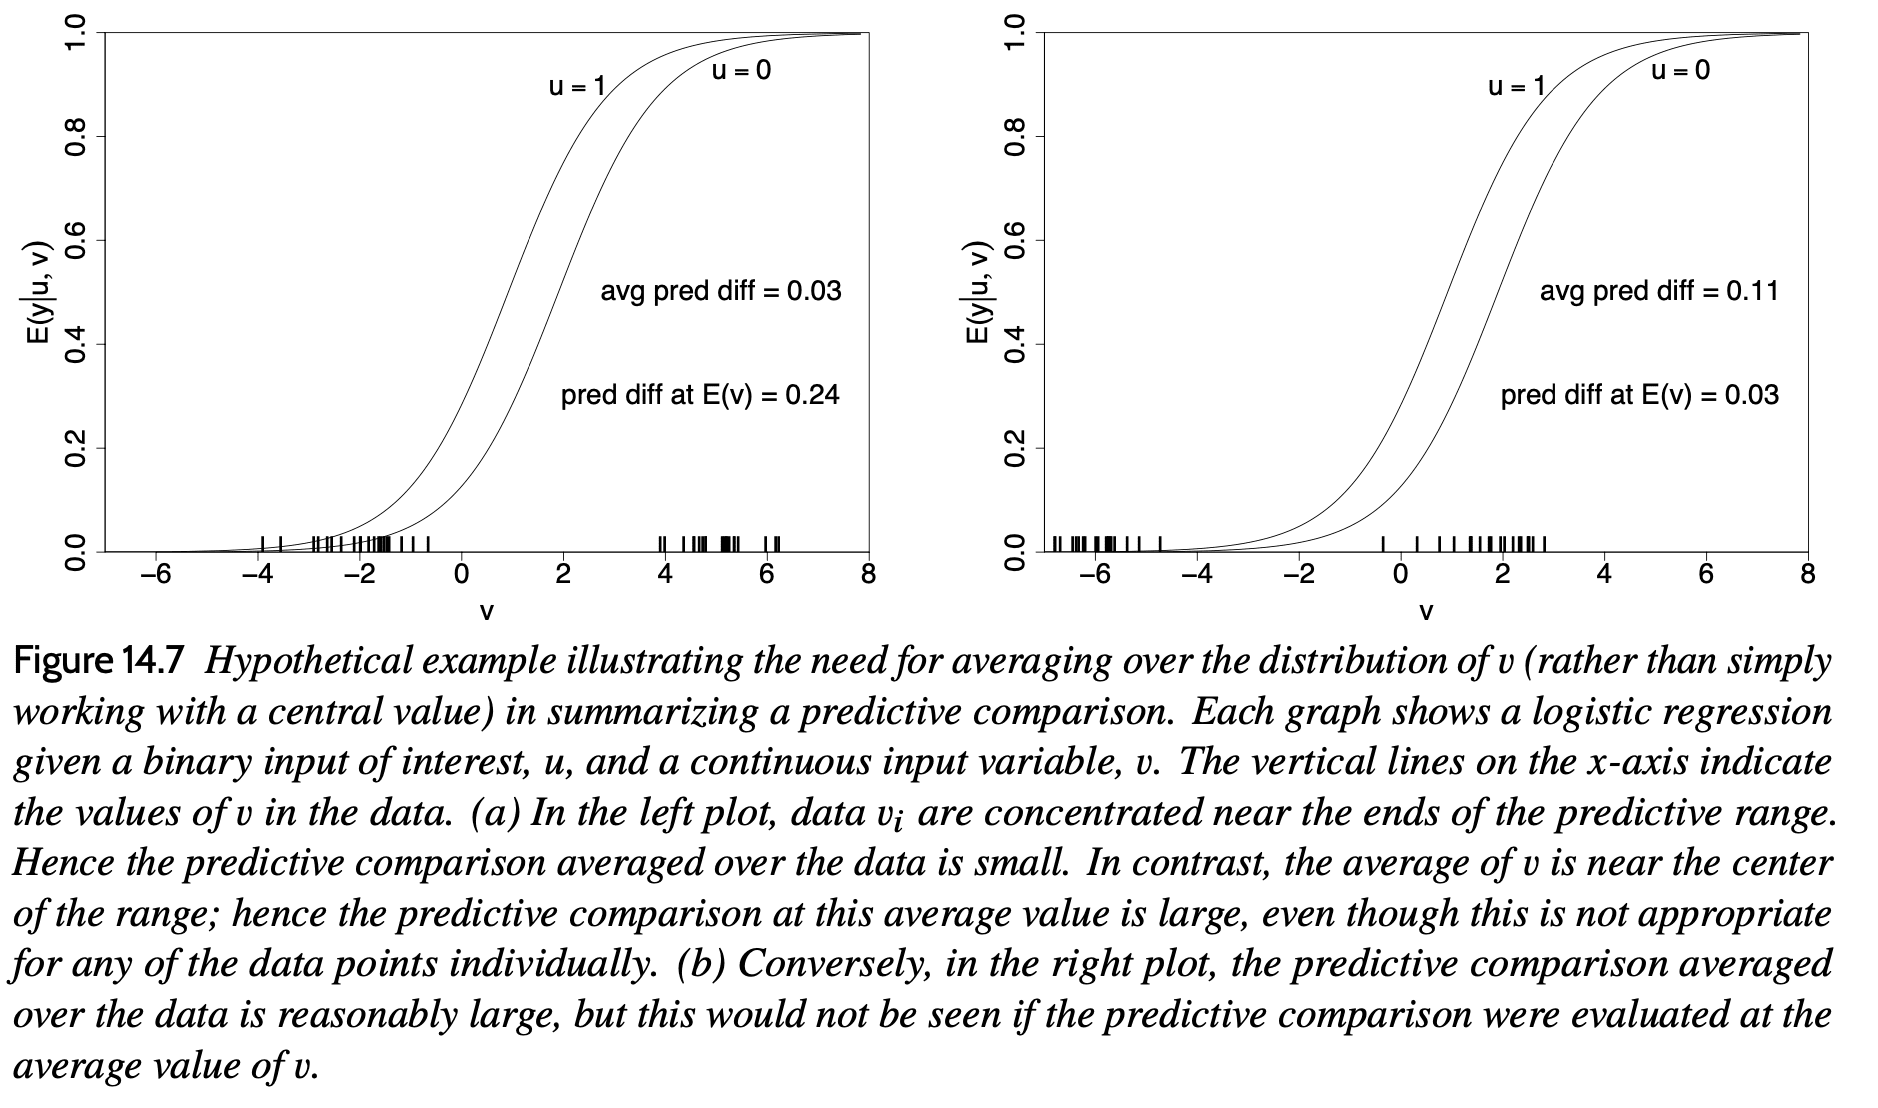
My reply: No, that post by Recht is confused. To understand the logistic regression example, see figure 1 of this paper.
The short answer is that the coefficient on the logistic scale corresponds to different shifts in probability, depending on where your baseline is. So a particular logistic regression coefficient cannot be directly interpreted without knowing where on the probability scale you are. Perhaps I should post something explaining the error, although I guess there’s so much wrong on the internet that we can’t spend all our time correcting it! The thing that annoys me about that particular post is its aggressive tone, something that we sometimes see when people are trying to explain statistics without realizing how tricky it can be. Instead of him saying, “Hmmm, this is puzzling, what’s going on here?,” he jumps to misinformed criticism of all of statistical modeling.
Looking further into the comment thread of Recht’s post, I see that commenter TT makes this point clearly.
The key mathematical point is that the translation from the logistic to the probability scale can vary a lot, depending where on the probability scale you start. We discuss this in Section 14.4 of Regression and Other Stories and in our article from 2006 on average predictive comparisons. There remain some unresolved research problems on how to estimate and summarize these average differences from data and a fitted model, and it would be fun if someone could work this out sometime. Research!
Bhatia responded:
I think I now understand that the reason for the confusion was the particular interpretation of the logistic scale coefficient. Yes, the commenter TT has made the calculations for this case particularly clear. Quoting the comment, “Maybe the biggest problem with logistic regression is that it’s just really weird to interpret its coefficients especially when using multiple features.” and I think this is problematic if one is not careful in using these estimates.
What’s most frustrating to me is the way that the blogger is so wrong and so confident about it. I fear that this sort of overconfident document can cause all sorts of problems with people getting misled by its air of certainty.
This 2020 paper by Daniel et al. does a really nice job of explaining the duelling issues of non-collapsibility and confounding:
https://doi.org/10.1002/bimj.201900297
Sometimes coefficients have a direct interpretation. But a lot of times you just need to push everything through to the outcome… For example you have a surface you’re fitting through 3D data using general purpose basis expansions (let’s say it’s force applied by a given apparatus as a function of temperature and voltage applied, or fraction of children graduating from high school as a function of dollars spent on some intervention and hours spent tutoring). The coefficients are not going to have any kind of straightforward interpretation, so you just need to evaluate the function at different inputs and compare the outcomes f(a,b) – f(c,d) for example.
This is a general purpose way to evaluate models, see how the predictions change. The “coefficient tea leaf reading” is only applicable in much more limited cases.
Yeah, I feel like I’m missing the tricky part here.
(Outcome at point 1 – outcome at point 2 ) / outcome at point 1
or \frac{\partial \log(Outcome)}{\partial x_{interest}}(x_{0})
sometimes this corresponds with an interpretable expression. In special cases it’ll be a stationary function of just one coefficient. It seems like the presumption that “the coefficient” is what statistics is meant to study.
To make this more concrete: Say u is some medical intervention, v is health status, and y is probability of dying in the next year.
If the person is very healthy, they are unlikely to die either way. Likewise, if very frail, they are likely to die either way. So there is only a meaningful effect for those of middling health (v near zero).
How does looking at an average effect help us make a decision about this treatment?
What people want is the prediction for their specific case, not for a hypothetical average or while holding all the other variables constant.
“We need $10MM to create this cancer treatment that will have large benefits for people with middling health, although it won’t make a big difference for those who are very healthy or very unhealthy.”
“How much would the average person benefit from the treatment?”
“What a useless question! You should only look at individual cases, averaging over a nonlinear function is so silly!”
That’s one reason. The underlying distribution of the population that will need the treatment can make or break how effective it is *on average*, that’s the nature of a heterogenous (in probability terms) treatment effect.
For a decision like that,I would want to know at least x% of the population would be expected to gain ~one year of life, y% two years, etc. As you say, there would also be different scenarios for different populations.
Then the patient would want to know what bin they are expected to fall into, or better just the prediction of the model.
I do acknowledge there is widespread desire to distill a dstaset down to a single value. Summarization can be useful (eg, sufficient statistics), but I don’t see why anyone would want to throw away so much info before making a decision.
Hey, just out of interest: What are the unresolved research problems you have in mind when talking about average predictive comparisons?
I really like the idea and applied it a couple of times to make a more complicated model simpler to interpret (see for example fig. 2 in https://www.ncbi.nlm.nih.gov/pmc/articles/PMC8788332/, where APC were used to map the regression coefficients of an ordinal regression model to the probability scale.)
I’m not sure how helpful that was in the end, but I hope it helped the medical folks to better interpret the model.
Daniel:
The challenge is how to average over these with data. Some smoothing can be needed. See the discussion around page 37 of our article.
So you’re unhappy with the weights? If I understand it correctly we ideally want to average over what happens with y for average changes of u, given that v stays constant. It just gets difficult because we realistically never observe data points where the v are identical, and this means we have to use the weights to deal with the p(u|v)’s.
But is this really that bad? If I remember correctly the average predictive comparisons were pretty robust in the specific data sets I looked at, even when completely ignoring the weights. But maybe I just screwed up my code.
Could it work to build a model to estimate the p(u|v)’s, similar to what happens in multiple imputation?
Sorry if none of this makes sense to you, I probably know just enough to be dangerous.
Daniel:
I don’t think it’s hard to come up with a reasonable formula for the average predictive comparison in any particular example, but it’s an open question how to come up with a general procedure that will work by default with sparse data.
Let’s give props to Daryl Pregibon whose 1981 paper, Logistic Regression Diagnostics, was an early contribution to this discussion.
A maximum likelihood fit of a logistic regression model (and other similar models) is extremely sensitive to outlying responses and extreme points in the design space. We develop diagnostic measures to aid the analyst in detecting such observations and in quantifying their effect on various aspects of the maximum likelihood fit. The elements of the fitting process which constitute the usual output (parameter estimates, standard errors, residuals, etc.) will be used for this purpose. With a properly designed computing package for fitting the usual maximum-likelihood model, the diagnostics are essentially “free for the asking.” In particular, good data analysis for logistic regression models need not be expensive or time-consuming.
https://projecteuclid.org/journals/annals-of-statistics/volume-9/issue-4/Logistic-Regression-Diagnostics/10.1214/aos/1176345513.full
Greenland, Robins, & Pearl 1999 also provide a simple example where the risk differences are collapsible but the odds ratio are not (Table 1).
It is pretty counterintuitive that a one measure of treatment effect may be collapsible while another measure of the same effect may not be. Probably was the source of the confusion in linked post.
William:
Yeah, from the math it’s super-clear but there’s a problem in that people talk about “the” treatment effect, which can lead people to naively think that one parameter in the model will tell all the answers. And then, as with the linked post, people learn this isn’t true, get disillusioned, and lose the thread entirely.
As you point out, for any OR, the translation to posterior probability depends on the value of the baseline probability. On the other hand, for a fixed probability shift, the OR will also vary depending on baseline probability e.g.
0.2 –>> 0.4 = OR 2.67
0.4 –>> 0.6 = OR 2.25
0.6 –>> 0.8 = OR 2.67
My understanding is that the OR defines discrimination given that √OR≈Od(AUC) and therefore the the probability shift defines discrimination differently based on where the baseline is and this is captured by the OR – would this be a correct interpretation?