The General Social Survey announces:
We are excited to share two important updates with you:
1. 2021 cross-sectional data for the GSS, along with the GSS cumulative cross-sectional file are now available
2. We will soon be upgrading the Data Explorer Release of 2021 cross-sectional GSS data.
Release of 2021 cross-sectional GSS data
We are excited to announce that the 2021 cross-sectional data for the GSS, along with the GSS cumulative cross-sectional file is now available at gss.norc.org. Currently, the data is available only in SAS and STATA file formats. As we are in the process of upgrading GSS Data Explorer from version 1.0 to 2.0, the 2021 cumulative data file will not be available on the GSS-DE and GSS Key Trends 2.0 web site until January 2022, after the upgrade of the Data Explorer 2.0 is complete.
Please note that due to the COVID-19 pandemic the 2021 GSS implemented significant methodological changes, for the safety of both respondents and interviewers. Since its inception in 1972, the GSS has conducted data collection via in-person interviews as its primary mode of data collection. The pandemic forced the GSS to change this design, moving from in-person to address based sampling and a push-to-web methodology, with the bulk of the interviews conducted online via a self-administered questionnaire.
The 2021 GSS provides vital opinion data to the research community at a critical time in U.S. history. While the data will contribute to our understanding of society, any changes in public opinion seen in the 2021 GSS data could be due to either changes in actual opinion and/or changes the GSS made in the methodology to adapt to COVID-19. When evaluating the GSS for trend changes over time we caution our users to carefully consider changes in the GSS methodology from a total survey error perspective.
To help users assess these differences, we have posted the methodological details to the website (gss.norc.org), where our users can find a methodological primer and full documentation and codebook explaining how various issues related to total survey error may impact the interpretation of the results.
The new 2021 data can be downloaded at https://gss.norc.org/Get-The-Data along with the following important documentation:
• Methodological Primer
• Documentation and CodebookData Explorer Upgrades
NORC is updating the General Social Survey’s Data Explorer (GSS-DE) and Key Trends to make them better tools for users. This update will include substantial upgrades including a simplified user interface and single sign in. The new version of the Data Explorer (GSS-DE 2.0) will be available this Winter (2021).
This is soooo cool. The GSS is great, and the GSS Data Explorer is just wonderful.
Ummm, here, let’s demonstrate, starting from absolute scratch:
Google *gss*. It’s the first link:
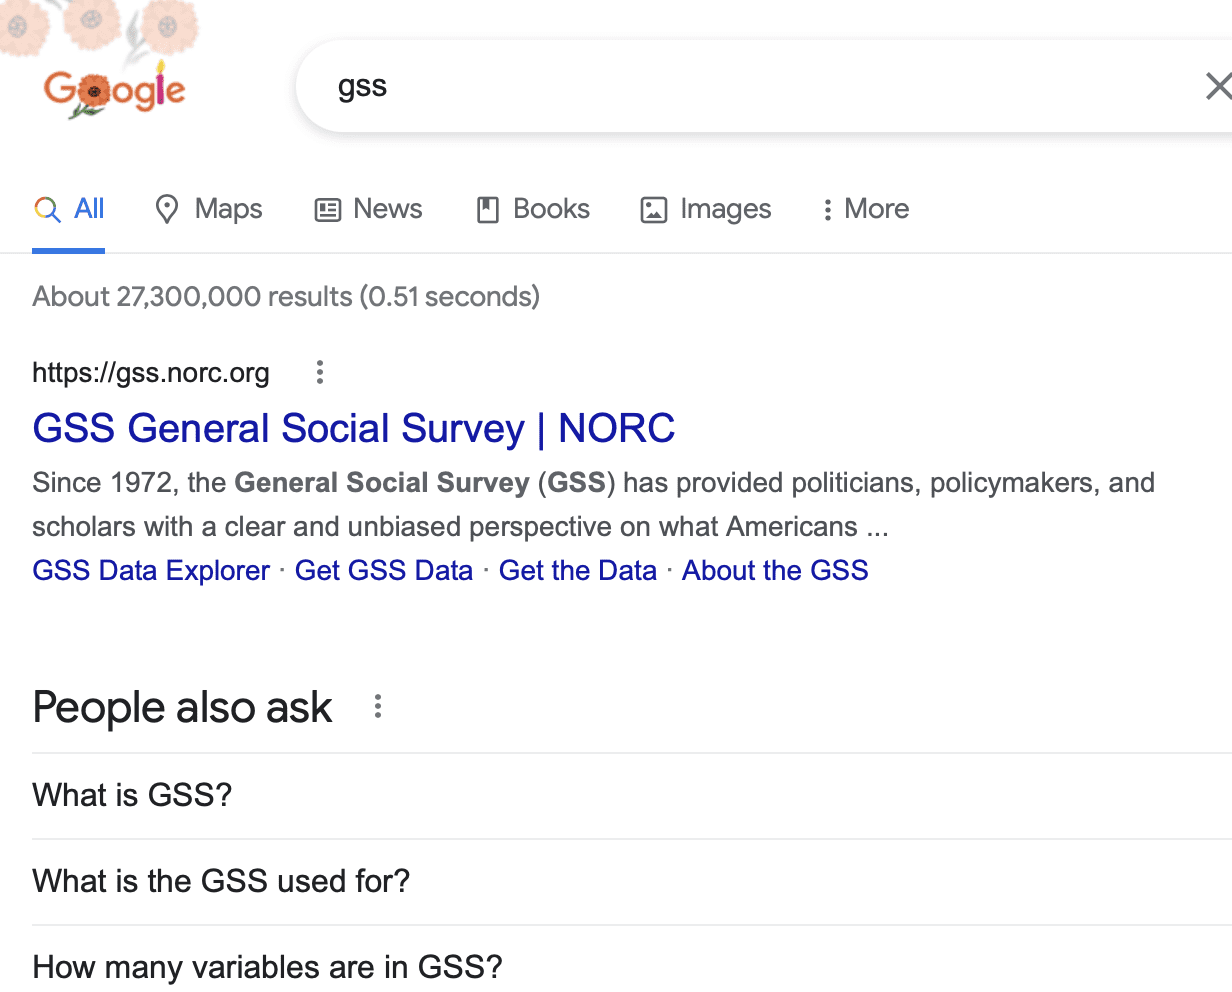
Click on the link:

Right at the top, there’s a link, Get the data. Click on it, scroll down, there’s Download the Data, then below that there’s Using the GSS Data Explorer:

Let’s click on Search for Data. It sends us to a page with clear four-step instructions, starting here:
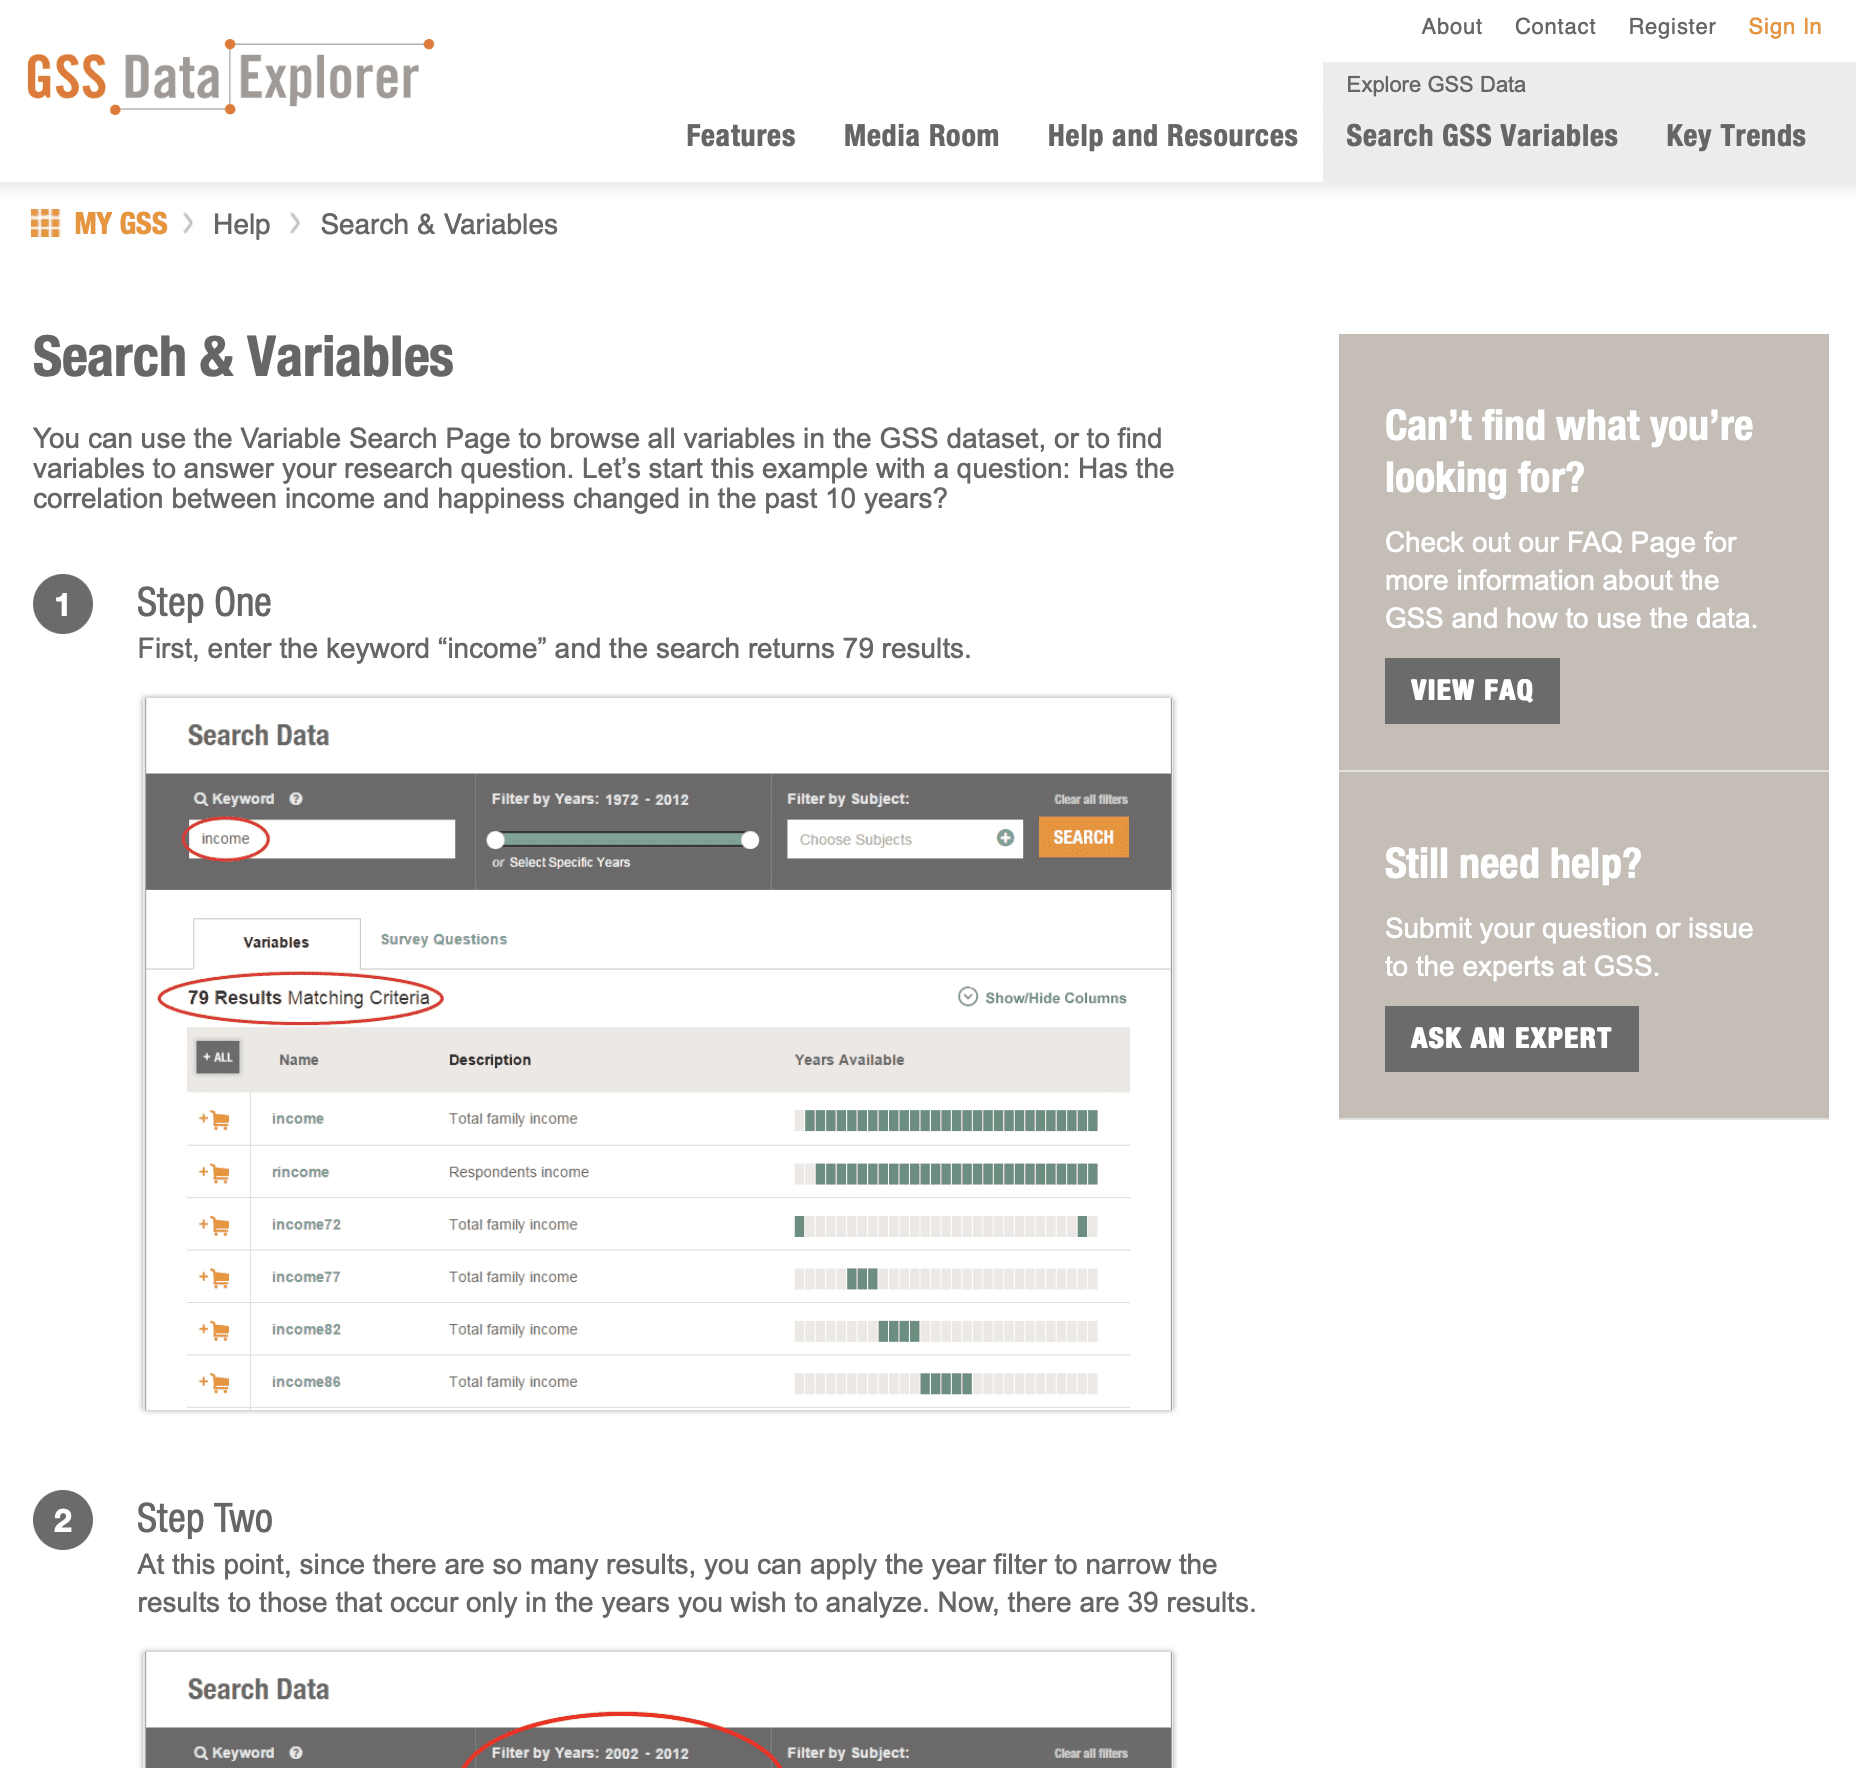
So let’s follow the steps! I’ll need to choose what to study. Let’s look at happiness, age, and family type. Is it true that people with kids are less happy?
The next step seems to be to click on Search Data Variables at the top of the page, so I’ll try just that! We come to this dashboard:

It looks like I’ll need to type in some keywords to get variable names. But first, we have “year” right there. That could come in handy. Now I’ll search on the word “happiness” by just typing it into the search box and clicking on the Search button. And here we have it:

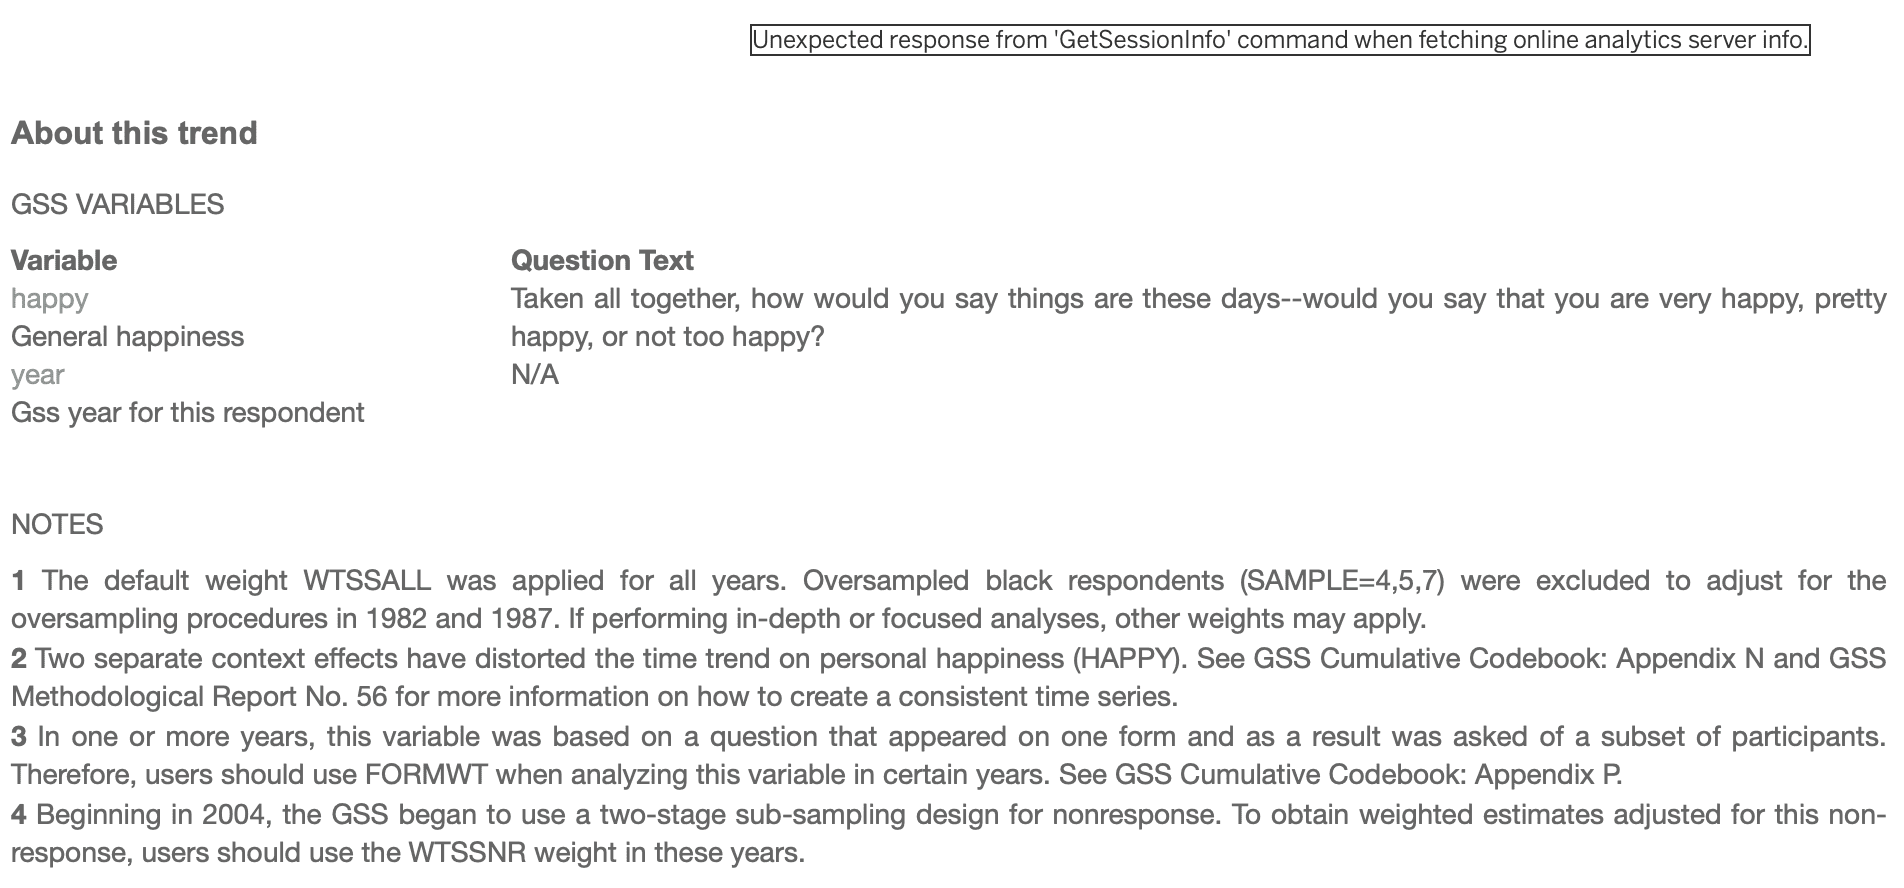
These all look interesting—great browsing possibilities here!—but let’s stay focused. The very first variable, “happy,” seems like what I’m looking for. I’ll click on it, which gives me summary statistics:

The table kinda falls off the right side of the page, but it’s easy to scroll over and see it all. No graph . . . that’s too bad. But wait! What happens if we click on Key Trends?

We can try all sorts of things, for example breaking it down by political affiliation:

This topic has come up before; see also here.
OK, we’re good on the “happy” variable. I’ll click on the Back button and then click on Add to Cart:

Success:

Now back again to the Data Explorer search box. I’ll search on *children*. Lots of search results come up:

“Number of children” isn’t quite right . . . I really want something about children living at home. So let’s search *children home*. Nah, that doesn’t work. It still gives me the same 324 results. I guess I’ll just have to scroll through. Dammit! But, hey, 324 isn’t that much. Let’s just get to it.
I’ll go back to the search on *children*, also focusing on questions that were asked in most or all of the GSS years. Nothing on page 1 about children living at home. Scrolling down, I see these:

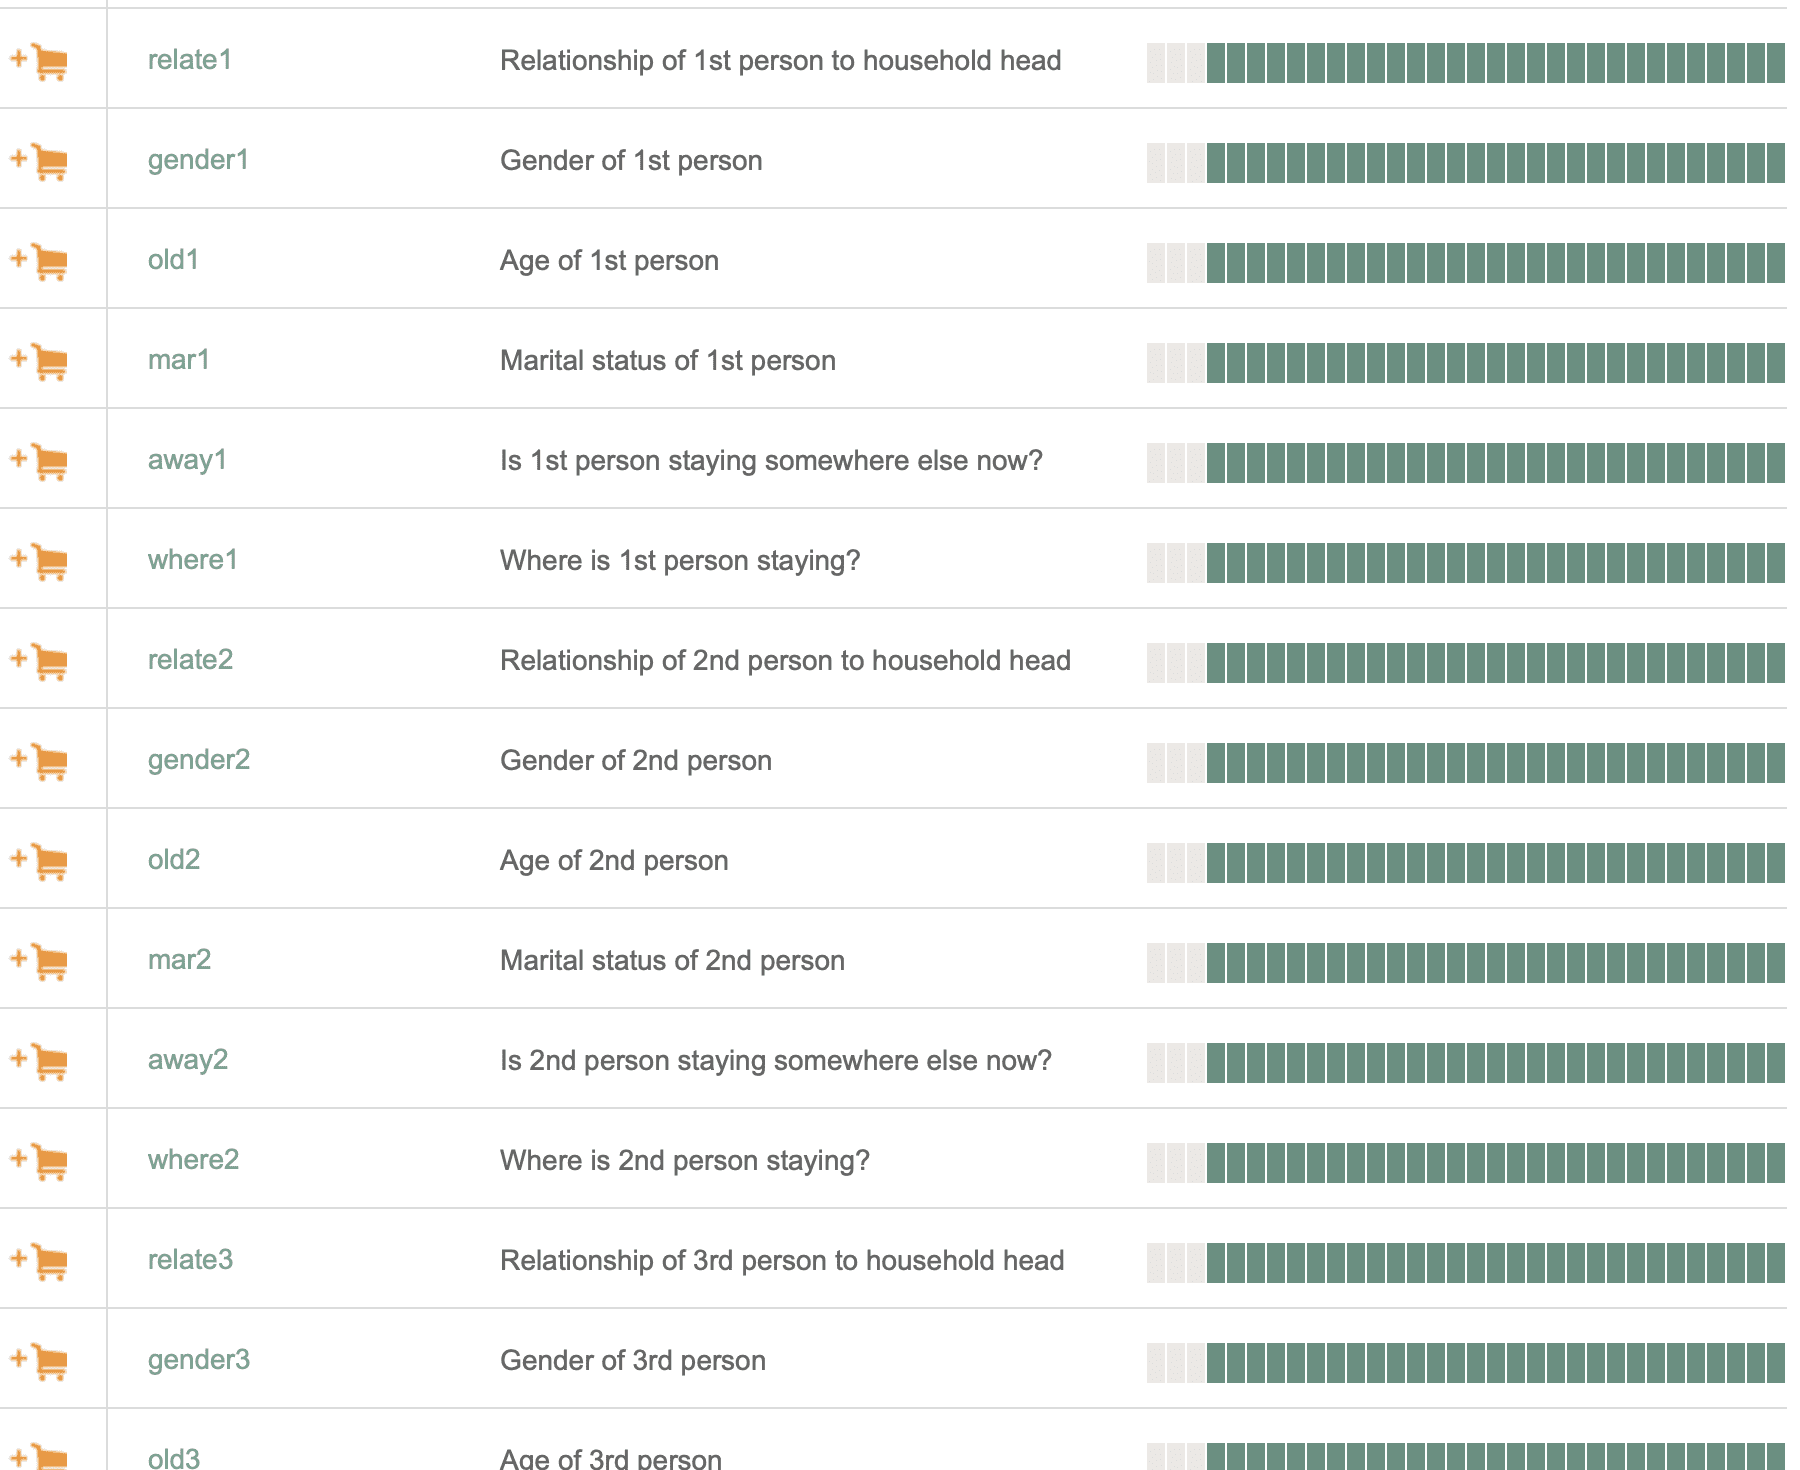
And then . . . jackpot! A series of questions with information on up to 14 people living in the household:
We also have this:

Which would be great, except that it was only asked in one year. Damn!
And in the midst of scrolling we see some fun things:
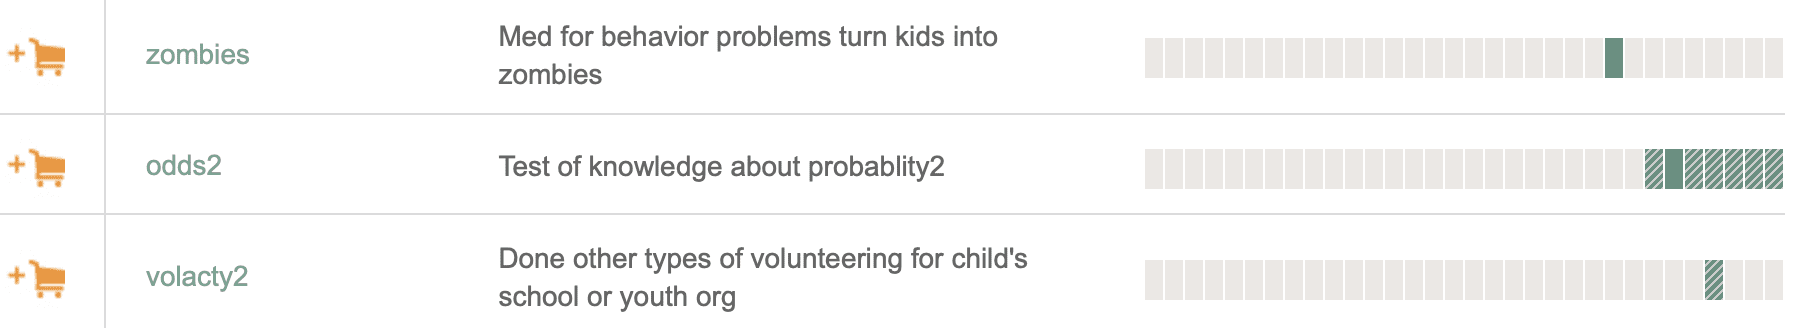
Zombies, huh?
And more fun stuff:

I’d go with “life’s greatest joy” myself, but I guess not everyone would agree; that’s why they ask the question in the first place.
But nothing on whether children are living at home. I did a google search on *gss “children living at home”* and found this article by Tom Smith—it’s a GSS publication from 2007 but it looks like it was typed on a typewriter . . . How retro can you get, dude? Anyway, this report has summaries on “% with No Children Under 18 in House,” but all it has is “Source: GSS.” So I guess I’ll have to put this table together by hand. On the plus side, I can check to see that my numbers add up to what Smith got:

But this will require that I go beyond the simple GSS Explorer tool. I’ll have to download the data in R and do some wrangling.
I’ll put that off for now. Instead, I’ll just save the variable “childs”: number of children.
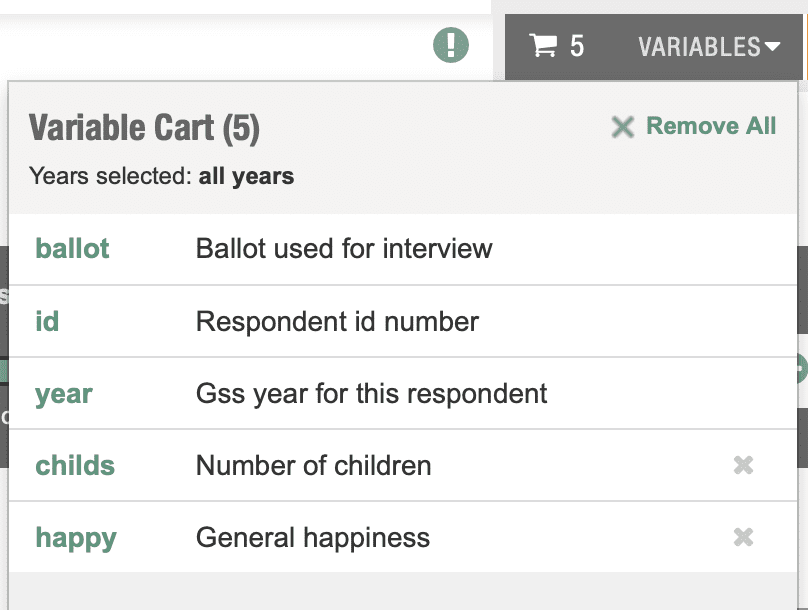
OK, let’s see what’s in my cart:
What I want to see is average happiness plotted vs. age, comparing people with and without children. So let me put age into the cart. That’s easy enough: just search on age, it comes up, add it to cart.
Now time for some graphs. I go back to the GSS Data Explorer main page. Here are the options:

We’ll want Analyze Data, which means I need to set up an account, so I click on the big orange Create Account button higher up on the page. Signing up is easy:

Also, check out what it says at the top:

That’s as it should be. Anyway, setting up an account is easy. Indeed, I’d already done it for a previous project, so I just clicked Sign In and gave my id and password, which my computer had saved from before.
I click on Actions, then Analyze Data, then here we are:

Wait. No graphs! Shoot . . . I could’ve sworn that was one of the options. It looks like I’ll just have to download the data in R if I want that. I was thinking, now that I’m here, I might as well do some crosstabs, but that wouldn’t be so easy either, as I need to break things down by age in some way . . .
OK, that’ll be another post! Maybe I’ll follow the instructions in our video from a few years ago. I still think GSS is great, even though I guess the Data Explorer isn’t as awesome as I’d remembered.
Ummmm . . . I take that back. The data manipulation part of the data explorer isn’t so useful—I guess they should work with the Rstudio people to have some sort of embedded window—but the searching-for-variables thing works very well: right there it shows the years when each question is asked, and summary tables and graphs are just a click away. That’s excellent, and it’s something that a lot of surveys don’t have.
P.S. It seems that there may be problems with the data from 2021.
Hmm. Seems Republicans’ happiness dropped around 2010. I wonder why. Maybe they were Colts fans?
Ryan Burge thinks there’s something wrong with the latest data:
https://twitter.com/ryanburge/status/1455662542966116353
That does seem to look very strange!
https://twitter.com/ryanburge/status/1455680103573241865 is a pretty neat figure from the new data. It looks like COVID-19 brought down regular church attendance (people who go more than once a year) by about 10%.