The above (without the question mark) is the title of a news article, “The Dunning-Kruger Effect Is Probably Not Real,” by Jonathan Jarry, sent to me by Herman Carstens. Jarry’s article is interesting, but I don’t like its title. I don’t like the framing of this sort of effect as “real” or “not real.” I think that all these sorts of effects are real, but they vary: sometimes the effects are large, sometimes they’re small, sometimes they’re positive and sometimes negative. So the real question is not, “Are these effects real?”, but “What’s really going on.”
Jarry writes:
First described in a seminal 1999 paper by David Dunning and Justin Kruger, this effect has been the darling of journalists who want to explain why dumb people don’t know they’re dumb.
I [Jarry] was planning on writing a very short article about the Dunning-Kruger effect and it felt like shooting fish in a barrel. Here’s the effect, how it was discovered, what it means. End of story.
But as I double-checked the academic literature, doubt started to creep in. . . .
In a nutshell, the Dunning-Kruger effect was originally defined as a bias in our thinking. If I am terrible at English grammar and am told to answer a quiz testing my knowledge of English grammar, this bias in my thinking would lead me, according to the theory, to believe I would get a higher score than I actually would. And if I excel at English grammar, the effect dictates I would be likely to slightly underestimate how well I would do. I might predict I would get a 70% score while my actual score would be 90%. But if my actual score was 15% (because I’m terrible at grammar), I might think more highly of myself and predict a score of 60%. . . .
This is what student participants went through for Dunning and Kruger’s research project in the late 1990s. There were assessments of grammar, of humour, and of logical reasoning. Everyone was asked how well they thought they did and everyone was also graded objectively, and the two were compared. . . .
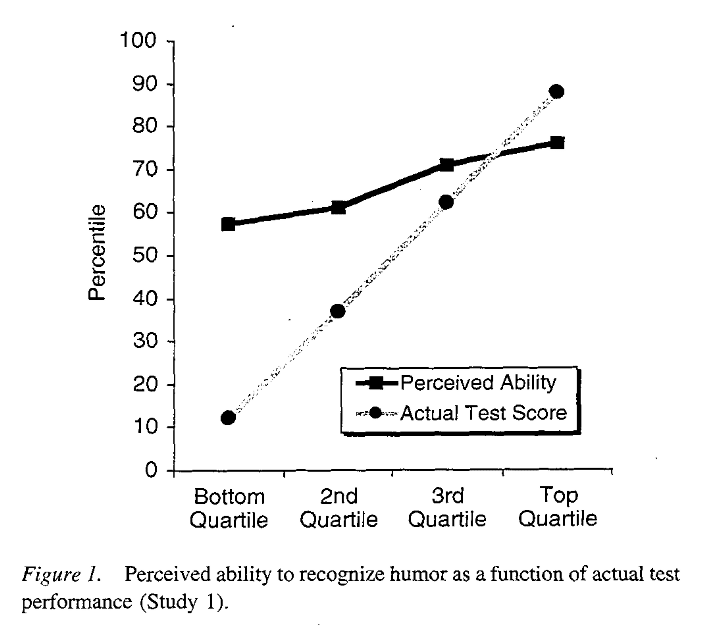
In the original experiment, students took a test and were asked to guess their score. Therefore, each student had two data points: the score they thought they got (self-assessment) and the score they actually got (performance). In order to visualize these results, Dunning and Kruger separated everybody into quartiles: those who performed in the bottom 25%, those who scored in the top 25%, and the two quartiles in the middle. For each quartile, the average performance score and the average self-assessed score was plotted. This resulted in the famous Dunning-Kruger graph.
Jarry continues:
In 2016 and 2017, two papers were published in a mathematics journal called Numeracy. In them, the authors argued that the Dunning-Kruger effect was a mirage. And I tend to agree.
The two papers, by Dr. Ed Nuhfer and colleagues, argued that the Dunning-Kruger effect could be replicated by using random data. . . .
Hey—that sounds like regression to the mean: When evaluating a prediction, you should plot actual vs. predicted, not predicted vs. actual. We discuss this in Section 11.3 of Regression and Other Stories. If you plot predicted vs. actual, you’ll see that slope of less than 1, just from natural variation.
Jarry also writes:
A similar simulation was done by Dr. Phillip Ackerman and colleagues three years after the original Dunning-Kruger paper, and the results were similar.
Wait a second! So this isn’t news at all! The Dunning-Kruger claim was shot down nearly 20 years ago. From the abstract of the 2002 article by Phillip Ackerman, Margaret Beier, and Kristy Bowen, published in the journal Personality and Individual Differences:
Recently, it has become popular to state that “people hold overly favorable views of their abilities in many social and intellectual domains” [Kruger, J., & Dunning, D. (1999)] . . . The current paper shows that research from the other side of the scientific divide, namely the correlational approach (which focuses on individual differences), provides a very different perspective for people’s views of their own intellectual abilities and knowledge. Previous research is reviewed, and an empirical study of 228 adults between 21 and 62 years of age is described where self-report assessments of abilities and knowledge are compared with objective measures. Correlations of self-rating and objective-score pairings show both substantial convergent and discriminant validity, indicating that individuals have both generally accurate and differentiated views of their relative standing on abilities and knowledge.
I did some searching on Google Scholar and found this article in the journal Political Psychology from 2018, “Partisanship, Political Knowledge, and the Dunning‐Kruger Effect,” by Ian Anson, which reports:
A widely cited finding in social psychology holds that individuals with low levels of competence will judge themselves to be higher achieving than they really are. . . . Survey experimental results confirm the Dunning‐Kruger effect in the realm of political knowledge. They also show that individuals with moderately low political expertise rate themselves as increasingly politically knowledgeable when partisan identities are made salient.
It’s helpful for me to see this in the context of political attitudes this relates more to my own area of research.
A quick Google search also led to this article from 2020 by Gilles Gignac and Marcin Zajenkowski, “The Dunning-Kruger effect is (mostly) a statistical artefact: Valid approaches to testing the hypothesis with individual differences data,” which a couple of other papers, Krueger and Mueller (Journal of Personality and Social Psychology, 2002), and Krajc and Ortmann (Journal of Economic Psychology, 2008), that make a similar point.
Anyway, if all these analyses are correct, it’s interesting that people have been pointing it out for nearly twenty years in published papers in top journals, but the message still isn’t getting through.
One relevant point, I guess, is that even if the observed effect is entirely a product of regression to the mean, it’s still a meaningful thing to know that people with low abilities in these settings are overestimating their true abilities how well they’ll do. That is, even if this is an unavoidable consequence of measurement error and population variation, it’s still happening.
@Andrew: “When evaluating a prediction, you should plot actual vs. predicted, not predicted vs. actual.”
Do you mean to plot predicted vs. residuals over plotting observed vs. residuals? (as mentioned in the text you would simply flip x and y axis …)
Stefan:
I recommend putting predicted on the x-axis. We discuss this further in Regression and Other Stories, I think it’s chapter 11 of that book.
It’s not a simple flip because the results group differently if you plot them on the other variable.
If you take someone who predicts a zero performance, he can easily overperform randomly, but not underperform (can’t get worse than 0!); the opposite would be true for a 100% prediction. So you’d then conclude that low performers underestimate themselves, and high performers overestimate. That is opposite to the Dunning-Kruger-effect, so if you still see that effect when you plot the data that way, you can’t dismiss it as a statistical artifact.
P.S.: now that I see fewer comments on the sidebar, is there a RSS feed for comments?
Well good, because I always thought that invocation of Dunning-Kruger as a debating tactic just dumbs things down.
Is regression to the mean a plausible alternative? I think of that phenomenon occurring two ways:
1. When a small sample yields an average result that is skewed from the true mean, but if you add more data the true mean emerges.
2. A single result, such as a test score, is far from the mean, but if that individual were tested more extensively, their score would be closer to the mean.
I cannot apply these concepts to this data. The graph shows that more highly skilled people tend to consider themselves more highly skilled. But their true ability is not the mean of their expectations.
Sooo…regression to what mean? If there is no meaningful mean, then does the same concept apply some other way?
Can it be regression to the mean if the lines cross in the middle of the graph and then go the opposite way?
Matt, your points 1 and 2 aren’t quite wrong or irrelevant but I still feel like you’re missing something: Both of your points suggest that the ‘true’ value of something is measured with error, but that is not a requirement in order to have regression towards the mean.
Consider the heights of children and their adult parents; this is what Galton was talking about when he discovered ‘regression towards the mean’. Very tall parents tend to have children who are shorter than them.Very short parents tend to have children who are taller than them. It doesn’t matter how accurately you measure the heights of the parents and the children, or how many times you do so; this will still be true). Perhaps there’s a way to fit this example into your paradigm but I’m not sure you’d learn much from doing so.
In that example, wouldn’t model “error” be anything not explained by the parent’s heights? Uncorrelated iid normal variation from a model is not necessarily due to measurement error, it can be anything that is not conditioned upon in the prediction.
The true model is too cumbersome (genetics, environmental factors, etc.) to write down, so we call it _noise_ and live with the proxies.
“Measuring more accurately” in that case would be to take into account that only some of the height factors are due to genetics, and those are partly passed on to offspring. So when you get an observation with a pair of very tall parents in a normally drawn population, it’s more likely that it comes from favourable heritable traits (partly predictive) and favourable non-heritable factors (non-predictive), than from _very_ favourable traits and _slightly_ unfavourable factors. Hence, offspring is likely to be closer to the population mean than the parents’ height would lead you to believe.
If you model the heritable traits (and transmission probabilities) independently from non predictive factors, there shouldn’t be any regression to the mean population — how could there be? You conditioned on everything relevant.
MM,
Yes, you can think of the parents’ height as an error-ful prediction of child’s height. But I don’t see how that fits into Matt’s paradigm. See his two points above, neither seems to apply in this example.
Hi Phil,
I was merely pointing out that the example either
(a) can become relevant by conditioning only on heritable traits and having the parents procreate a lot (point 1), or
(b) is not really an example of “regression to the mean”, since neither the parents’ height nor the population mean is the expected value of the offspring’s height.
I appreciate the discussion on this. In hindsight, I guess Andrew’s reference to regression to the mean just meant that the folks at either end of the D-K graph are in reality less wrong about themselves that the graph suggests. In other words, the first and fourth quartiles are really more like the second and third. If that was the intended meaning, I guess I don’t have a problem with it. I do prefer the term “artifact” in this case though. Folks in the first quartile who guess conservatively will overestimate, and folks in the fourth quartile who guess conservatively will underestimate. Guesses should be conservative! That is a classic artifact.
MM,
Your point a is an example of what I meant when I said “perhaps there’s a way to fit this example into [Matt’s] paradigm but I’m not sure you’d learn much from doing so.”
“The true model is too cumbersome…to write down, so we call it _noise_ and live with the proxies.”
Excellent! This is the first time I’ve seen this stated on this blog. Andrew always talks about variation as though it’s random. But you don’t know until you know. Often it’s due to causal effects that haven’t been isolated and perhaps multiple causal effects that may work in opposite directions, but nonetheless have actual physical causes, not just random variation.
Andrew likes to infer that people who claim things like “my grandad smoked and he lived to 95!” just don’t get statistics. In making this claim he presumes that this 95 year old smoker is jn the tail of the random variation. But that’s not necessarily true. The 95 yr old smoker may have genetic traits that protect they from the negative health effects of smoking.
jim,
It’s not either-or. In most contexts, extreme data points are a result of chance combined with other factors. The SF Giants won 107 regular-season games this year. They’re good AND they were lucky.
Also: If we take your hypothetical example of the person pointing to their 95-year-old grandpa to claim smoking isn’t dangerous (I’m assuming that’s why the person would be pointing this out), your point doesn’t help at all! Someone who sees a single extreme data point and claims that it proves something in this context really _doesn’t_ understand statistics!
“It’s not either-or. In most contexts, extreme data points are a result of chance combined with other factors. ”
The component of chance would depend on the issue. I wouldn’t agree to blanket statement that there is a large component of chance in “most contexts” – the contexts in which statistics are applied are far to variable to make such a sweeping statement, and in the data analysis age, stats are being applied to rapidly growing variety of issues.
“If we take your hypothetical example of the person pointing to their 95-year-old grandpa to claim smoking isn’t dangerous ”
That’s not my claim. My claim is that the danger is dependent on the individual – genetics, behavior, and other environmental variables that might be in the individual’s control – and that the “risk” by pooling all people and all conditions misrepresents the actual risk.
More generally I mean to highlight the fact that statistics frequently misconstrues the true risk of activities or behaviors because it often doesn’t even distinguish or specify the number of dimensions of variation, much less their relative and much much less exact magnitudes.
Yesterday there was an announcement about the “new” risks of taking aspirin to prevent heart attack – now supposedly the risk bleeding (i guess) from using a blood thinner is deemed to be greater than the risk of heart attack.
I don’t doubt the general conclusion given the pool of “everyone”. But I wonder it’s actually relevant to anyone, given that most people aren’t average and the decision to take it would normally be the result of specific conditions anyway.
So after all the statistical mumbo jumbo, the result is pretty much the same as it was before: if you have a specific condition for which it’s known to help, take it
People think they are closer to the median than they actually are in a lot of ways.
If people are asked to assess their BMI/(socio)economic status %,
you will likely get less than 10% for those who think they are the most overweight/poorest 10% and also the most underweight/richest 10%.
On a different note, I agree Dunning-Kruger effect has become a meaningless cudgel in practice.
Every time I observe claims of Dunning-Kruger effect, it is usually aimed at somebody who is loudly wrong.
However, people are wrong about a lot of things and some of them are mistakenly confident.
That is true regardless of Dunning-Kruger effect.
I was wondering whether the fact that ‘Dunning-Kruger effect’ is abused by people who don’t really understand it is some meta-evidence of Dunning-Kruger effect, but then the most efficient explanation is the same old boring ‘people are wrong about a lot of things and some of them are mistakenly confident.’
Add in the fact that confident (and wrong) statements get more attention than less confident (and correct) statements and we have a perfect storm.
People making confident wrong claims get outsize attention and gets mislabeled with a phenomenon that might or might not be a statistical artifact.
“People think they are closer to the median than they actually are in a lot of ways.”
Very true, but that might have something to do with the homophilic tendencies of social networks. If birds of a feather flock together (e.g. those with a similar socio-economic status interact mostly with others of the same), then their typical observations would lead them to believe that the variation around a mean is much smaller than it really is. On the graph above, everyone thinks they’re in the 5th to 8th decile, even those in the 1st or 10th one.
I suspect that if you were to ask people how they ranked in height wrt the general population of their country, or city even, you would not get the same deviations because their sample would be less biased.
” I agree Dunning-Kruger effect has become a meaningless cudgel in practice.
Every time I observe claims of Dunning-Kruger effect, it is usually aimed at somebody who is loudly wrong.”
Or someone is loudly citing D-K to argue that someone else is wrong. The one who is citing D-K is almost surely making a fallacious argument.
I think maybe part of the “zombie” aspect here would be that there’s a common sense element, ala “The more you know the more you know what you don’t know.”
I remember seeing some evidence regarding how culture might mediate the DK effect. Obviously subject to confirmation bias, I have often felt this way with many Asian students that I’ve worked with – where I’d I complimented them on an achievement they’d often feel a kind of cultural obligation to explain the accompaniment away as being somehow a mater of luck. The idea of them saying “I did well because I studied very hard.” was not something that came easily to them.
I also remember reading about a similar phenomenon worth poor-achieving vs. high-achieving students, where poor-achieving students would attribute luck to external factors (which goes back to saying something about the sense of agency that high-achieving students had that helps to explain their high achievement).
Anyway, I think there may be a basic underlying validity to the DK effect but that like many views on causal relationships, people tend to under-estimate the importance of mediators, moderators, and interaction effects…
“it’s still a meaningful thing to know that people with low abilities in these settings are overestimating their true abilities. That is, even if this is an unavoidable consequence of measurement error and population variation, it’s still happening.”
I don’t think I understand this. If it’s regression to the mean from measurement error, then they’re not overestimating their true abilities, right? It’s just that the test underestimated the true abilities of the low scorers. And to the degree that it’s not explained by measurement error, then it’s a ‘real’ effect isn’t it?
Though the mechanism is still unclear. Suppose there’s no measurement error and the Dunning-Krueger plot is perceived versus actual ability. Then couldn’t the phenomenon be explained, for example, by everyone anchoring their self assessments to the population average without any need for “they don’t know enough to know how bad they are”?
I agree with the point at the beginning of the post that in reality the mechanism for overestimates and underestimates of ability is probably heterogeneous. Some people are overestimating their abilities because they know too little to make a good guess, some are anchoring to the population mean, and there are probably a ton of other mechanisms at work too. If the effect is ‘real’, it would be interesting to try to design experiments that tease out these mechanisms and how common they are.
Z:
Fixed; thanks.
… poor-achieving students would attribute success (a good score on a test) to luck or external factors….
Might I suggest that “Towards Data Science” might provide a corpus of material for the next study on this effect?
https://www.linkedin.com/posts/petercotton_datascience-statistics-activity-6826128954504683522-bXPy
Holy moly this is perfect. I do everything in my power up steer young data scientists away from TDS .
How would one compare the DK Effect with Carol Dwecks characterization of ‘growth’ and ‘fixed’ mindsets?
Context is so important.
I think Philip Tetlock’s Expert Political Judgment has so many lessons in terms of how we characterize and evaluate intelligence. It would be great to read a blog post by him. I guess I’m more interested in how and why super intelligent people can overestimate their own accuracy and actually make the mistakes that super intelligent people attribute to those less educated than they.
My Dad received a large number of 1st prizes in All-India debates and at Cambridge University. But man, he seemed to have a humble view of his intelligence. Maybe that was b/c he had less ambition than his colleagues. A little off topic. Apologies.
There has to be some regression to the mean here. And it might explain the entire effect at the top two quartiles. However, the effect at the bottom quartile just seems too large to be regression to the mean.
Shouldn’t this at least somewhere acknowledge that this post is a (near?) verbatim re-posting of your article (which I coincidentally came across this morning…) here:
https://blog.isi-web.org/react/2021/09/dunning-kruger-effect/
I can understand cross-posting, and know your audience is here (evidenced by the fact there are multiple comments here within a day rather than 0 in a month at the other link) – but it wouldn’t hurt to flag it.
At a minimum you’ll save the time of a few readers of both blogs – and you’d dodge any insinuations of self-plagiarism.
Anon:
I wrote this post awhile ago, I guess half a year ago or more. It was sitting in my queue. In the meantime, my colleague at the ISI blog said she could use some material, so I went through my queue and found a couple of posts for her, including this one. She rewrote it slightly and posted it. Meanwhile I forgot the whole thing! The good news is that I only did this two or three times, so you don’t have to worry about it happening often.
Never doubted that it was in good faith rather than bad – and 100% get that posting here has a higher level of engagement.
Still – surely worth an edit to flag this appeared elsewhere first, for the same reasons above, but also to help publicise the ISI blog?
To be clear – I only found my way to the blog in the first place by following the links in the ‘Blogs we read’ section that is now more prominent in the web redesign.
Symmetric over-/under- estimation with on-average no bias could be explained by regression to the mean, but that’s not what DK showed. See Matt Skaggs’s comment.
I a similar vein, and keeping in mind that I haven’t looked into any of the papers actually mentioned in this post (including the Dunning-Kruger paper), this seems implausible to me on the face of it from the Dunning-Kruger plot. The plotted prediction are above the 50th percentile for every single group!
Like I said I haven’t looked at any of the underlying data or into the papers. Maybe the samples are small and some hint of the distributions should have been shown, or perhaps there are points in these other papers that deal with this. But that fact alone seems to suggest that whatever may be at play in the figure shown here, simple regression to the mean seems unlikely to be enough to explain it. No? At the very least people seem on average to be overestimating their ability.
Betteridge’s Law of Headlines:
“Any headline that ends in a question mark can be answered by the word no.”
I guess I’m not as good at detecting the Dunning-Kruger effect as I thought I was.
+1
The paper by Nufher E, et al. is really comprehensive and explains it step-by-step (read the appendix as well):
https://digitalcommons.usf.edu/numeracy/vol10/iss1/art4/
One point I find it interesting, instead of saying that the Dunning Krugger effect is completely false vs completely true, Nufher proposed a third hypothesis:
“The relationship between self-assessed competence and demonstrable competence is meaningful and measurable. Some people exhibit significant overconfidence or underconfidence, but overall, people’s self-assessed competence is in accord with a competence that they can demonstrate. (Ackerman, Beier and Bowen 2002; Nuhfer and Knipp 2006; Favazzo, Willford and Watson 2014; Handel and Fritzsche 2016; Nuhfer et al. 2016a; this paper)”
I don’t think the news article did enough justice on Nufher papers, hahaha. But, I digress. After all, it’s extremely hard to convey these complex concepts to the general public.
Following that, I also found an interesting observation. I shared this blog post about Dunning Krugger with someone who works in the data space (one would assume the person has enough knowledge to understand it) and he found it extremely difficult to follow the arguments in this blog post. After our discussion, I came to realize that there are underlying requirements/assumptions to comprehend what message you are trying to convey such as the knowledge of Andrew’s writing style, Andrew’s assumed set of knowledge, this blog’s readers and their assumed set of knowledge.
Oh, also, this is not a criticism. I just find it interesting that it requires a lot of shared common knowledge to understand this post :)
As usual, thanks for sharing this post! keep up the great discussion.
The Dunning-Kruger effect isn’t really an effect in an empirical sense. If you reed their paper, all they claim is that sometimes, but not always, we do not fully comprehend some subject or task and overestimate our ability. Of course this is true. We all know that from personal experience.
I think of social psychology studies of this type as basically a form of literature, similar to short stories based on some observation from common human experience. The data bit is about illustration, not testing. After all, what would we make of a negative “test” of this effect?
But the result is so *satisfying*. It has to be true!
I would not think that calling it “regression to the mean” counts as an explanation. If it indeed looks like regression to the mean just by looking at the data, then there is still an interesting psychology question: Why do people think they are more like the mean than they actually are?
Now it does not look really like regression to the mean to me, because every group predicts their performance to be *above* average, so calling it “regression to the mean” answers nothing of interest (even if you are only interested in patterns of data and not cognitive mechanisms underlying them).
An individual differences approach hinging on correlations has little to offer here: that subjective self-assessments correlate with objective skill measurements concerns only relative ranking, not estimation accuracy. People can still wildly overestimate their own ability while (correctly) realizing that their ability is lower than the next man’s. Indeed this is consistent with the original DK graph posted above.
It seems to me that it is the actual difference between subjective self-assessment and objective measurement that is of interest here, and the original study suggests that it is both decreasing in magnitude and flipping in sign in the direction from least to most competent. If that’s a reliable effect (I haven’t followed the literature and don’t know that it is) then for me calling it “regression to the mean” lies somewhere between “inaccurate” and “uninformative” — hardly an explanation.
Late to the party, but I have a related paper basically at the same time as DK, with simple theory called moderated confidence .
People have imperfect information on the quality of their information, so they have to average the base rate of informedness. As a result, people who are truly well-informed will underestimate the quality of their information and be underconfident, while those who are truly poorly informed will be overconfident. It’s a symmetric theory, but if you add in an average (and well-established) tendency toward overconfidence, you get exactly the DK graph.
I don’t see DK as a mirage, except for the common interpretation that people who are bad at something are worse at detecting their badness because they lack the skills to know what is bad. That might be true in principle, but the data don’t really bear it out as a general feature. My guess is that is true only when the thing they are bad at is self-evaluation.
I read the McGill article back in January, and got inspired to write some R code replicating their figures (more or less, the formatting isn’t quite as nice), which interested readers can find here: https://pinboard.in/u:cshalizi/b:faac8efe5364
The upshot of doing so is that I don’t think the argument in that piece is fairly describable as “regression to the mean”. But it _is_ an argument that even if D&K’s subjects had perceived their ability in a completely unbiased way, the way D&K analyzed the data (essentially regressing percentile of perceived ability on percentile of actual ability, as in the figure in the OP) was guaranteed to give their finding.