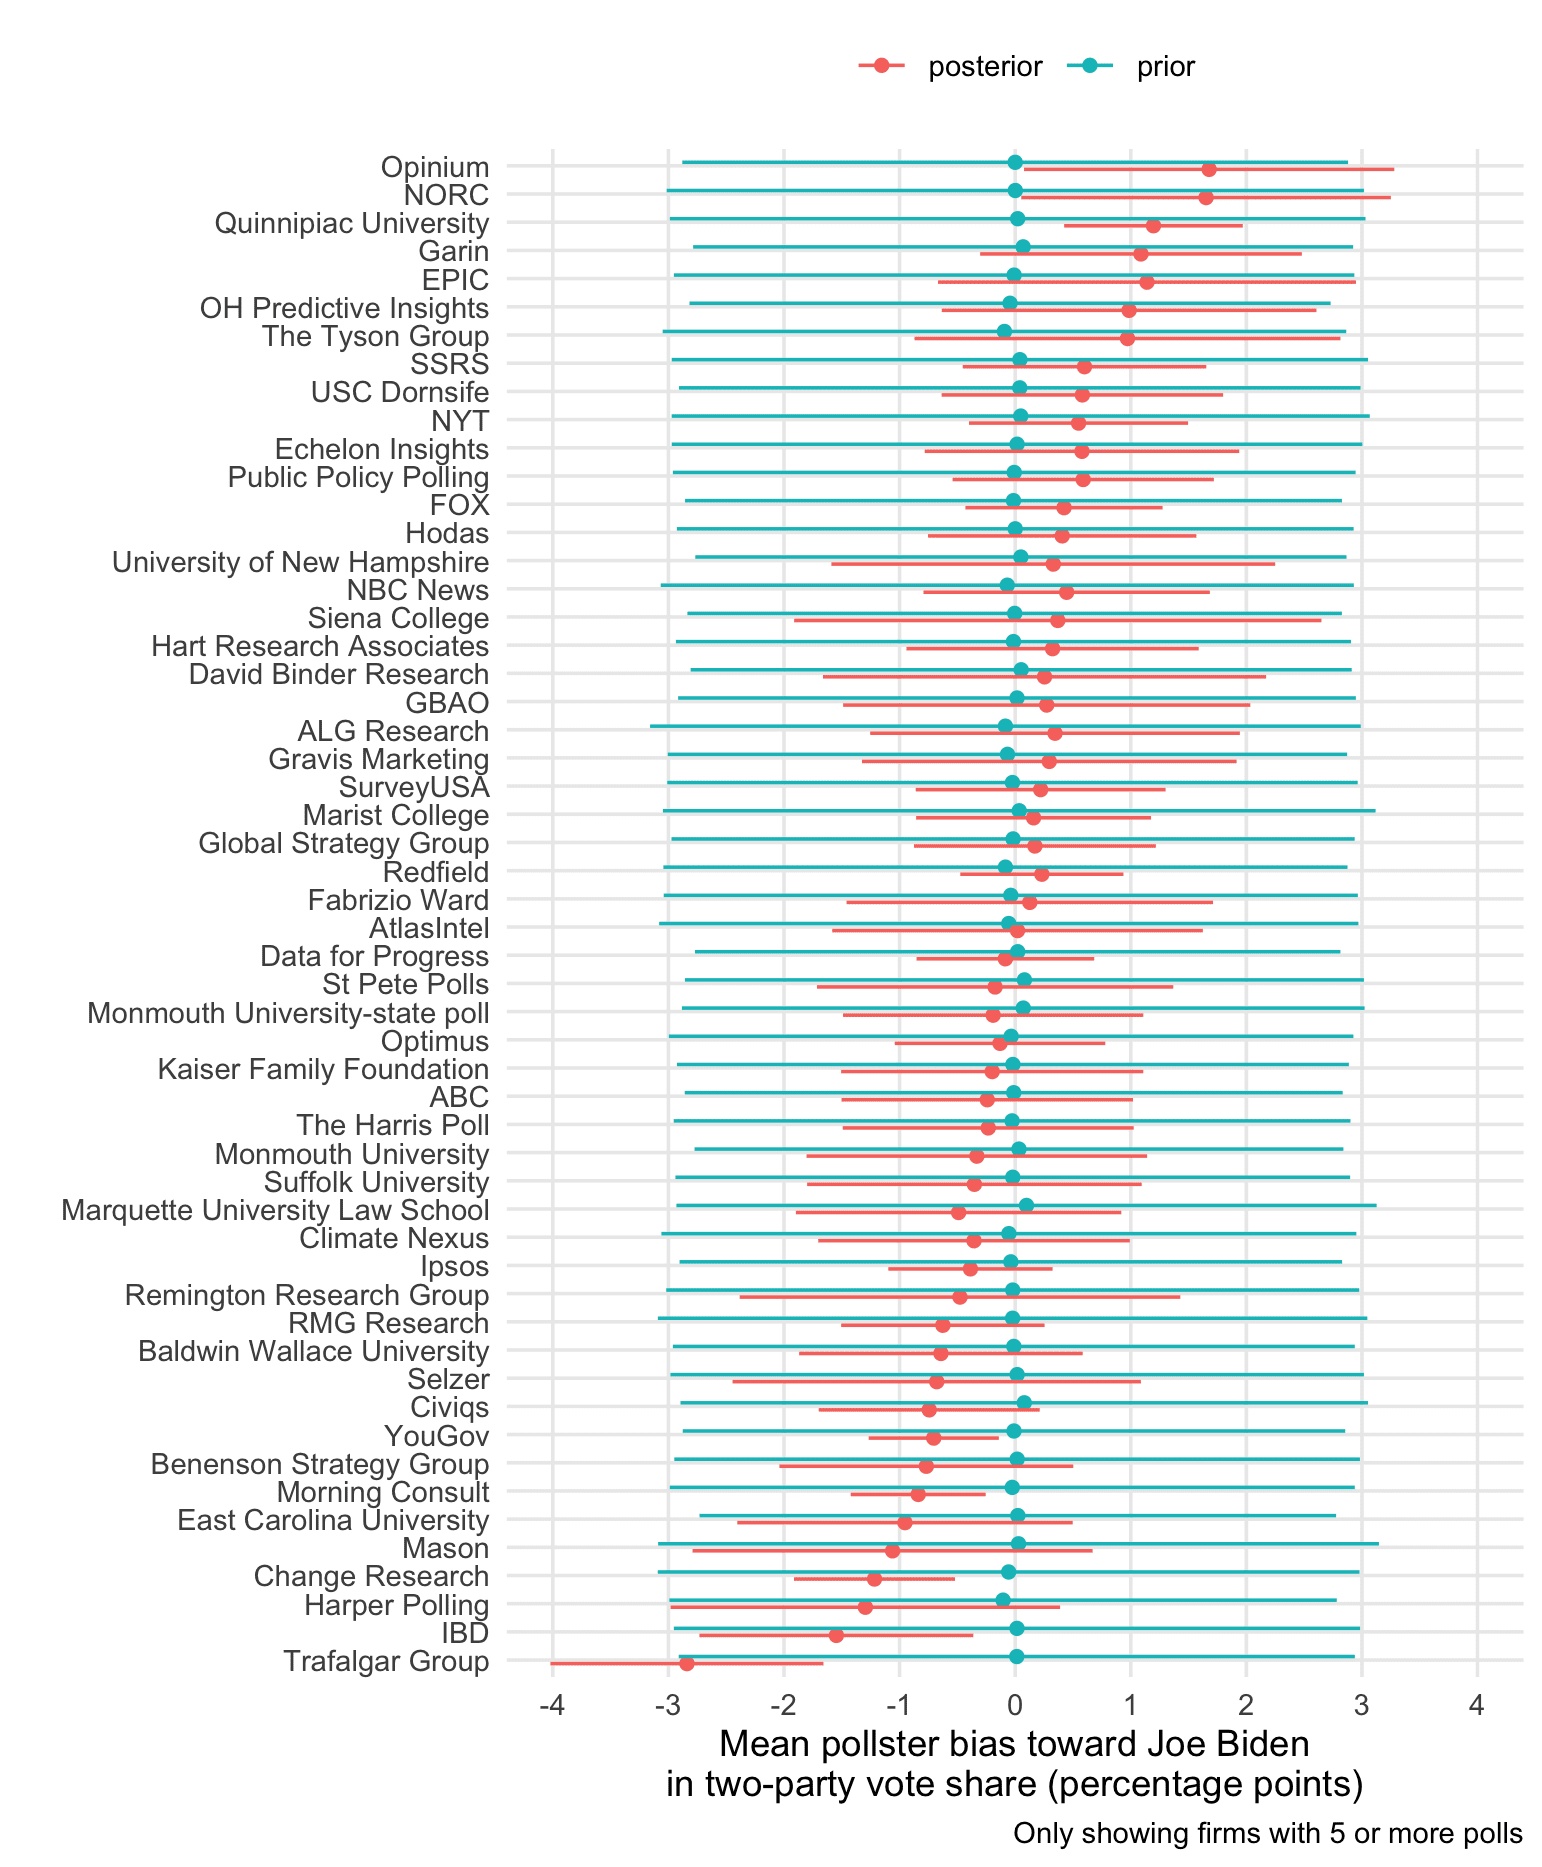
Elliott provides the above estimates from our model. As we’ve discussed, as part of our fitting procedure we estimate various biases, capturing in different ways the fact that surveys are not actually random samples of voters from an “urn.” One of these biases is the “house effect.” In our model, everything’s on the logit scale, so we divide by 4 to get biases on the probability scale. The above numbers have already been divided by 4.
So we estimate the most biased polling organizations to range from about +2 Biden to +3 Trump, but with most of them between -1 and 1 percentage points. (This is in the scale of vote proportion, not vote margin.)
You can also see that there’s lots of uncertainty about the house effect for any given pollster. That’s because we used a weak prior, normal with mean 0 and sd 1.5, implying that a priori we didn’t say much about house effects except that they’re most likely less than 2 percentage points in either direction.
I have no reason to think that most of these biases represent any kind of political biases coming from the polling organizations. Rather, different orgs use different data collection methods and do different adjustments. So they’ll get different answers. In any given election cycle, these different approaches will have different biases, but with only a few polls it’s hard to pin down these biases with any precision, especially given that each poll has its own idiosyncratic bias as well, having to do with whatever was going on the day the survey was in the field.
Don’t overinterpret the chart!
It’s tempting to read the above graph and use it to rate the polls. Don’t do that!
Let me emphasize that a survey having a low estimated bias in the above chart does not necessarily mean it’s a better poll. I say this for two reasons:
1. The estimates of bias are really noisy! It would be possible to get an illusorily precise estimate of house effects by doing some simple averaging, but that would be wrong because it would not account for nonsampling errors that vary by poll.
2. Even if these estimates were precise, they’re just for the current 2020 campaign. Polling and adjustment strategies that work well this year might run into problems in other settings.
“I have no reason to think that most of these biases represent any kind of political biases coming from the polling organizations.”
Good thing you put “most” in there. This is a random grab from the Twitter account of Robert C. Cahaly, self-described “chief pollster” for the Trafalgar Group:
“The whole @trafalgar_group team and I appreciate this @newtgingrich shout out on @seanhannity #FoxNews show. The Speaker’s policies, ideas & strategic approach, in the early 90s inspired 1000s of young people (like me) to pursue political engagement.”
Can you adjust the prior when the pollster openly admits to “political engagement” in favor of one candidate? ;)
Funnily enough, I was just reading about the Trafalgar Group and their methods. It will certainly be interesting to see how this election shapes up.
That being said, I’ve really enjoyed playing around with [1], but you have to make ad hoc adjustments by state. It would also be useful to be able to add some way to express, “what if it turns out that these polls are not as biased as people think” and then evaluate what happens to the election forecast.
[1] https://www.ricardofernholz.com/election/
The fact that the pollster has a political agenda doesn’t automatically mean their polls are biased. If the polls are for strategic use, the last thing they would want – *because* they have an agenda – is to waste precious time campaigning in the wrong place. All the more so if you’re candidate is behind. You would want to get the biggest bang possible out of every stop, so you would want accurate info.
Most people have a very strong preference for one candidate or the other, especially in this election. That’s surely true of just about everyone who works at any of these polling organizations. I wouldn’t want to ding an organization just because they’re willing to be open about their preference. But in this case we have additional information: the quote also suggests that Gingrich and Hannity prefer Trafalgar’s estimates to those of other pollsters. Indeed, the quote gives us two pieces of information that we can think about separately:
1. Gingrich and Hannity like Trafalgar’s results so much that they called them out specifically, suggesting they are at variance with those of other pollsters.
2. The Chief Pollster for the Trafalgar Group is a big fan of Newt Gingrich.
It’s impossible for me to return to the state of ignorance I was in prior to reading the quote, but I think #2 alone would not have greatly altered my prior distribution for Trafalgar’s bias — I probably would have extended the left (red) tail while leaving the median about the same — but #1 would have changed it a whole lot.
Phil, seriously, they only have a -3 bias toward Biden. Strategic gold! :)
What are they going to say after the election? The whole thing was a fraud, a sham? All the four hundred other pollsters were part of the scheme? Hilarious.
Unless Trump wins!
Well, that’s a whole different kind of scam ain’t it? :)
Jim:
People don’t usually seem to feel the need to figure out what went wrong with their models. I don’t think Scott Adams ever reflected on what went wrong with his reasoning in 2016 when he predicted that Trump would win by a landslide. I guess maybe it’s considered ok to be optimistic (such forecasts represent hope rather than pure rationality) or to be pessimistic (bad things will eventually come to pass). And that pretty much covers it.
“People don’t usually seem to feel the need to figure out what went wrong with their models.”
Actually that’s a the explanation for most of the shit that’s wrong with the world today.
Now that I think about it most models and projections aren’t even trying to inspire the outcome they predict. For most people in most circumstances, the “model” they’re selling you is just a tool convince you to let them do what they want. Once they’ve gotten over that hump, whether the model was right or wrong hardly matters. It’s served it’s purpose.
Political polling is a weird, parallel universe. That is because there is a belief that if a candidate appears more viable, she is more viable, because folks might not turn out if they think their candidate has no chance. So this goal orientation felt by some pollsters skews pretty much everything. It is what makes me give more credence to a Fox poll showing Biden leading than one from a place with a name like Monmouth University (which I know nothing about and so give a zero prior).
So while what Andrew wrote is certainly true, that “different orgs use different data collection methods and do different adjustments,” some of those adjustments do indeed involve putting a thumb on the scale.
And then there are these entity names, like “Benenson Strategy Group,” “Global Strategy Group,” and “Data for Change.” I don’t want my polling entities to have a strategy or be working for change!
…and this year there’s also the fear that if Biden looks *too* far ahead some Democratic-leaning-but-not-strongly-committed people might not bother to vote (as it seems to be widely thought that the widespread assumption that Trump had no chance had that effect in 2016).
Didn’t the Biden campaign just come out with something like ‘no we’re not really ahead by 10+’?
Have you compared your estimates of house effects to those of 538? I just looked picked two, Mason which you estimate as +1R is +0.6R “mean reverted bias” on 538 and The Tyson Group you estimate at +1D is +0R on 538. Your intervals are pretty wide so maybe comparison is not very useful, but seems like it might be worth checking if things are generally agreeing. See https://github.com/fivethirtyeight/data/tree/master/pollster-ratings
I also wonder if it might make sense to somehow incorporate 538’s ratings into your prior. Why start with a weak prior assuming unbiased polls if we have some general information on how polls are biased?
N:
I don’t think we’d want to literally use their ratings, because I assume that much of their rating is based on the same data we’re using. It could make sense to allow for correlation in pollster ratings from one election to the next. I’m not sure how high the correlation would be, though, given that pollsters are always trying to do better. But, sure, I agree with your general point that additional information is out there, and we should be able to use it in some way.
/ “Rather, different orgs use different data collection methods and do different adjustments. So they’ll get different answers.”
Has not the professional discipline of Survey Research by now established which Data Collection Methods and Data Adjustment Methods are valid and objectively recommended ?
Why would professional polling organizations have any significant methodology variations when examining exactly the same (relatively straightforward) issue ?
Clemente:
If the response rate were 100%, then, yeah, it’s all straightforward math. When response rate is less then 10%, then lots of choices need to be made. Different pollsters make different choices. This was the case 30 years ago (see here), and it’s even more so today.
Dear Sir
One way to avoid overinterpretation might be to present the distribution the biases, or bias estimates, found over the range from +2 Trump to +2 Biden (or whatever the actual extremes are) and see if it is normal.
Yours Sincerely
“Let me emphasize that a survey having a low estimated bias in the above chart does not necessarily mean it’s a better poll.”
I would add an additional reason to the two you list, and that’s that there are other metrics besides bias that count for a poll’s quality. For example, if I’m reading the chart correctly, lower uncertainty is the house effect is also a good metric. A poll with that (a) enters the field a lot, and (b) has house effects that are *consistent* from poll to poll, will have lower uncertainty, and vice versa lower uncertainty makes it likely that both those are true. I think both are things you’d look for in a good pollster.
Looking at the chart, I notice that Quinnipac, Ipsos, and YouGov are all among the lowest uncertainty polls in the list, even though they’re not the most “neutral”. This seems to confirm my claim – these are usually considered high quality polls, and you can extract a lot of accurate information from them, even if they’re not right on the money when it comes to predicting election outcomes.
It looks like the election could go either way. Thanks for the heads up.