This came up in response to a student’s question.
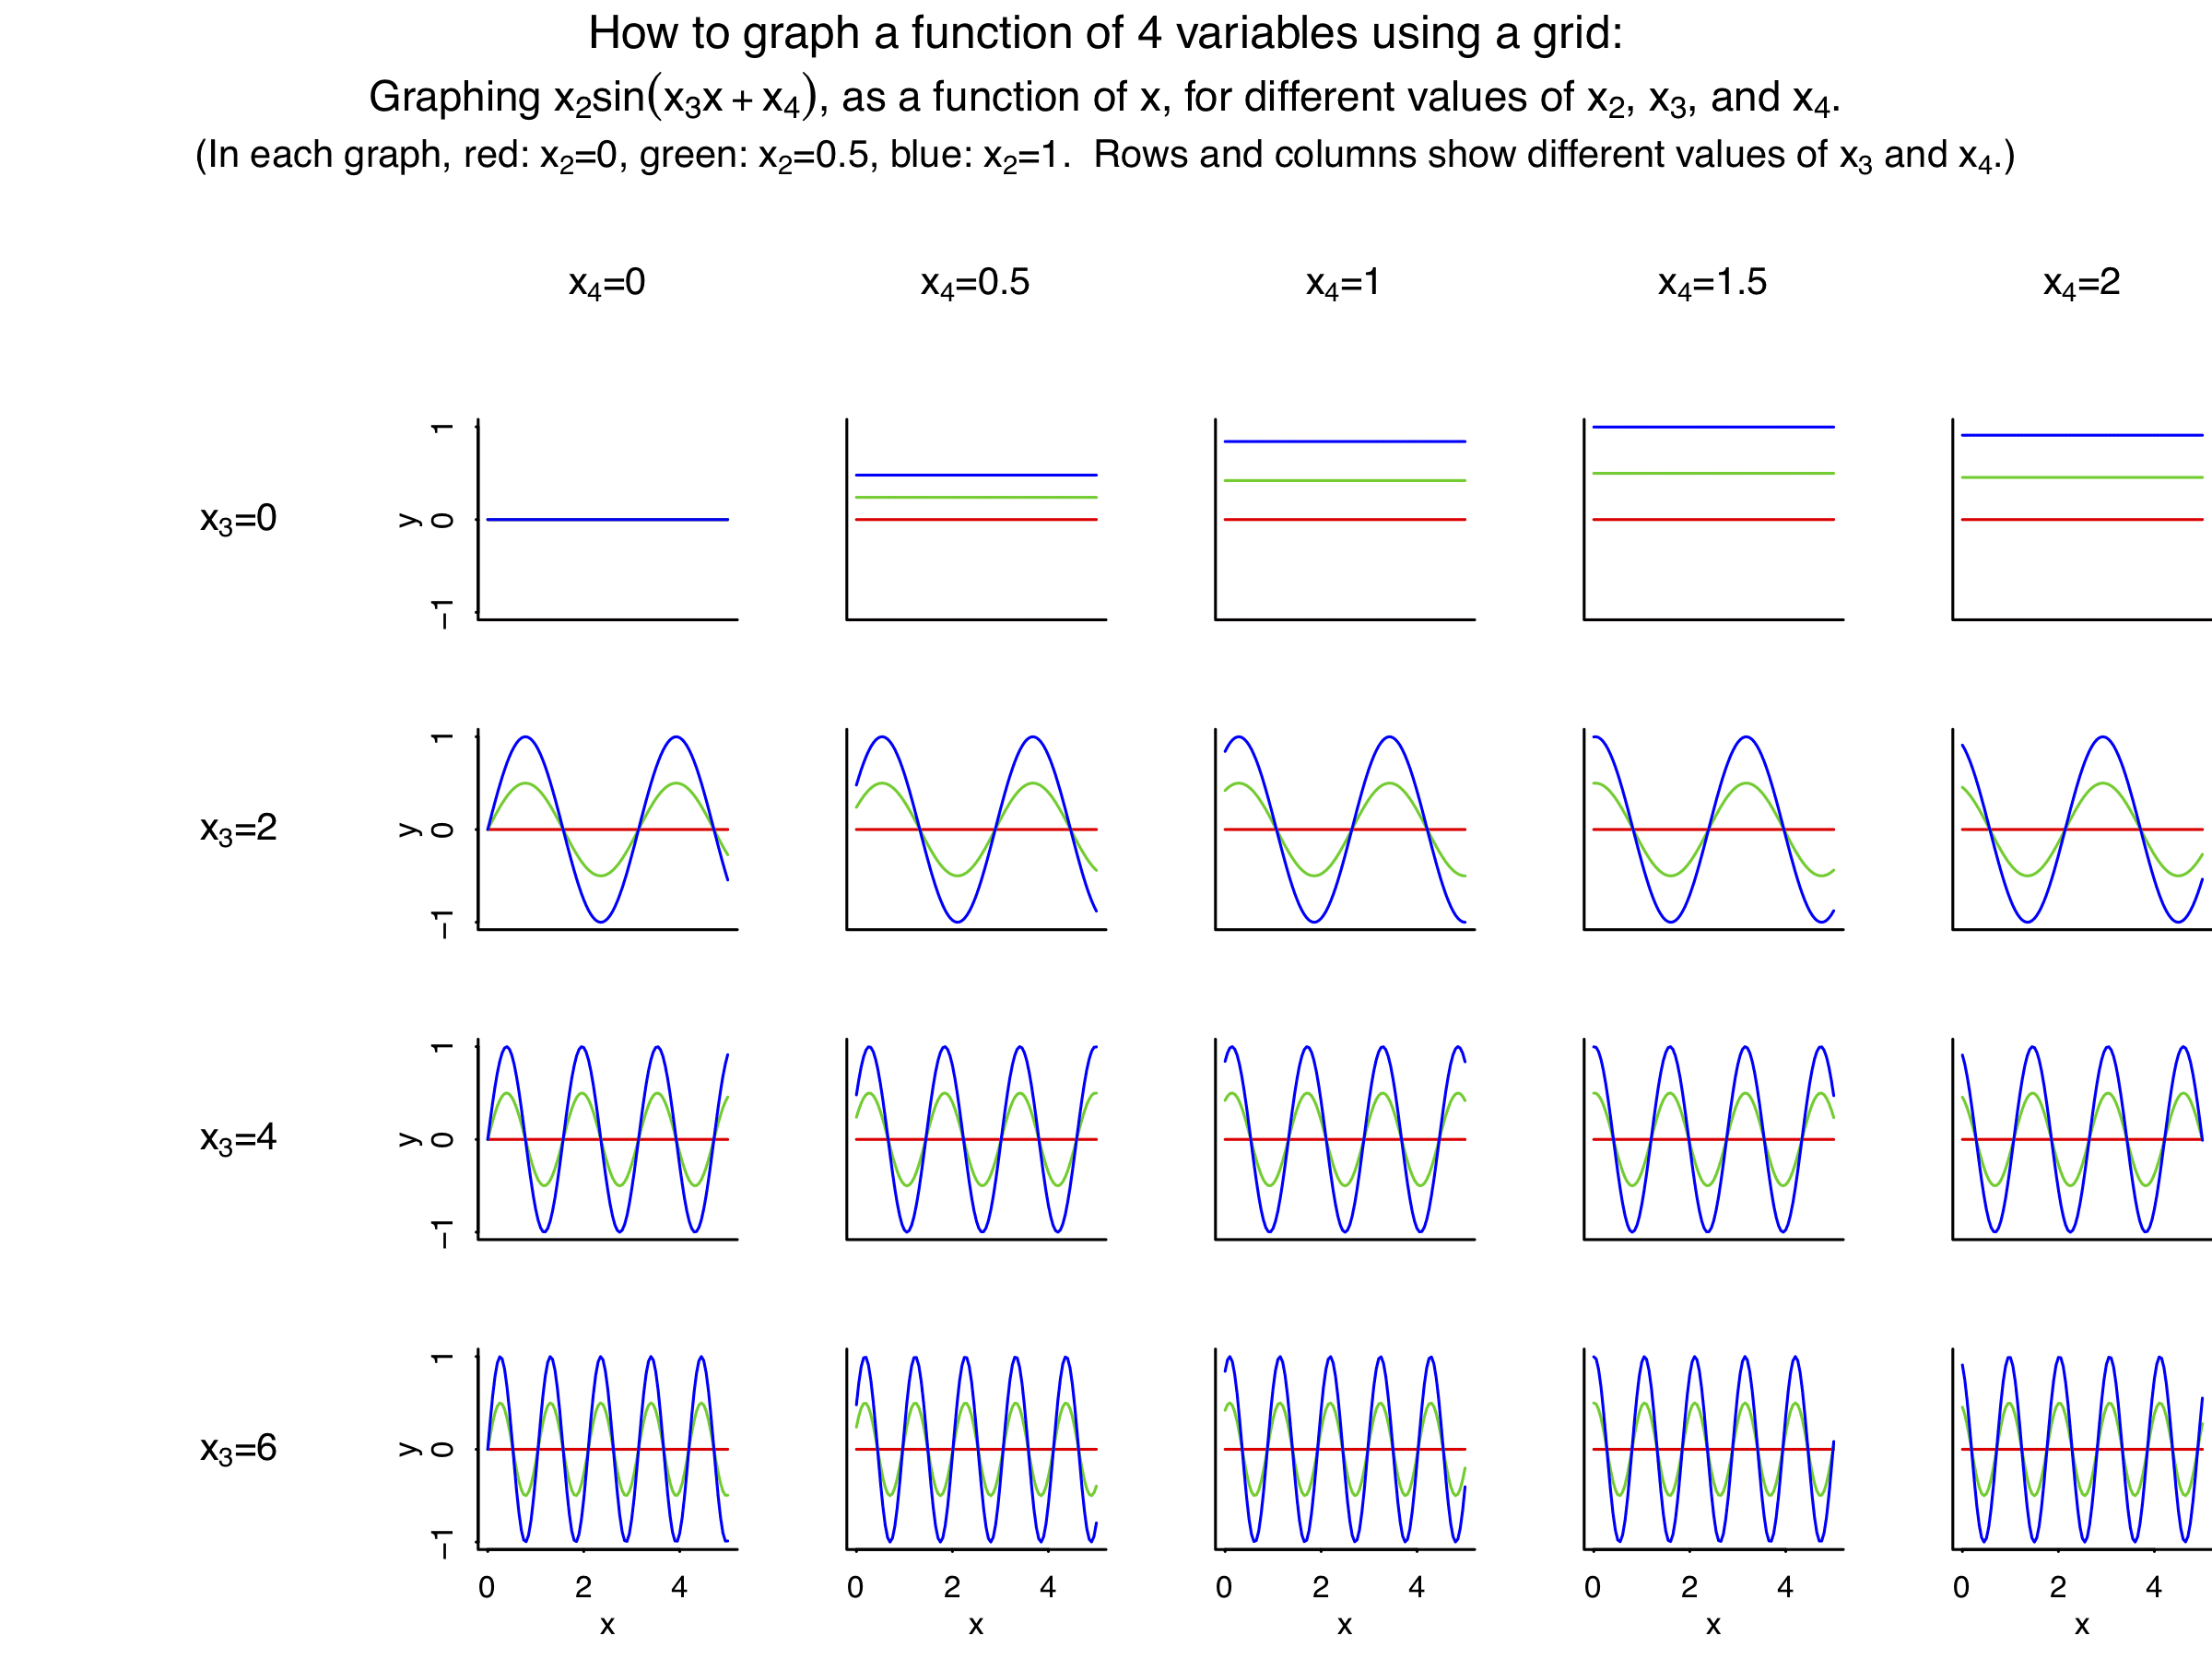
I wrote that, in general, you can plot a function y(x) on a simple graph. You can plot y(x,x2) by plotting y vs x and then having several lines showing different values of x2 (for example, x2=0, x2=0.5, x2=1, x2=1.5, x2=2, etc). You can plot y(x,x2,x3,x4) by making a two-dimensional grid of plots, where the rows show different values of x3 and the columns show different values of x4.
Then I thought I should illustrate with a graph:
It took me about an hour to make this in R (or maybe half an hour, as I was doing other things at the same time). The code is really ugly; see below. Among other things, I had difficulty with the expression() function in R. I expect it should be much easier and more effective to do this in ggplot2.
[Check out the comments, which include several excellent implementations of this idea in ggplot2. If this doesn’t induce me to switch to ggplot2, I don’t know what will! — ed.]
Anyway, below is my code, which I include not out of pride but out of honesty. I could clean it up a bit but I might as well show you what I did. In any case, the grid of graphs illustrates the general point of how to plot a function of many variables, a point which I don’t think is as well known as it should be.
pdf("2waygrid.pdf", height=6, width=8)
par(mfrow=c(5,6))
par(mar=c(3,3,0,0), tck=-.01, mgp=c(1.5,.5,0))
par(oma=c(0,0,3,0))
x2_grid <- seq(0, 1, 0.5)
x3_grid <- seq(0, 6, 2)
x4_grid <- seq(0, 2, 0.5)
empty_plot <- function(x=0, y=0, a="") {
  plot(c(-1, 1), c(-1, 1), xlab="", ylab="", xaxt="n", yaxt="n", bty="n", type="n")
  text(x, y, a, cex=1.2)
}
curve_to_plot <- function(x, x2, x3, x4){
  return(x2*sin(x3*x + x4))
}
x_min <- 0
x_max <- 5
empty_plot()
empty_plot(0, -0.8, expression(paste(x[4], "=", 0)))
empty_plot(0, -0.8, expression(paste(x[4], "=", 0.5)))
empty_plot(0, -0.8, expression(paste(x[4], "=", 1)))
empty_plot(0, -0.8, expression(paste(x[4], "=", 1.5)))
empty_plot(0, -0.8, expression(paste(x[4], "=", 2)))
for (i in 1:4){
  if (i==1)
    empty_plot(0, 0, expression(paste(x[3], "=", 0)))
  else if (i==2)
    empty_plot(0, 0, expression(paste(x[3], "=", 2)))
  else if (i==3)
    empty_plot(0, 0, expression(paste(x[3], "=", 4)))
  else if (i==4)
    empty_plot(0, 0, expression(paste(x[3], "=", 6)))
  x3 <- x3_grid[i]
  for (j in 1:5){
    x4 <- x4_grid[j]
    plot(c(x_min, x_max), c(-1, 1), xlab=if (i==4) "x" else "", ylab=if (j==1) "y" else "", xaxt="n", yaxt="n", bty="l", type="n")
    if (i==4) axis(1, c(0,4,2))
    if (j==1) axis(2, c(-1,0,1))
    for (k in 1:3){
      x2 <- x2_grid[k]
      curve(curve_to_plot(x, x2, x3, x4), from=x_min, to=x_max, add=TRUE, col=(k+1))
    }
  }
}
mtext("How to graph a function of 4 variables using a grid:", side=3, line=1.5, outer=TRUE)
mtext(expression(paste("Graphing ", x[2]*sin(x[3]*x + x[4]), ", as a function of x, for different values of ", x[2], ", ", x[3], ", and ", x[4], ".")), side=3, line=-0.5, outer=TRUE, cex=0.9)
mtext(expression(paste("(In each graph, red: ", x[2], "=0, green: ", x[2], "=0.5, blue: ", x[2], "=1.  Rows and columns show different values of ", x[3], " and ", x[4], ".)")), side=3, line=-2, outer=TRUE, cex=0.8)
dev.off()
I know this is no place for the whole ggplot vs base R debate, but, nevertheless:
https://imgur.com/a/pCzGyOi
library(ggplot2)
library(cowplot) # Nice minimal theme
df = expand.grid(
x = seq(0, 5, .1),
x2 = seq(0, 1, 0.5),
x3 = seq(0, 6, 2),
x4 = seq(0, 2, 0.5))
df$y = with(df, x2*sin(x3*x + x4))
ggplot(df, aes(x, y, color=factor(x2))) +
facet_grid(x3~x4,
labeller = label_bquote(rows=x[3] == .(x3),
cols=x[4] == .(x4))) +
scale_color_manual(values=c(‘red’, ‘green’, ‘blue’)) +
geom_path() +
theme_cowplot(font_size=14) +
theme(strip.placement = “outside”, legend.position=’none’)
ggsave(‘4xPlot.png’, width = 8, height = 6)
Eoin:
There is no debate. Everyone agrees that ggplot is better.
Why do you find it to be better?
Anon:
It just seems that people can write in a few quick lines of ggplot2 code what takes me a half hour to tweak using base graphics.
Yep, ggplot2 is more declarative, you write “what” you want to plot. base graphics are more imperative, you write “how” you want the computer to draw things. Declarative languages are usually vastly more productive for creating objects, like SQL queries to create tables of data.
I whipped up an approximation of the same idea in ggplot, which is definitely a little easier!
the tidyverse makes it somewhat simpler:
library(dplyr)
library(ggplot2)
x1_grid <- seq(0,5, 0.01)
x2_grid <- seq(0, 1, 0.5)
x3_grid <- seq(0, 6, 2)
x4_grid <- seq(0, 2, 0.5)
df %
rename( x1 = Var1, x2 = Var2, x3 = Var3, x4=Var4) %>%
mutate( z = x2*sin(x3*x1+x4) )
df %>%
ggplot(aes( x=x1, z, colour = factor(x2)))+
geom_line()+
facet_grid(x3~x4)
Looks like it got munged, here is what it should have been:
expand.grid(
x1 = seq(0, 5, 0.01),
x2 = seq(0, 1, 0.5),
x3 = seq(0, 6, 2),
x4 = seq(0, 2, 0.5)
) %>%
mutate(z = x2 * sin(x3 * x1 + x4)) %>%
ggplot(aes(x = x1, y = z, colour = factor(x2))) +
geom_line() +
facet_grid(x3 ~ x4)
It reminding me of the most enjoyable seminar at the U of T stats dept where David Andrews discussed how he came up with and implemented the details of a plot to win a multivariate data analysis challenge at Bell Labs – https://en.wikipedia.org/wiki/Andrews_plot
p.s. I am am not logged in I only get day old SMCISS blog :-(
If I am not logged in I only get day old SMCISS blog :-(
This is a one-liner in ggplot2:
library(ggplot2)
f = function(x1, x2, x3, x4) x2 * sin(x1 * x3 + x4)
df = expand.grid(x1=seq(0,5,.1), x2=seq(0,1,.5),
x3=seq(0,6,2), x4=seq(0,2,.5))
df = within(df, y <- f(x1, x2, x3, x4))
ggplot(df, aes(x=x1, y=y)) + geom_line(aes(group=x2, colour=x2)) + facet_grid(x3~x4)
GG2FTW!
I wrote a function (called flexplot) recently that makes this easier. It’s just a wrapper for ggplot. Here’s the basic notation:
flexplot(y~x1+x2|x3 + x4, data=data, se=F)
That will put x1 on the x axis, x2 as different lines, x3 in columns, and x4 in rows. If anyone’s interested, it’s on github: dustinfife/fifer
Surely a coincidence that the current xkcd is also about plots
https://xkcd.com/2048/
It’s not that much less code, but would scale to more levels without new code for each new level.
Unfortunately GoDaddy seem to think I’m trying to hack their server with my R code.
This is great – thanks for posting this. This plot is beautifully simple and I think will make an excellent example to share with colleagues.
(I struggle with `expression()` every $&#^ time.)
To revive an old debate. I created the graph using JMP – no programming required. It took me a half hour – but that’s because I was too stupid to realize how to randomize the rows for the x2, x3, and x4 variables. If I had thought of using the Random Integer function at first it actually took about 5 minutes. I can’t paste the picture into the comment (although I’ll try, but I don’t think it works), but it looks the same as what Andrew generated. So, the old debate is: is programming important? Clearly some mathematical reasoning was required for me to enter the right formulas, but Graph Builder in JMP made it easy to display the 5 variables in one graph. I’m not saying that programming does not have beneficial effects, but these exchanges about R or ggplot make me wonder once again why programming is so great.
(can’t paste images and I can’t get it onto my website at the moment but it does look the same)
> I created the graph using JMP – no programming required.
I know what you mean here, but at a fundamental level, I disagree, clicking the appropriate series of buttons to get a piece of software to automatically perform a certain graphing task is programming whether the buttons are on-screen menu items or just the individual keys on your keyboard. The fundamental concepts behind programming: describing to a computer how a task should be carried out, still remains.
I don’t really want to revive the old debate, suffice it to say that there are lifetime positive payouts to learning a general purpose programming language, and if you’re in the position where those payouts are meaningful (ie. you’re going to do more than say 2 data analysis projects in your lifetime) then a semester long course on R programming or Python programming or the like will pay for itself about a thousand times over.
I love JMP. It’s what I always use if I need to do something fairly simple. And it is so much easier to teach to non-statisticians than R.
The big case for coding, besides having far more flexibility in what you can do, is reproducible research. I suppose I could save JMP scripts if I really wanted. But if I’m working with a team, or working on a project that I might need to come back to in a year, I want to have code.
Here’s a link to my graph that might work:
https://lorasedu-my.sharepoint.com/:i:/g/personal/dl526303_loras_edu/EeYE33UImVBIieh1AF8-lggBjUWditCoZ_TCmWk2jEKaXA?e=SEs7ei
Is anyone else experiencing strange behavior on this blog – new posts don’t appear for a long time, comments appear and disappear, the number of comments listed do not match the actual number, etc.?
See my comment above
Logged on as author I have Posted by Andrew on 21 September 2018, 9:49 am
Without logging in I am at Posted by Andrew on 20 September 2018, 1:08 pm
Hey this gives me about 12 hours to appear to be smarter than other commenters ;-)
This link should work: https://www.dropbox.com/s/otw1d6znygge6ch/image3620371360.jpg?dl=0
Sorry about multiple postings, but since none of them are appearing after I post them I don’t feel quite as bad. Eventually all 3 of my comments should show up I think.
One of your favorite targets just got his due.
https://www.motherjones.com/food/2018/09/brian-wansink-the-cornell-professor-known-for-his-fun-food-research-retires-amid-scandal-1/
expand.grid(x2 = c(0, 0.5, 1),
x3 = c(0, 2, 4, 6),
x4 = c(0, 0.5, 1, 1.5, 2),
x = seq(0, 4, length.out = 100)) %>%
mutate(y = x2* sin((x3 * x) + x4)) %>%
ggplot(aes(x, y, color = factor(x2))) +
geom_line() +
facet_grid(x3 ~ x4)
I just recreated this plot in CUDA on a GTX 1070, it was ~1000x as fast as ggplot.
Red and green are hard to distinguish between for color-blind people or when you print out stuff in B&W. I would use different line types (and perhaps different colors in addition, just to emphasize the difference).
Daumantas,
Yes, good point.