When demonstrating his Alice in Wonderland example, Brad Paley showed how the words in the center of the display were located by grabbing a word with his mouse, clicking to show its connections with places in the text, and then moving the word, showing the lines of the connections stretching, then letting go to show the word bounce back. The image of the word connected to the places using rubber bands was clear.
What I want to know is, can somebody rig a robot arm to do this so I could feel the pull? Imagine a robot arm that can be moved within a 30cm x 40cm box. You could use this to feel the springiness of the connections in Brad’s diagram; the idea is that you’d say a word (for example, “Alice”); the pointer of the robot arm would move to the position of the word in the display, and then you could–with effort–move the robot arm away from this place. When you let go or relax your grip, the pulling of the virtual rubber bands would return the arm back to its original place, and you could feel the strength of the pull.
The arm could also be used to feel a curve (for example, a nonlinear regression or spline, or a mathematical function such the logarithm or the normal distribution curve), as follows: the arm would start at one end of the curve and the user could grip it and move it along, with the motion physically constrained so that the arm would trace the curve.
In displaying several curves–for example, level curves indicating indifference curves – the arm could start on one of the curves and be programmed to stay on that curve, unless the user pushes hard, in which case there would be resistance during which the arm moves between curves. It would then lock into the next curve, which the user could again trace until he or she pushes hard enough to get the arm unstuck again.
More generally, the robot arm could be used for exploring three-dimensional functions such as physical potentials, likelihood functions, and probability densities. From any point in the two-dimensional box, a “gravitational force” would pull the arm toward a local minimum (or, for a likelihood or probability density, the maximum) of the function. Then with moderate effort the user could move the arm around and, by feeling the resistance, get a sense of gradients, minima, and constraints.
(for example, a nonlinear regression or spline, or a mathematical function such the logarithm or the normal distribution curve), as follows: the arm would start at one end of the curve and the user could grip it and move it along, with the motion physically constrained so that the arm would trace the curve.
In displaying several curves–for example, level curves indicating indifference curves – the arm could start on one of the curves and be programmed to stay on that curve, unless the user pushes hard, in which case there would be resistance during which the arm moves between curves. It would then lock into the next curve, which the user could again trace until he or she pushes hard enough to get the arm unstuck again.
More generally, the robot arm could be used for exploring three-dimensional functions such as physical potentials, likelihood functions, and probability densities. From any point in the two-dimensional box, a “gravitational force” would pull the arm toward a local minimum (or, for a likelihood or probability density, the maximum) of the function. Then with moderate effort the user could move the arm around and, by feeling the resistance, get a sense of gradients, minima, and constraints.
An example of how I’d like to use the robot arm together with a visual graph of data and model fit
I was originally thinking of this as a statistical tool for blind people, but I’d actually like to have one of these myself, for example to understand the sensitivity of a model fit to changes in parameter values. I’m thinking of twp graphs next to each other: a graph of parameter space and a graph of data with fitted curves. The robot arm would be pointed to the posterior mode or maximum likelihood estimate in parameter space. As I moved the robot arm around, I’d feel resistance–it would be difficult to move far in parameter space without feeling the increase in -log(density)–and at the same time the curve would be moving in the fitted curve + data plot. The muscular resistance information on one graph and the visual information on the other graph would together give me a sense of what aspects of the data are determining the model fit.
Here’s an example of what it might look like:
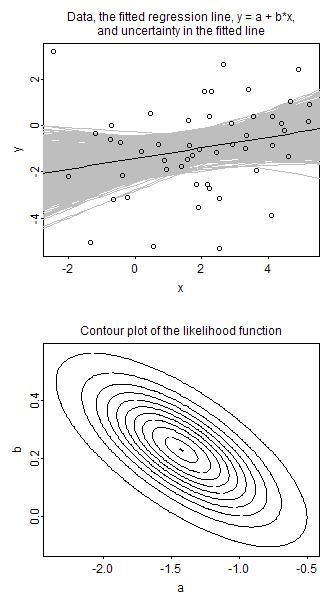
I’d also like to be able to use the robot arm to pull on the fitted curve and feel the resistance as I move it away from the data.
P.S. Here’s the R code for the above graphs:
# Illustration of the graph of model parameters and datalibrary (arm)
n <- 50 x <- rnorm (n, 2,2) a <- -2 b <- .5 sigma <- 2 y <- rnorm (n, a+b*x, sigma) M1 <- lm (y ~ x) display (M1) loglik <- function (x, y, a, b, sigma){ return (sum (dnorm (y, a+b*x, sigma, log=TRUE))) } range.a <- coef(M1)[1] + se.coef(M1)[1]*c(-2.5,2.5) range.b <- coef(M1)[2] + se.coef(M1)[2]*c(-2.5,2.5) n.grid <- 100 a.values <- seq (range.a[1], range.a[2], length=n.grid) b.values <- seq (range.b[1], range.b[2], length=n.grid) ll <- array (NA, c(n.grid,n.grid)) for (i in 1:n.grid){ for (j in 1:n.grid){ ll[i,j] <- loglik (x, y, a.values[i], b.values[j], sigma.hat(M1)) } } ll <- ll - max(ll) lik <- exp (ll) png ("2graphs.png", height=600, width=320) par (mar=c(3,3,3,0), mgp=c(1.5,.2,0), tck=-.01, mfrow=c(2,1)) plot (x, y) n.sims <- 1000 sims <- sim (M1, n.sims)$coef for (s in 1:n.sims){ curve (sims[s,1] + sims[s,2]*x, lwd=.5, col="gray", from=-10, to=10, add=TRUE) } curve (coef(M1)[1] + coef(M1)[2]*x, from=-10, to=10, add=TRUE) points (x, y) mtext ("Data, the fitted regression line, y = a + b*x,nand uncertainty in the fitted line", line=.5) contour (a.values, b.values, lik, levels=c(seq(.05,.95,.1),1), labels="", xlab="a", ylab="b", yaxt="n") axis (2, seq(0,.6,.2)) # kluge to make the y-axis not look stupid mtext ("Contour plot of the likelihood function", line=.5) dev.off()
I used a system along the lines you describe, at the University of Glasgow. It was a demonstration of the haptics research project there.
http://www.dcs.gla.ac.uk/%7Estephen/visualisation…
There is a haptic remote control, the Novint Falcon, which attaches to a computer and provides resistance to create the illusion of touch. It may fit your needs. I got a chance to try one last year and it was amazing how well it mimicked the feel of a slingshot. The few other simulations also felt vividly like real touch.
Specifications aren't quite up to what you'd like:
3D Touch Workspace
4" x 4" x 4"
Force Capabilities
2 lbs
Position Resolution
400 dpi
However, it is only 200 bucks, runs over USB, and comes with a system developers kit, so it has dynamic libraries ready to use with other applications.
This might be a place to start to see if this project would be worth pursuing in a higher resolution, larger workspace, and a more costly environment.
Hi Andrew,
Since you're at Columbia I'd suggest walking over to Claude Ghez's lab and asking to look at their haptic equipment. They have research-grade equipment that can generate 'force fields' and measures muscular force in exactly the way you are describing.
Your statement of the problem made me think of sonification — converting the data to sound — as being a possible solution. In particular, model-based sonification proposes an interesting way to convert, e.g., N-dim physical potentials into a sonic timbre.
The desire for tactile interaction with a graphics display has been around for a long time. At the Princeton Computer Graphics Lab in the early 1970s, the best we could do then was to create an illusion, which was pretty effective. We used the first commercial graphics system (Evans & Sutherland LDS-1), driven by data from a PDP-10 to model RNA for x-ray diffraction studies (the head of the lab, Bob Langridge, was a protégé of Maurice Wilkins). Graphics was a vast improvement over Watson & Crick’s wire models because, for a given molecular configuration, you could instantly run a fast Fourier transform on the coordinates and see whether you reproduced the x-ray data. The problem was generating the initial coordinates, which involved chemical intuition and guesswork. Fortunately, constraints of chemical bonding and molecular symmetry reduced the set of unknown variables to a small number of dihedral angles along the helical chain backbone. I used a combination of input devices to input initial guesses for these angles. These devices included a bank of circular potentiometer knobs whose settings could be translated into angles from zero to 2 pi radians, binary switches to control program flow, and a joystick. Each knob was assigned to a separate backbone dihedral angle of the RNA. By rotating a given knob I could observe on the screen the deformation that changing its dihedral angle had on the entire molecule. Changing only a single angle without regard for backbone connectivity was not useful because it usually led to impossible conformations. You had to turn several knobs by small amounts one after the other so as not to rip the molecule apart. You could see how “close” you were to a stereochemically allowable solution by displaying a connectivity function that went to zero for a perfect solution. Very small changes in one knob or another could lead to order of magnitude increases in the function. A real-time display of a graph of the function, plus a lively imagination, gave the powerful illusion that we could “feel” ourselves climbing up and down energy contours towards a minimum as we tweaked the knobs. Today it wouldn’t be difficult to spring-load each knob so that the force required to turn it was related to a function of molecular conformation, such as a Lennard-Jones energy function. In reality, when we got close to a visual minimum we turned loose an old Courant Institute minimization algorithm called BOTM to finish the job.
I don’t have a web site, but if you want to see a photograph of the system you can download it from http://www.stellman.com/sds91. You can also download our paper in Macromolecules with the geometric details and screen shots.
Incidentally, the photo shows 3 strip microphones arranged as x, y, and z-axes, that could sense the location of the tip of a sparking pen, so we could trace solid models to capture atomic coordinates. If you look closely you can also see a rotating wheel with alternating opaque and transparent sectors that, synchronized with images, allowed the viewer to see 3-dimensional images. A wheel with alternating colored sectors was available to generate color images.
You seem to suggest that you could learn something mathematically from such a robot arm. But this is untrue, your eyes viewing a graph, and other mathematical techniques to show other trends are far more powerful. Your ideas are fun but not useful.
I think you are merely fantasising with no end result. The ability to be able to simulate touch with a robot arm is of course useful in regard to remote bodies (which we would control remotely obviously), and of course for replacement limbs for amputees. But usefulness to 'feel' datasets is pointless, but I agree fun. I can understand though the need in regard to visually impaired individuals.