I blogged on this awhile ago and then recently Hal Stern and I wrote a little more on the topic. Here’s the paper, and here’s the abstract:
A common error in statistical analyses is to summarize comparisons by declarations of statistical significance or non-significance. There are a number of difficulties with this approach. First is the oft-cited dictum that statistical significance is not the same as practical significance. Another difficulty is that this dichotomization into significant and non-significant results encourages the dismissal of observed differences in favor of the usually less interesting null hypothesis of no difference.
Here, we focus on a less commonly noted problem, namely that changes in statistical significance are not themselves significant. By this, we are not merely making the commonplace observation that any particular threshold is arbitrary–for example, only a small change is required to move an estimate from a 5.1% significance level to 4.9%, thus moving it into statistical significance. Rather, we are pointing out that even large changes in significance levels can correspond to small, non-significant changes in the underlying variables. We illustrate with a theoretical and an applied example.
The paper has a nice little multiple-comparisons-type example from the biological literature–an example where the scientists ran several experiments and (mistakenly) characterized them by their levels of statistical significance.
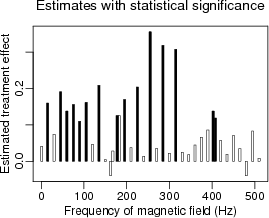
Here’s the bad approach:
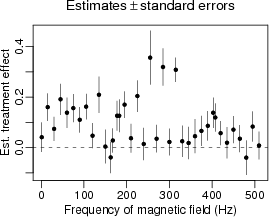
Here’s something better which simply displays esitmates and standard errors, letting the scientists draw their own conclusions from the overall pattern:
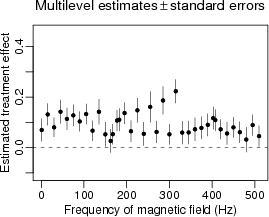
Here’s something slighlty better, using multilevel models to get a better esitmate for each separate experiment:
The original paper where these data appeared was really amazing in the extreme and unsupported claims it made based on non-significant differences in statistical significance.
I'm curious as to the reason you've used standard errors in the modified graphs? I tend to report either confidence intervals or standard deviations depending on what I'm trying to do. Standard errors seem to be an unsatisfactory compromise between the two; I end up trying to visualize what the confidence bounds would look like.
"Common Errors in Statistics" by Good and Hardin has an interesting discussion of the use of mean+/-standard error. They prefer the use of box and whisker plots or bootstrap confidence intervals.
Cmullin,
Just think of them as 68% intervals.