We have some graphs that extend earlier estimates of Brooks and Manza to show some of the trends in voting by occupation category over the past fifty years:
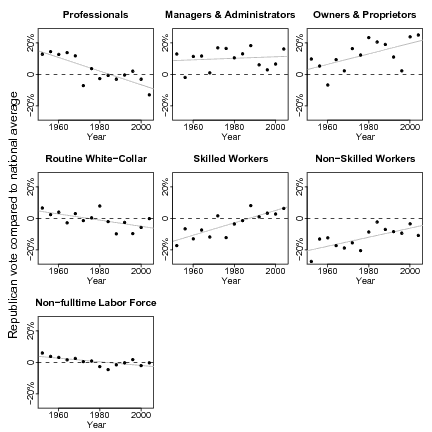
Professionals (doctors, lawyers, and so forth) and routine white collar workers (clerks, etc.) used to support the Republicans more than the national average, but over the past half-century they have gradually moved through the center and now strongly support the Democrats. Business owners have moved in the opposite direction, from close to the national average to being staunch Republicans; and skilled and unskilled workers have moved from strong Democratic support to near the middle.
These shifts are consistent with the oft-noted cultural differences between Red and Blue America. Doctors, nurses, lawyers, teachers, and office workers seem today like prototypical liberal Democrats, while businessmen and hardhats seem like good representatives of the Republican party. The dividing points were different 50 years ago. The Republicans still have the support of most of the high-income voters, but these are conservatives of a different sort. As E. J. Dionne noted in analyzing poll data from 2004, the Democrats’ strength among well-educated voters is strongest among those with household incomes under $75,000—“the incomes of teachers, social workers, nurses, and skilled technicians, not of Hollywood stars, bestselling authors, or television producers, let alone corporate executives.”
We tried to take our analysis further by regressing on income within occupation groups, but we didn’t find anything exciting; there wasn’t much evidence of different rich/poor voting gaps in different occupation categories. This Teixeira and Abramowitz article adds something to this picture because they talk about how the relative sizes of these different groups are changing. They write:
Dramatic shifts have taken place in the American class structure since the World War II era. Consider education levels. Incredible as it may seem today, in 1940 three-quarters of adults 25 and over were high school dropouts (or never made it as far as high school), and just 5 percent had a four-year college degree or higher. . . . by 2007, it was down to only 14 percent. . . . In 1940, only about 32 percent of employed US workers held white collar jobs (professional, managerial, clerical, sales). By 2006, that proportion had almost doubled to 60 percent . . . we [Teixeira and Abramowitz] discuss these shifts in the class structure and analyze their political implications, primarily by focusing on the decline of the white working class.
Pingback: Matthew Yglesias » Courting Small Business