(This post is by Jonah)
Last week I posted here about the release of version 2.0.0 of the loo R package, but there have been a few other recent releases and updates worth mentioning. At the end of the post I also include some general thoughts on R package development with Stan and the growing number of Stan users who are releasing their own packages interfacing with rstan or one of our other packages.
Interfaces
rstanarm and brms: Version 2.17.4 of rstanarm and version 2.2.0 of brms were both released to provide compatibility with the new features in loo v2.0.0. Two of the new vignettes for the loo package show how to use it with rstanarm models, and we have also just released a draft of a vignette on how to use loo with brms and rstan for many “non-factorizable” models (i.e., observations not conditionally independent). brms is also now officially supported by the Stan Development Team (welcome Paul!) and there is a new category for it on the Stan Forums.
rstan: The next release of the rstan package (v2.18), is not out yet (we need to get Stan 2.18 out first), but it will include a loo() method for stanfit objects in order to save users a bit of work. Unfortunately, we can’t save you the trouble of having to compute the point-wise log-likelihood in your Stan program though! There will also be some new functions that make it a bit easier to extract HMC/NUTS diagnostics (thanks to a contribution from Martin Modrák).
Visualization
bayesplot: A few weeks ago we released version 1.5.0 of the bayesplot package (mc-stan.org/bayesplot), which also integrates nicely with loo 2.0.0. In particular, the diagnostic plots using the leave-one-out cross-validated probability integral transform (LOO-PIT) from our paper Visualization in Bayesian Workflow (preprint on arXiv, code on GitHub) are easier to make with the latest bayesplot release. Also, TJ Mahr continues to improve the bayesplot experience for ggplot2 users by adding (among other things) more functions that return the data used for plotting in a tidy data frame.
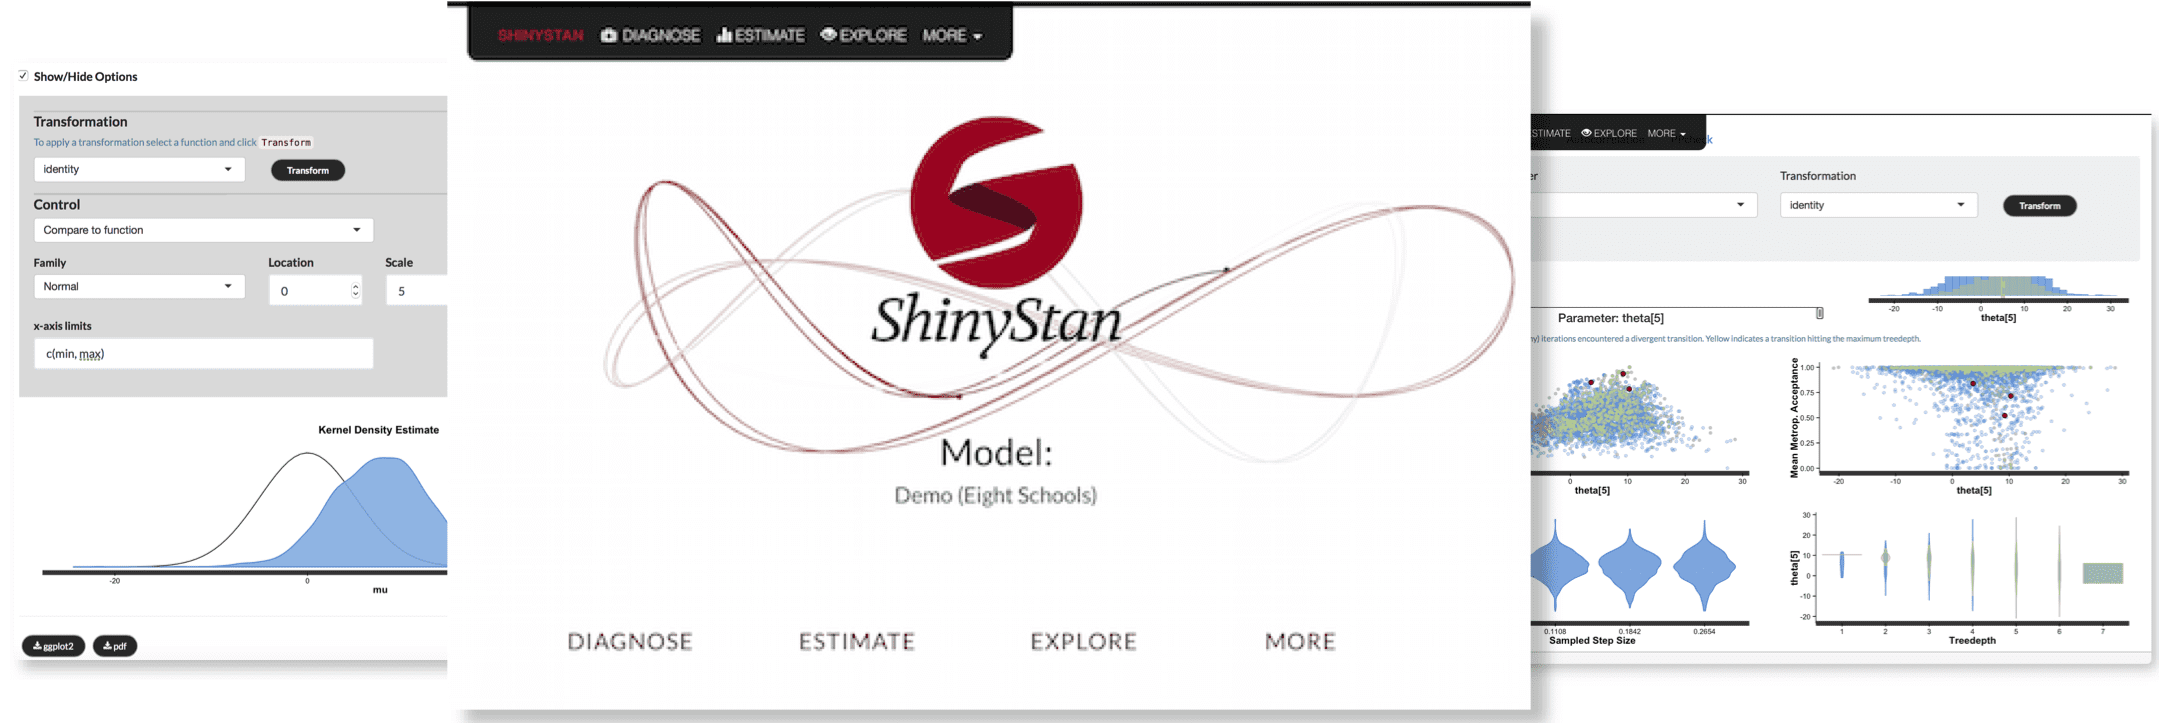
shinystan: Unfortunately, there hasn’t been a shinystan (mc-stan.org/shinystan) release in a while because I’ve been busy with all of these other packages, papers, and various other Stan-related things. We’ll try to get out a release with a few bug fixes soon. (If you’re annoyed by the lack of new features in shinystan recently let me know and I will try to convince you to help me solve that problem!)
(Update: I forgot to mention that despite the lack of shinystan releases, we’ve been working on better introductory materials. To that end, Chelsea Muth, Zita Oravecz, and I recently published an article User-friendly Bayesian regression modeling: A tutorial with rstanarm and shinystan (view).)
Other tools
loo: We released version 2.0.0, a major update to the loo package (mc-stan.org/loo). See my previous blog post.
projpred: Version 0.8.0 of the projpred package (mc-stan.org/projpred) for projection predictive variable selection for GLMs was also released shortly after the loo update in order to take advantage of the improvements to the Pareto smoothed importance sampling algorithm. projpred can already be used quite easily with rstanarm models and we are working on improving its compatibility with other packages for fitting Stan models.
rstantools: Unrelated to the loo update, we also released version 1.5.0 of the rstantools package (mc-stan.org/rstantools), which provides functions for setting up R packages interfacing with Stan. The major changes in this release are that usethis::create_package() is now called to set up the package (instead of utils::package.skeleton), fewer manual changes to files are required by users after calling rstan_package_skeleton(), and we have a new vignette walking through the process of setting up a package (thanks Stefan Siegert!). Work is being done to keep improving this process, so be on the lookout for more updates soonish.
Stan related R packages from other developers
There are now well over fifty packages on CRAN that depend in some way on one of our R packages mentioned above! You can find most of them by looking at the “Reverse dependencies” section on the CRAN page for rstan, but that doesn’t count the ones that depend on bayesplot, shinystan, loo, etc., but not rstan.
Unfortunately, given the growing number of these packages, we haven’t been able to look at each one of them in detail. For obvious reasons we prioritize giving feedback to developers who reach out to us directly to ask for comments and to those developers who make an effort to our recommendations for developers of R packages interfacing with Stan (included with the rstantools package since its initial release in 2016). If you are developing one of these packages and would like feedback please let us know on the Stan Forums. Our time is limited but we really do make a serious effort to answer every single question asked on the forums (thank you to the many Stan users who also volunteer their time helping on the forums!).
My primary feelings about this trend of developing Stan-based R packages are ones of excitement and gratification. It’s really such an honor to have so many people developing these packages based on all the work we’ve done! There are also a few things I’ve noticed that I hope will change going forward. I’ll wrap up this post by highlighting two of these issues that I hope developers will take seriously:
(1) Unit testing
(2) Naming user-facing functions
The number of these packages that have no unit tests (or very scant testing) is a bit scary. Unit tests won’t catch every possible bug (we have lots of tests for our packages and people still find bugs all the time), but there is really no excuse for not unit testing a package that you want other people to use. If you care enough to do everything required to create your package and get it on CRAN, and if you care about your users, then I think it’s fair to say that you should care enough to write tests for your package. And there’s really no excuse these days with the availability of packages like testthat to make this process easier than it used to be! Can anyone think of a reasonable excuse for not unit testing a package before releasing it to CRAN and expecting people to use it? (Not a rhetorical question. I really am curious given that it seems to be relatively common or at least not uncommon.) I don’t mean to be too negative here. There are also many packages that seem to have strong testing in place! My motivation for bringing up this issue is that it is in the best interest of our users.
Regarding function naming: this isn’t nearly as big of a deal as unit testing, it’s just something I think developers (including myself) of packages in the Stan R ecosystem can do to make the experience better for our users. rstanarm and brms both import the generic functions included with rstantools in order to be able to define methods with consistent names. For example, whether you fit a model with rstanarm or with brms, you can call log_lik() on the fitted model object to get the pointwise log-likelihood (it’s true that we still have a bit left to do to get the names across rstanarm and brms more standardized, but we’re actively working on it). If you are developing a package that fits models using Stan, we hope you will join us in trying to make it as easy as possible for users to navigate the Stan ecosystem in R.


