Werner Krauth is visiting NYU’s Simons Center for Physics from ENS in Paris. He’s a physicist and the author of the 2006 book Statistical Mechanics: Algorithms and Computations. And he’s stopping by our reading group Fridays, where I learned about his most peculiar approach to plotting. He coded it in Postscript (!!! see below) and ran simulations on the printer. The result is quite beautiful. Here’s Figure 1.10 from the text.
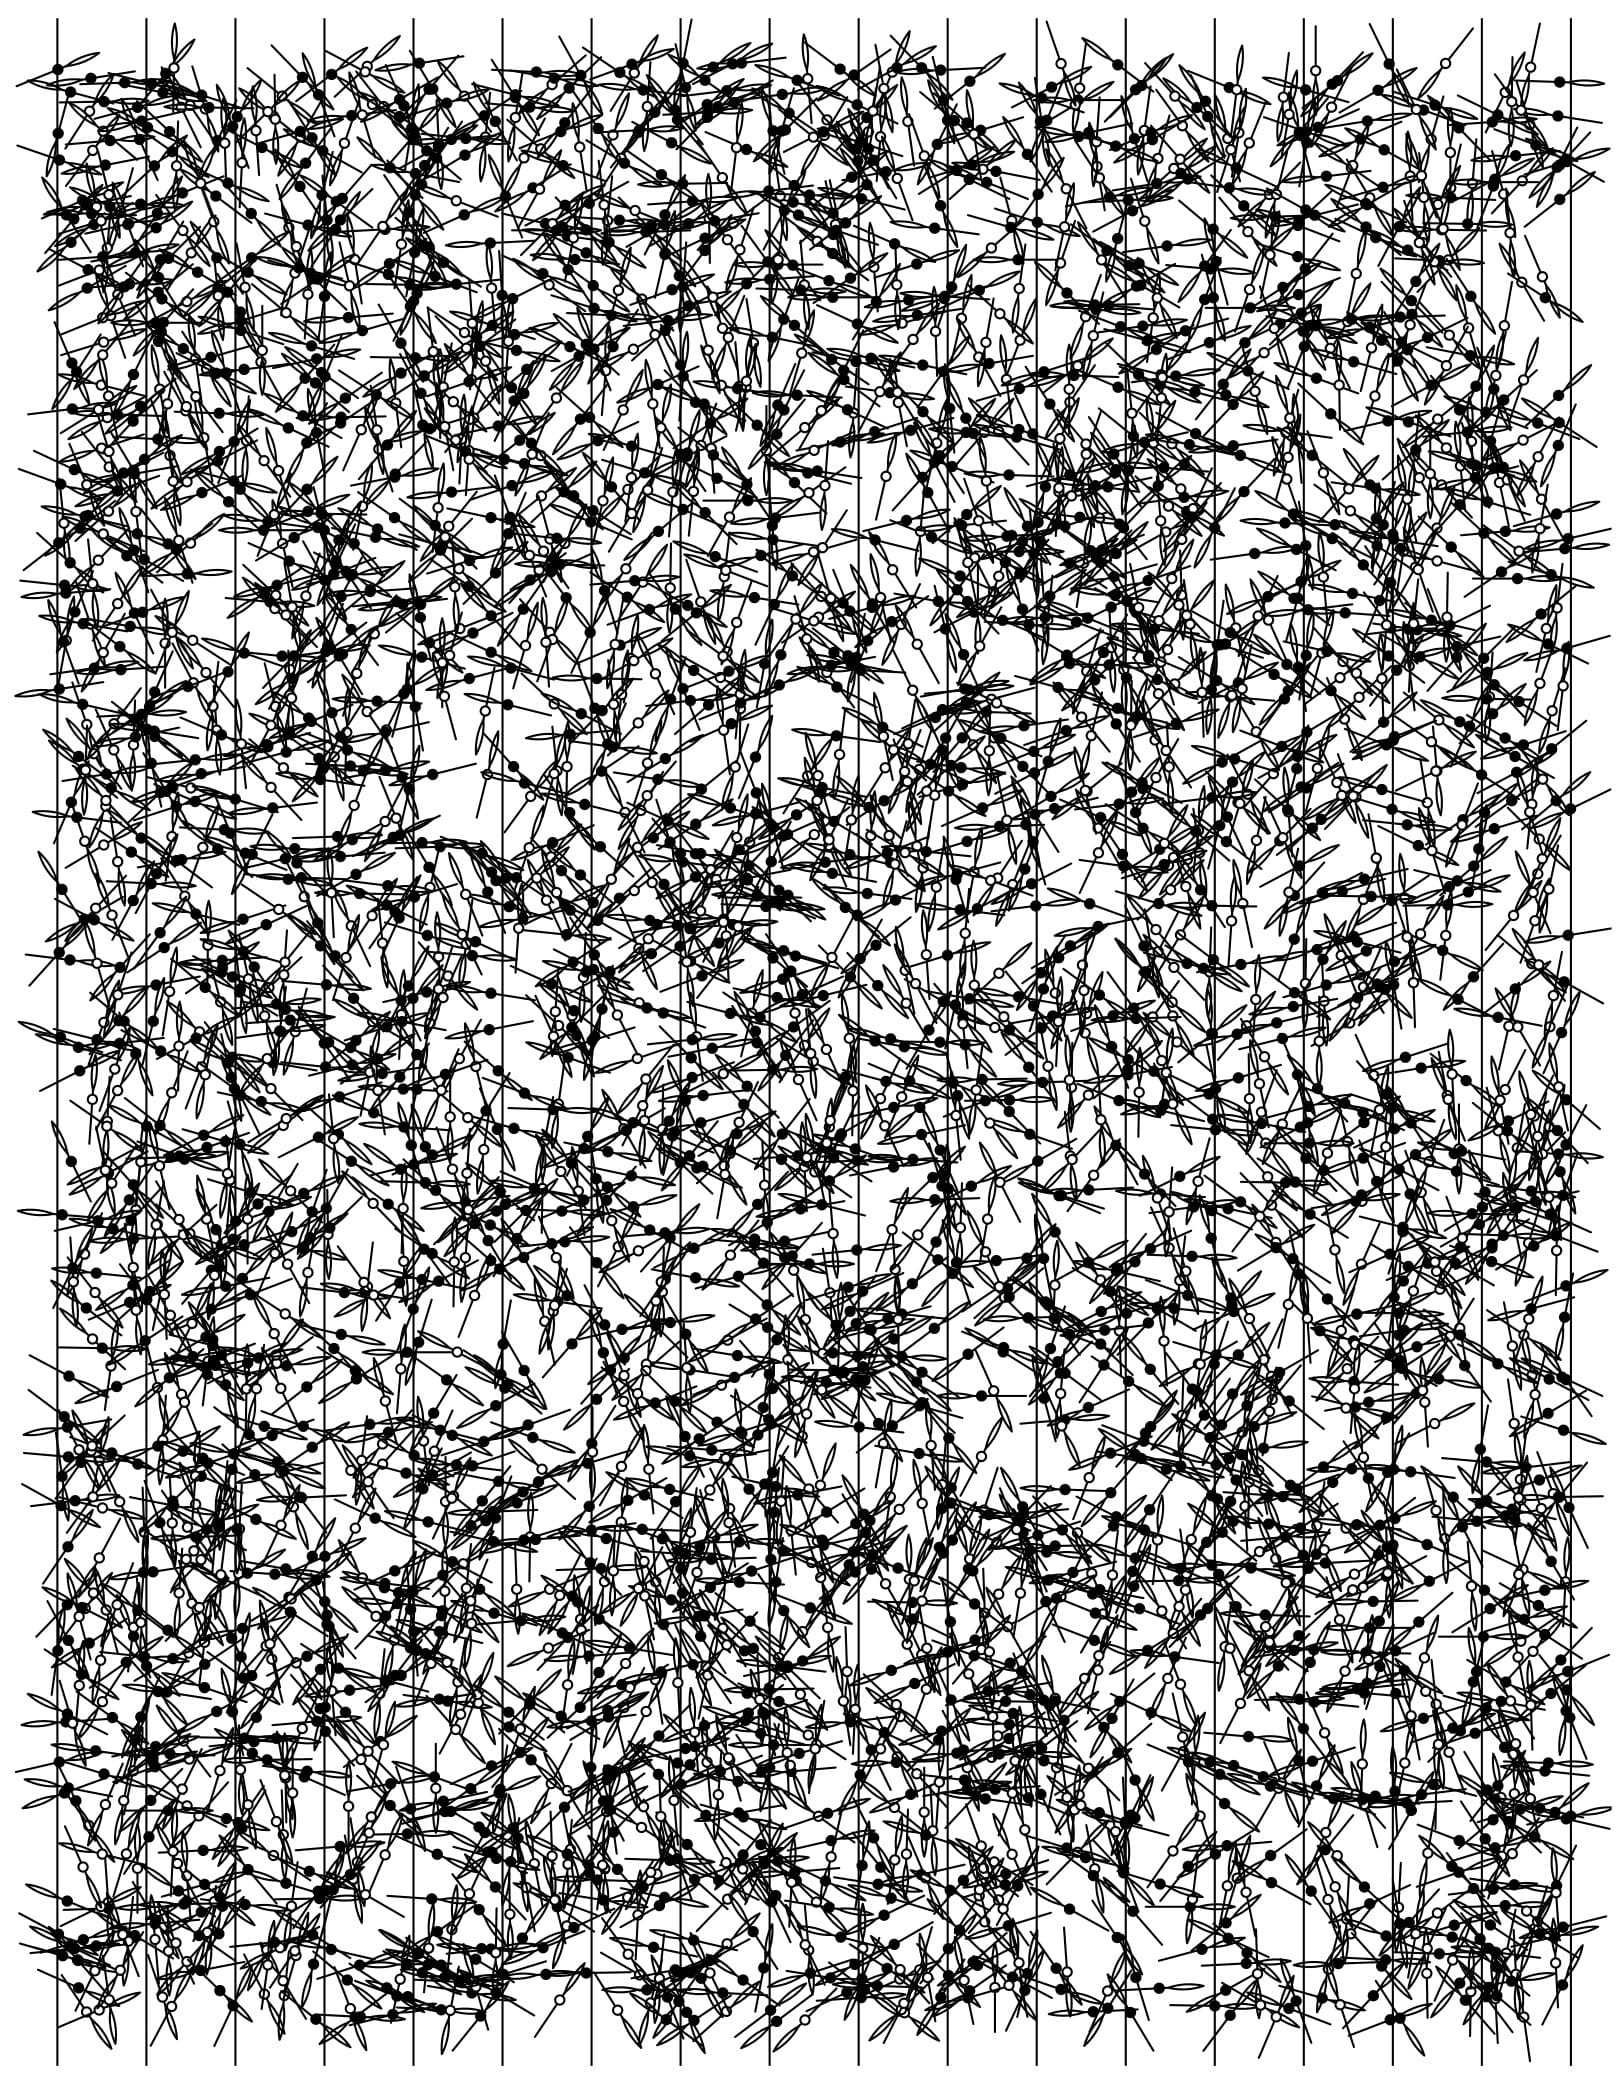
I wondered how well GPT would do at this task. It’s pretty complicated, but then Buffon’s well represented on the internet. Let’s give it a shot. Here’s my prompt:
BC: From a book on molecular dynamics, “We want to follow in Count Buffon’s footsteps and and perform our own needle-throwing experiments. One of these, with 2000 samples, is shown in Fig. 1.10.” Write a Python program to generate those 2000 samples. Then take the 2000 samples and write code to plot them. Each needle should be displayed as a line connected to a needle eye with a small ball in the middle. There should be 17 “cracks” in the experiment and the ball should be solid if a needle overlaps a crack. The field overall is sized 20 high x 16 wide and has 17 vertical cracks. Each needle is unit length.
At which point, GPT gave me three blocks of code (see below), and when I ran it, this was the result.
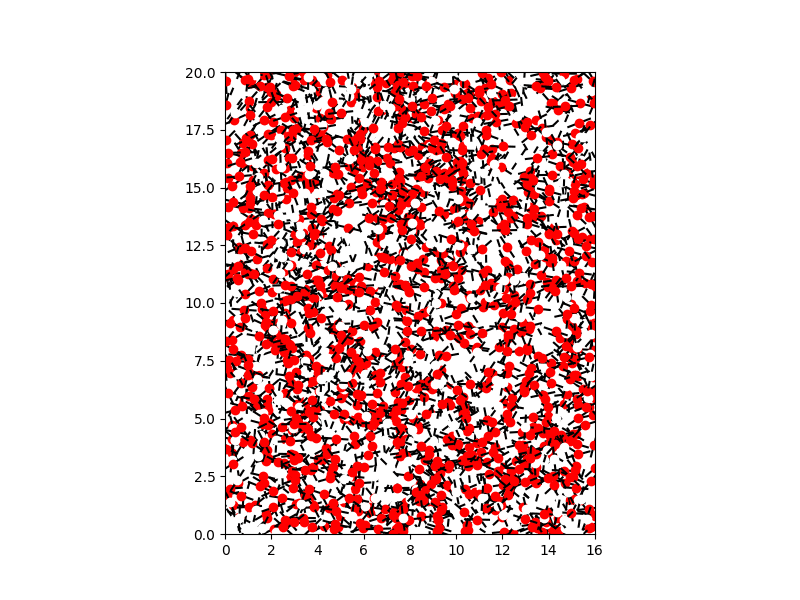
This is actually better than I expected. You can see it got the distinction right of white circles versus red circles, but not quite the right visualization. So I asked it to try again with this prompt:
BC: That’s great, but there are several improvements I’d like to see.
1. Black and white rendering only.
2. Thinner lines and smaller circles and disks.
3. Plot the vertical cracks with thin lines.
4. Put a needle like shape (like an American football) on one end of each needle to give it an orientation.I just need the final Plotting the Needles code for this.
Et voila.
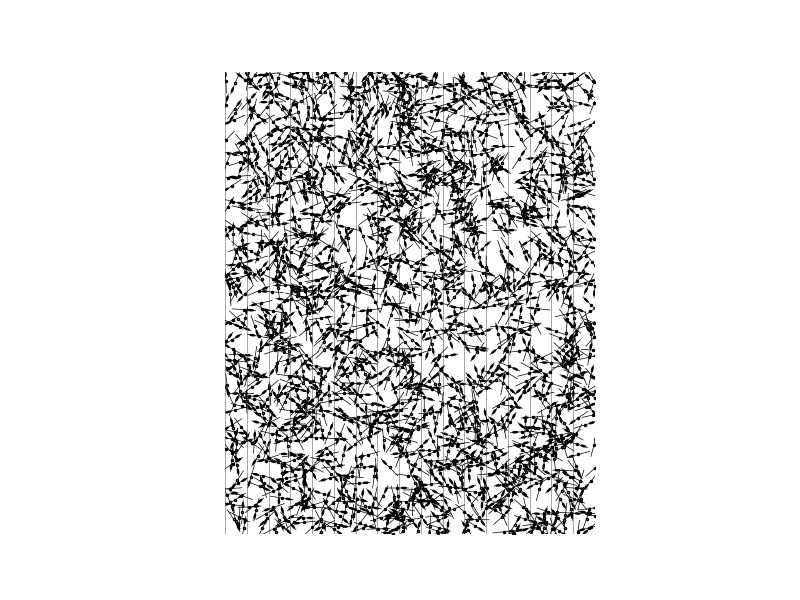
Well, almost. It forgot to distinguish the ones that overlapped with circles rather than black disks.
This took a total of 2 minutes (plus 10 minutes to get into the blog, because it’s totally manual).
Here’s the code snippets it produced.
import numpy as np

def generate_needles(num_samples, field_width, field_height):
    # Generate random midpoints
    x = np.random.uniform(0, field_width, num_samples)
    y = np.random.uniform(0, field_height, num_samples)
    # Generate random angles from 0 to 2*pi
    theta = np.random.uniform(0, 2*np.pi, num_samples)

    return x, y, theta

# Constants
num_samples = 2000
field_width = 16
field_height = 20

x, y, theta = generate_needles(num_samples, field_width, field_height)

def check_overlaps(x, y, theta, field_width, num_cracks):
    crack_positions = np.linspace(0, field_width, num_cracks + 1)
    overlaps = np.zeros(len(x), dtype=bool)

    for i in range(len(x)):
        # Calculate endpoints
        x1 = x[i] + 0.5 * np.cos(theta[i])
        y1 = y[i] + 0.5 * np.sin(theta[i])
        x2 = x[i] - 0.5 * np.cos(theta[i])
        y2 = y[i] - 0.5 * np.sin(theta[i])

        # Check for overlap
        min_x = min(x1, x2)
        max_x = max(x1, x2)
        overlaps[i] = np.any((crack_positions > min_x) & (crack_positions < max_x))

    return overlaps

overlaps = check_overlaps(x, y, theta, field_width, 17)

import matplotlib.pyplot as plt

def plot_needles(x, y, theta, overlaps):
    fig, ax = plt.subplots(figsize=(8, 6))
    for i in range(len(x)):
        # Endpoints
        x1 = x[i] + 0.5 * np.cos(theta[i])
        y1 = y[i] + 0.5 * np.sin(theta[i])
        x2 = x[i] - 0.5 * np.cos(theta[i])
        y2 = y[i] - 0.5 * np.sin(theta[i])

        # Plot needle
        ax.plot([x1, x2], [y1, y2], 'k-')
        # Plot needle eye
        ax.plot(x[i], y[i], 'ro' if overlaps[i] else 'wo')

    ax.set_xlim(0, field_width)
    ax.set_ylim(0, field_height)
    ax.set_aspect('equal')
    plt.show()

plot_needles(x, y, theta, overlaps)
This is very neat and well organized code! Here's the followup code.
import matplotlib.pyplot as plt
import matplotlib.patches as patches

def plot_needles(x, y, theta, overlaps):
    fig, ax = plt.subplots(figsize=(8, 6))

    # Plot vertical cracks
    field_width = 16
    num_cracks = 17
    crack_positions = np.linspace(0, field_width, num_cracks + 1)
    for cp in crack_positions:
        ax.axvline(x=cp, color='gray', linestyle='-', linewidth=0.5)

    # Settings for needles and circles
    line_width = 0.5
    circle_radius = 0.05  # radius for midpoint marker
    needle_length = 1
    football_length = 0.2  # length of the "football" shape

    for i in range(len(x)):
        # Calculate endpoints
        x1 = x[i] + 0.5 * np.cos(theta[i])
        y1 = y[i] + 0.5 * np.sin(theta[i])
        x2 = x[i] - 0.5 * np.cos(theta[i])
        y2 = y[i] - 0.5 * np.sin(theta[i])

        # Draw needle
        ax.plot([x1, x2], [y1, y2], 'k-', lw=line_width)

        # Draw "American football" shape
        football_x = x[i] + 0.5 * np.cos(theta[i]) - football_length * np.cos(theta[i])
        football_y = y[i] + 0.5 * np.sin(theta[i]) - football_length * np.sin(theta[i])
        ellipse = patches.Ellipse((football_x, football_y), football_length, circle_radius,
                                  angle=np.degrees(theta[i]), color='black')
        ax.add_patch(ellipse)

        # Draw needle eye
        color = 'black' if overlaps[i] else 'white'
        ax.plot(x[i], y[i], marker='o', markersize=circle_radius*30, markeredgecolor='black', markerfacecolor=color)

    ax.set_xlim(0, field_width)
    ax.set_ylim(0, field_height)
    ax.set_aspect('equal')
    ax.axis('off')  # Turn off the axis
    plt.show()

plot_needles(x, y, theta, overlaps)
What's really amazing here is that it recognizes "American football shape" and can convert that into Matplotlib code.
Getting better at humor
GPT's getting funnier. This is from Mitzi.
MM: please give me a joke with the punchline "all your base are belong to us"
GPT4: Why did the computer take over the entire internet?
Because it finally decoded the message: "All your base are belong to us."
Thank you sir, may I have another?
MM: that's pretty good. please give me another one.
ChatGPT: Why did the grammar teacher fail the evil overlord's essay?
Because it ended with "All your base are belong to us."
A good comic has a lot of material.
MM: another one?
GPT: Why did the spaceship's navigation system malfunction?
Because the aliens reprogrammed it to say, "All your base are belong to us."
And because it's that time of year.
MM: please make a baseball joke about this
GPT: Why did the opposing baseball team start panicking in the middle of the game?
Because the scoreboard flashed a message: "All your base are belong to us."
Mitzi says "home team" would have been funnier.
The Postscript postscript
Werner shared his postscript code for generating his plot. It runs as part of the postscript rendering. The relevant part is at the bottom starting at "4000".
%!PS-Adobe-2.0 EPSF-2.0
%%Title: IN_buffon_exp_new.eps
%%BoundingBox: 45 131 430 625
%%  Postscript figure from
%   Statistical Mechanics: Algorithms and Computations
%                   Werner Krauth
%            Oxford University Press (2006)
%
/cm { 0.0351 div} def
/thicklinewidth 1.5 def
/normallinewidth 1.0 def    % 0.35377 mm or 1/72 inch
/thinlinewidth 0.5 def
/white 1.0 def     %    0 % gray = white
/black .0 def      %   100% gray= black
/tinyradius 0.03 cm  def  %
                           %
/dot {  % usage: x y radius dot (draws a dot (filled circle) of given radius in current grayvalue)
gsave
   0 360 arc
   gsave
      fill
   grestore
   gsave
      black setgray
      stroke
   grestore
grestore
} def
/circle {  % usage: x y radius circle (draws an unfilled circle of given radius)
           % the linewidth is not specified
gsave
   0 360 arc
   black setgray
   stroke
grestore
} def
/nran {    % usage: N nran (picks random number between 1 and N)
rand exch mod 1 add } def
/ran01 {    % usage ran01  (picks random number between 0 and 1)
/xnorm 10000 def
rand xnorm mod cvr xnorm div } def
%%%%%
%%%%% end common area of all Smac postscript figures.
%%%%%
/sc {0.75 mul} def
100 srand
/needle { % usage: angle x y needle, draws a needle, which for angle = 0 extends from
   % -0.5 sc cm to + 0.5 sc cm
   % allows different gray values. Version 04-JUN-03
   gsave
      translate
      rotate
      /l 0.7 sc cm def % factor setting lateral size of hole
      /x .2 sc cm def % 2 x: length of hole
      /y .6 sc cm def % length of shaft
      /radius l dup mul x dup mul add sqrt def
      /alpha x l atan def
%
% make the shaft
%
      thinlinewidth setlinewidth
      1 setlinejoin
      1 setlinecap
      gsave
         y 2 div x -1 mul add 0 translate
         y -1 mul 0 cm moveto
         0 sc cm 0 cm lineto
         gsave
            black setgray
            stroke
         grestore
%
% make the hole
%
         newpath
         x l -1 mul radius 90 alpha add 90 alpha sub arcn
         x l radius 270 alpha add 270 alpha sub arcn
% fill
         gsave
            black setgray
            stroke
         grestore
      grestore
      0 0 tinyradius 1.3 mul dot
   grestore
} def
2 cm 5 cm translate
/ymax 22 sc cm def
/xmax 18. cm def
/delx 1. sc cm def
/ncracks 18 def

thinlinewidth setlinewidth
gsave
200  thinlinewidth setlinewidth
   ncracks {0 sc cm -.5 sc cm moveto 0 sc cm ymax .5 sc cm add lineto stroke delx 0 translate} repeat
   stroke
grestore
white setgray
thinlinewidth setlinewidth
4000 {
   /angle {360 nran} def
   /xcenter {delx .5 mul ran01 mul} def
   /ycenter {ymax ran01 mul} def
   /xc xcenter def
   /an angle def
   xc an cos .5 sc cm mul abs sub 0 lt {black setgray}{white setgray} ifelse
   2 nran 1 gt {/xc delx xc sub def } if
   /xc xc ncracks 1 sub nran 1 sub delx mul add def
   an xc ycenter needle
} repeat
showpage