Richard Calvo, Vincent Pons, and Jesse Shapiro write:
Many observers have forecast large partisan shifts in the US electorate based on demographic trends. Such forecasts are appealing because demographic trends are often predictable even over long horizons. We backtest demographic forecasts using data on US elections since 1952. We envision a forecaster who fits a model using data from a given election and uses that model, in tandem with a projection of demographic trends, to predict future elections. Even a forecaster with perfect knowledge of future demographic trends would have performed poorly over this period—worse even than one who simply guesses that each election will have a 50-50 partisan split. Enriching the set of demographics available does not change this conclusion. We discuss both mechanical and economic reasons for this finding, and show suggestive evidence that parties adjust their platforms in accordance with changes in the electorate.
This paper seems reasonable to me. It marshals a lot of evidence, and the general message makes sense: demographic changes are consequential—they lead to policy shifts—but they don’t map directly into vote outcomes, because voting patterns within demographic categories themselves change over time. In some way this point should seem obvious, but as with many things in politics, erroneous ideas float around (see here, for example) and so it’s good to see researchers put in the careful work to explain what’s going on.
I just have two comments:
1. They write:
Forecasting elections is a popular sport of scholars and pundits alike. In addition to its entertainment value, forecasting is valuable because election outcomes matter for public policies, and so predicted election outcomes can influence markets, and political uncertainty can depress them.
This is all fine but I think it misses two key reasons for forecasts. First, following Rosenstone’s classic book from 1983, and later work by Bob Erikson and others, it has been understood within political science that much of the variation in national elections can be predicted given economic conditions in presidential years and party balancing in non-presidential years. As those authors and others have discussed, the existence of reasonably accurate forecasts using information available before the campaign has important implications for our understanding of politics. It’s not just about “entertainment value” or somebody making money in the stock market.
2. They write:
Others have noted that US politics tends to remain competitive despite changes in the electorate, with the Economist calling this “The great mystery of American politics.” We provide what is to our knowledge the first systematic evidence of this pattern, and the first analysis to observe that it is exactly what is predicted by some of the most classic ideas in rational choice theory.
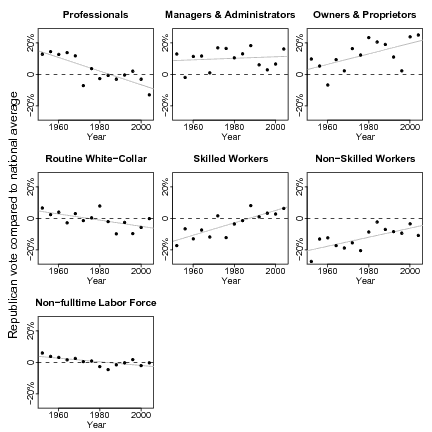
Different groups move in a way that seem to cancel out, leading to a stable average, as we noted here and in Red State Blue State.
But that’s just recent history. Before that, it gets complicated! For a 60-year stretch of American politics—from roughly 1896 to 1956—there was not a balanced two-party system at teh presidential level. Republicans won decisively for a few decades (with the exception of Woodrow Wilson getting in during an unusual three-party race), then Roosevelt won all his elections handily, Truman won in an election that was close by historical standards but in modern times would be considered decisive, then Eisenhower won two elections easily. Even after the knife-edge 1960 election, the U.S. was sometimes described as having a “one-and-a-half party system,” in that the Republicans dominated some states and could compete in some national elections but were clearly a minority party in aggregate.
So, yeah, two party system, and, yeah, median voter theorem, but we’ve only had anything like symmetry between the parties since the 1980s—unless you want to go back all the way to the 1880s.
This came up in my 2014 article, The Twentieth-Century Reversal: How Did the Republican States Switch to the Democrats and Vice Versa?:
Another puzzling aspect of the Great American Reversal is the reappearance of nearly tied elections. Here is a list of all the U.S. presidential elections that were decided by less than 1% of the popular vote: 1880, 1884, 1888, 1960, 1968, 2000. The other closest elections were 1844 (decided by 1.5% of the vote), 1876 (3%), 1916 (3%), 1976 (2%), and 2004 (2.5%). Four straight close elections in the 1870s–1880s, five close elections since 1960, and almost none at any other time.
From the standpoint of political theory, we would expect elections to generally be close: each party has an electoral incentive to move toward the center to capture wavering votes. But over long stretches of American history, close presidential elections have not been the norm. One possible explanation is that after the 1880s the Democrats were largely satisfied with control over the south, along with the political machines of New York and other large cities; national politics were less important in that period except as a way of brokering regional disputes. Since the New Deal, however, federal policy and dollars have been important enough for both parties to seriously contest national elections whenever possible. Politics today is centered around national media and polling, whereas a hundred years ago voters were reached locally.
The relevance of this to the Calvo et al. paper is that they write that close national elections are “exactly what is predicted by some of the most classic ideas in rational choice theory,” but then it’s important to be aware of those long periods of American history when national elections were not close!
In the post-2000 era, 50-50 elections seem like such a natural state of affairs, but history shows they are not the only pattern of political stability in a two-party system.
Clicked the first link.
What is the justification for describing your model using equations and prose rather than just sharing the code?
Makes it seem like they derive their statistical model by hand, *then* implemented it as code, kind of like an extra step.
I don’t understand this comment. Describing the assumptions and equations of your model precisely, as well as where you got them from, is a necessary step in communicating the model.
On the other hand, there is no need for economists to act like mathematicians (“the probability distribution is a continuous function” etc). There is no need for that level of mathematical rigor when it has no use in reality.
Yea, there is no problem with doing both. But the precise description *is the code*, which should have comments anyway.
It amounts to sharing the comments without the code.
I was thinking perhaps it is a relic from like the 1950s when people did work everything out by hand, then, if necessary, passed it on to an external mainframe team who did all the computer stuff.
See Dale’s comment. Code comments are not enough.
I don’t understand it either. They should share their code. But if they had just shared their code with no equations and prose to describe their model, how would that be useful? Readers would be left with 2 choices: simply accept their results or try to reverse engineer their code to figure out what their model actually does and how they prepared the data. Sounds like lack of communication to me (though I do believe they should provide their code – and their data).
I would really like to see this code now, since these comments that imply it would be hard to understand.
Is there some kind of prototypical example of economist code out there I can see?
There’s that famous Excel spreadsheet with the decisive errors
https://theconversation.com/the-reinhart-rogoff-error-or-how-not-to-excel-at-economics-13646
You can find lots of code examples with most of the published work in the American Economic Review (and many other pubs from the AEA). I don’t read this stuff any more, so I can’t provide a link for you, but it is standard practice for the replication code to be provided – but not so standard for the data to be provided.
I also do not understand why an academic would write a paper. It’s almost as if the entire incentive structure of the profession was set up to encourage it!
People were rational in the 1880s. Then they stopped being rational for a hundred years. Now they are being rational again. ;)
“One and a half party system” is how I recall other countries with “natural governing parties” (Canada, Mexico, Japan) were described by my comparative government text in highschool.
The “one and a half party system” was described by the analyst Samuel Lubell in 1951 in terms of a “sun party” (majority party) and a “moon party”:
“…it is within the majority party that the issues of any particular period are fought out; while the minority party shines in reflected radiance of the heat thus generated.”
The Democrats were the sun party until Reagan appeared. Symmetry between the parties is then described as having “two moons and no sun.”
Perhaps not a useful way of thinking, but better than the median voter theorem in at least capturing the fact that one party had a long-lived majority.
Prompted by this:
https://www.latimes.com/opinion/story/2024-10-22/donald-trump-kamala-harris-republican-democratic-election-2024-jonah-goldberg