Luis Zambrano writes:
Here’s a little “fake stats in the wild” gem that I think you and your followers will find at the least somewhat amusing.
Amid strong allegations of fraud in the recent Venezuelan elections, a curious “statistical” fact, that by itself seems to be a strong indicator of blatant fraud, has been thrown around lately on Twitter.
On Sunday night, more than 6 hours after ballots were supposed to close, the President of the National Electoral Commission announced the winner of the election: “With 80% of the votes counted, and a strong and irreversible trend, here are the official results of today’s vote…”
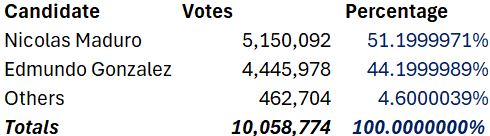
So… What about it? For curiosity’s sake, let’s expand the decimals to the 7th decimal:
That seems fishy… Can it be, that instead of calculating the percentages from the number of votes, someone decided the percentages and then calculated the number of votes?
Let’s do the exercise. Let’s start with the total number of votes and assign 51.2% of the votes to Maduro, 44.2% to his main opponent, and 4.6% to the rest of the field, to see where that gets us:
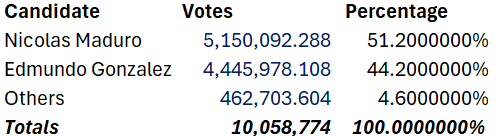
“Ups, it would be weird if we publish decimals of votes, let’s just round it to the nearest integer”:
If it is not evidence of fraud by itself I do not know what is. Anyhow, the image of the Chavista bosses fabricating the results with a napkin and their phone calculators seems to be as plausible as amusing.


My first reaction is, no, I don’t find this amusing. A political party trying to overturn the will of the voters by using physical force and denying the election outcome—that bothers me when it happened in the United States on 6 Jan 2021 (see here for some review of evidence) and it bothers me when it’s happening in a much more extreme way in Venezuela right now. I agree that the statistical error is kind of funny, but it’s hard for me to amused, giving the upsetting context.
Zambrano continues:
So I have a couple of questions related to this ongoing story:
1. How can we go about solving the problem “What are the probabilities that something like this happened by chance?” At first, I thought it was going to be trivial. But the more I think about it the less straightforward it seems.
2. Not regarding the seemingly fabricated results per se, but imagining a world in which the published results are accurate, it still seems kind of unusual that the Electoral Council picked a winner in a kind of close election (4.6% difference according to them) with still 20% of the vote to count. Obviously, with proper modeling, it can probably be determined with high certainty. And we could expect Networks racing to make a call first to make such determinations. But it seems odd from an impartial and official body that should not be making any modeling assumptions. It would be interesting to know your thoughts about it from the point of view of a statistician.
1. I agree—this is not a completely trivial question! One way to think about it is to compare this Venezuelan result, where the three different vote totals are consistent with taking a single number for total votes and multiplying by three different exact multiples of 1/1000, and the recent Iranian election, where the five different vote totals all were multiples of 3 (very naively, this would give you a p-value of 1/243 but this doesn’t account for that fact that there are hundreds of other such patterns that would be just as notable).
If you wanted to get a p-value for the Venezuelan outcome, you could do it. . . . You have to start with a probability model, but that’s kind of easy because you should get essentially the same result with any model, as this is some very local behavior that you’re checking. So, here goes:
a. Start with 10,058,774 votes. You could add randomness here too, but, again, I don’t think it will matter. You can check later if you want.
b. Randomly divide them into 3 piles. The 51.2% for Maduro looks a bit sus, kinda like they wanted to put him over the 50% hump by roughly the minimal amount that it wouldn’t trigger a recount, also they didn’t want it to be an exact percentage. But, hey, let’s just assign a vote proportion to candidate A that’s randomly distributed between 0.3 and 0.7, then assign a vote proportion to Others that’s randomly distributed between 0.01 and 0.10. Again, there’s no way the details can matter. Take those vote proportions, multiply them by 10,058,774, and round to the nearest integer. Then take 10,058,774 – votes for A – votes for Others, and that will be votes for B.
c. Simulate step b lots of times. For each simulation, take the proportion of votes for each of the three options, round to the nearest 0.1%, multiply by 10,058,774, and round to the nearest integer. If these are the same as the actual vote totals, it’s a win.
Here’s the R code (after a very small amount of debugging):
N <- 10058774
S <- 1e6
A <- round(N*runif(S, 0.30, 0.70))
C <- round(N*runif(S, 0.01, 0.10))
B <- N - A - C
A_round <- round(round(A/N, 3)*N)
B_round <- round(round(B/N, 3)*N)
C_round <- round(round(C/N, 3)*N)
sum(A_round==A & B_round==B & C_round==C)
Aaaand the result is . . . 0. That's right: a million simulations, and not once does this rounding thing work out.
We can also check with a bit of math. There are 1001 possible vote counts you can get by rounding vote percentages that are multiples of 0.001, and there are 10,058,775 possible vote counts you can get, so the probability of getting it right on the nose is approximately 1000/10,058,774, which is about 1 in 10,000. So the probability of candidates A and B both landing there is approx (1/10,000)^2, or 1 in a 100 million. And then candidate C should work out automatically.
And, indeed, in the above simulation there are about 100 cases where candidate A's vote share lines up as closely as possible to an exact multiple of 0.001 and about 100 cases where B's vote share doesn't line up; they just don't happen to occur at the same time.
I'm not the world's biggest fan of p-values, but my correspondent did ask, so here's my answer: There's roughly a 1 in 100 million that this particular pattern would happen by chance.
And to put my Bayesian hat on for a moment: Yes, there does seem like a plausible way for these numbers to have come up if there were cheating, just as Zambrano speculated above.
2. I agree. Don't call the winner until all or almost all the votes have been counted.
P.S. I haven't checked any of these numbers myself. I'm assuming the screenshots that Zambrano sent are the real thing. If he's scamming me here I'm gonna be really angry!
P.P.S. Commenter Ryan points out that you could also explain this data pattern as a result of sloppy post-processing, if votes were counted correctly, then reported to the nearest percentage point, and then some intermediary mistakenly multiplied the (rounded) percentages by the total vote and reported that. I have no idea; you'd want to know where those particular numbers were coming from.
This reminds me of some of the stats we used to catch fake pollsters a few years ago. I’m also not a fan of p-values but when they can be a good way to quantify weirdness. When the get so extreme that no reasonable estimate of how many comparisons were implicitly possible brings you up anywhere near one, there’s a strong case.
But what’s weird is that professional pollsters (or professional fake pollsters) or powerful national governments are too dumb to randomly jostle the results a bit. As i noted about the fake pollsters, all they needed was to invest $0.01 (recoverable) in a random number generator, or maybe to save time $0.02 for the deluxe parallel-processing unit.
Yeah, they should’ve hired that Michael Lacour guy.
Michael:
I was thinking more about your comment, and I guess another factor here is that the kind of people involved in faking elections aren’t the kind of people who will be so good at math. Even in the U.S., consider that terrible paper by Mary Rosh that attempted to muddy the political waters by promoting discredited theories of election fraud. The top people aren’t doing this sort of thing. At least, they’re not working for Maduro or Trump.
Back in WW2, top mathematicians such as Turing were working on statistics for the war effort, and I imagine they’d’ve been willing to fake election results and otherwise supply disinformation to help destabilize enemies, had the government asked them to do it, but it didn’t really come up, because the Axis powers weren’t running democratic elections. And I could imagine that various countries around the world consider the U.S. as the enemy, and maybe they could convince or coerce some of their top mathematicians to promote election fraud. Home-grown fraud, though, that’s tougher to motivate, and so it ends up being the incompetents who do it, and who make dumb mistakes.
To continue this line of reasoning: Why do the fakers keep making dumb mistakes? These people are not so stupid, right? But consider their trajectories: they’ve advanced in their careers by being hacks, by being willing to say whatever their bosses or sponsors want to say—and often these bosses and sponsors want them to come to ridiculous conclusions. They’ve done well by saying stupid things, their motivation for getting it right has not been high, sloppiness has worked for them just fine in the past, so they keep going with it.
I suppose you could ask chatgpt now
On second thought, I’m nervous that also there can be ascertainment selection bias.
I think to some degree people who are part of a social system in which advancement depends on defending one’s boss’s conclusions, no matter what, know that absurd conclusions are actually a plus. Absurd conclusions allow one to identify and eliminate truthseekers among near underlings more easily, and to assert dominance over far underlings more completely.
I always thought the real, secret story was that the emperor with the new clothes knew exactly what he was doing.
Wendell Wilkie got the Republican nomination as result of British intelligence faking a poll of Republicans being in favor of intervention.
Andrew. The link below is to a tweet with a Video of the National Election Authority (CNE) President (Rector) that “allegedly” failed to gather the electoral witnesses in the situation room where the tallies are summarized, did not print the bulletin that the electoral system produces, left the situation room, went to his private office, closed the door, pulled his cellphone out, opened the calculator app, and ran three calculations, wrote the results down on a piece of paper, walked out, sat in the press conference room without either of his fellow Directors, and read the calculated numbers to the press as a first and definitive result bulletin.
Now, the video in the tweet is from a few years ago. At the time he was a Representative at the Assembly (congress), (yes PSUV always gets to appoint former party representatives as election officials) and coincidentally he’s shouting during a legislative discussion at the current opposition candidate that he’s perpetrating to steal the election from, and whom at the time was also an opposition Assembly representative. Speaking Spanish is nor required to understand it. Enjoy.
https://x.com/emafigueroac/status/1819093249170301077?s=61&t=Zp4GcRiHCReKd7zSkNLRVg
I believe this is clear evidence in favor of the initial hypothesis.
Check out the video on this tweet. It’s THE guy who ran the scam.
https://x.com/EmaFigueroaC/status/1819093249170301077
Election fraud isn’t a giant wide conspiracy. They have to keep the mechanics of it close to the chest or risk a leak. In other words, not enough brains looking at the strategy or the fine details of the numbers in the plan.
I must be slow today (as I am other days as well): I don’t understand this. Let’s assume the vote totals are correct. Then the reported percentages are also correct, rounded off to one decimal place. I guess I don’t know what is meant by “expanding the decimals.” If I expand them using the reported vote totals, I don’t get the numbers shows as expanded. If the expanded decimals are, in fact, from official reports, then I’m plenty suspicious. But how did those expanded decimals get expanded? I often see vote totals and rounded percentages, but I never see expanded percentages like what is shown.
What am I missing here?
Maduro supposedly got 5,150,092. That just happens to be 51.200000% of the vote. It looks like what happened is that the CNE decided on the % outcome (give Maduro 51.2%) and a vote number (10,058,774) and just multiplied the vote number by 0.512. If they had then added or subtracted 20 votes, it would have looked more legit. But the person who did this was either lazy, stupid, or intentionally leaving this breadcrumb for future investigators. So they left this uncannilly round number — not just for Maduro but also for Gonzalez.
Steven:
There are 3 numbers here, so having an exact rounded value for Maduro would not automatically give an exact rounded number for Gonzalez. I assume that whatever process generated Maduro’s number generated Gonzalez’s also.
Dale,
Look at the vote proportion obtained by Maduro:
This is what you would get if you started with the total number of votes, multiplied that total by 0.512, and rounded to the nearest integer. Most vote proportions don’t look like that. Only about 1 in 10,000 vote totals have this property. And it didn’t just happen for Maduro’s total, it happenwd with Gonzalez’s too.
I don’t know whassup with the 7th decimal place thing, because R doesn’t spit out all those decimals . . . but here’s a quick calculation. If you type 0.512*10058774 into R, you simply get 5150092, which isn’t quite right. But we know that 0.512*10,000,000 = 5,120,000, and then we can add 0.512*50000, which is 256000, then we add 0.512*8774, which is finally small enough for my R display: it’s 4492.288. . . . Ummm, ok, we could’ve gotten this directly by just setting options(digits=10) in R. 0.512*10058774 = 5150092.288. The point is, it rounds to 5150092, and there’s only approx 1/10000 probability this will happen here.
Using that excellent calculator called Excel (!), 5150092/10058774 gives me 0.512, but when expanded to 8 decimal places, it gives me 0.5119997. I believe vote tallies are reported and percentages calculated afterwards and usually rounded. So, I am still not understanding the suspicions here (though I don’t doubt that the election was fraudulent).
Dale:
If Maduro really got 5150092 votes out of a total of 10058774, then the vote proportion really is 0.512 to several decimal places. The point is that, under any reasonable chance model, there is only a 1 in 10,000 chance that the vote total will have the property that it’s what you get by taking the total number of votes, multiplying it by a percentage defined to the exact tenth, and rounding to the nearest integer.
That is, the data are entirely consistent with the model by which the candidates’ vote numbers were obtained by taking a vote total and multiplying by three percentages that were specified to one-tenth of a percentage points, but very unlikely under the model by which the votes were simply tallied for real.
A hypothesis test gives us extremely strong doubt that these are actual vote totals; a Bayesian analysis suggests that the multiplying-by-exact-tenths-of-percentages model is much more likely. As Ryan points out in comments below, there are various places within the tallying process when that could’ve happened.
Andrew
I must be unusually thick today, but I’m not understanding this at all. Let’s assume the vote count is correct (and the likely fraud is that it is not). Then we calculate the % for each of those candidate choices – either with one significant decimal or whatever number you want, but then rounded off to one decimal. Isn’t the original table in the post what you get? Why is it suspicious?
Dale:
Just run my R code and you’ll see. Simulate a million elections and you’ll see zero cases where both candidates receive votes that are the exact rounded value of what you get when you multiply the total number of votes by a percentage that is exact to the nearest tenth of a percentage point.
> percentages calculated afterwards and usually rounded […] still not understanding the suspicions here
Rounded to 1 decimal place the percentages are unremarkable: 51.2 / 44.2 / 4.6
Rounded to 2 decimal places they are slightly curious: 51.20 / 44.20 / 4.60
Rounded to 3 decimal places a rare coincidence happens: 51.200 / 44.200 / 4.600
At some point seeing additional zeros goes from being surprising to being expected.
Rounded to 4 decimal places: 51.2000 / 44.2000 / 4.6000
Rounded to 5 decimal places: 51.20000 / 44.20000 / 4.60000
That’s the closest you can get to exactly 51.2, 44.2 and 4.6 without having fractional votes. _That_ would be suspicious!
Here’s another way to look at it.
There are about 10,000 numbers which, when divided by 10,058,774 and rounded to 3 digits, give. 0.512. Of those, 5,155,992 is the number which is associated with the smallest rounding error.
Consider
delta from 0.512 (x10^6)
5,155,091/10,058,774 = 0.511999872 -1.28
5,155,092/10,058,774 = 0.511999971 -0.29
5,155,093/10,058,774 = 0.512000071 0.708
What are chances that, of the 10,000 vote counts for Maduro, the ratio of which to the total votes, rounds to 51.2%, is the one that has the ratio closest to 51.2% turns out to be the total votes cast for Maduro?
I don’t know but it seems to me that 10,000:1 is a reasonable measure of the odds.
We do know that if the vote count was calculated starting with 51.2% and the vote total, one would calculate that vote count for Maduro.
What are the chances that such unusual vote counts would occur twice in the same election?
# Dale
What am I missing here?
The automatic belief by people in the USA that the results must be fraudulent?
Jkrideau:
I’m not currently in the USA but I am a U.S. citizen, and I never said that the results must be fraudulent. I have no idea. What I did say is that there’s essentially no chance that the numbers given above came from a simple counting of the vote. Some processing must have been done to get to those numbers. As discussed in the P.P.S. to the above post, there are alternative explanations of how incorrect vote counts could be posted: these explanations correspond to sloppy data handling rather than to fraud. There appears to be a lot of other evidence suggesting fraud; my post does not address those claims at all.
Presumably, the “expanded” decimals aren’t from official reports, but the vote totals *are* from official reports. Somebody just happened to check the proportion corresponding to the reported 51.2% for Maduro to more sig figs using the official vote totals, and got the “expanded” decimals shown. That’s what’s meant, I think, by “expand the decimals.”
The point, then, is that 5,150,092 / 10,058,774 does not just round to 51.2%, it *is* 51.2% (to within 3*10^-8).* Similarly for the other three vote totals. The difficulty of obtaining three such round numbers under any reasonable data generating process for the votes (which Andrew calculates more directly in the second half of the post) suggests that they did not come from the data generating process for votes at all! Rather, someone started with the proportion 51.2% and worked backward to the vote totals using the number of *total* votes.
*: When I perform that division on my calculator, I get the same decimal expansion ending in “71” shown in the second picture, so I’m not sure what you mean that you don’t get the numbers shown as expanded. If you solve it exactly, you get that 5,150,092 / 10,058,774 + 144 / 5,029,387,000 = 512 / 1000, which I think you’ll agree, is an incredibly small gap.
This tripped me out, too, and made me learn something about R in the process. I used R to check these numbers and got the same result you describe.
It turns out that R defaults to printing 7 significant digits. At 7 significant digits, 5150092 / 10058774 equals exactly .512. However, if you set options(digits=9) then R produces Zambrano’s expanded result.
When the National Electoral Commission was defrauding their country, they must have been using a platform that prints *fewer* than 7 significant digits: any more and their “Others” number would no longer display as exactly 4.6%.
It makes one wonder whether the person responsible for producing these numbers was either trying to intentionally produce breadcrumbs, or was half-heartedly protesting by doing an extremely half-hearted job…
It would be interesting is the same study was made to the results published by MCM.
To see the odds.
This is some highly motivated reasoning and it smells funny.
I’m a mathematician and the argument here is essentially “it’s extremely unlikely to get this precise result”.
The exact same argument applies to any election.
What are the odds that it goes 51.2% exactly, versus 51.3% or 51.4%?
The odds of any single specific outcome are extremely small, and that truth speaks not at all to the likelihood that these results were genuine. This is a bunch of smoke and mirrors, a technically true fact abused to “justify” a predetermined solution.
Really just shameful for both the journalist and the mathematician.
Bobby:
With 10 million votes, it’s highly unlikely that the outcome would be exactly 51.2% or 51.3% or 51.4%. The calculation we did is estimating the probability that the outcome would be any exact tenth of a percentage point. I don’t think it’s shameful for mathematicians to compute these probabilities or for journalists to report them.
Still seems like people don’t get it. Even mathematicians don’t get it. It’s not that people claimed he got approximately 51.2% as rounded off to 3 digits and this was weird.
It’s that he claims he got exactly the votes needed to have 51.200000% not one vote more, not one vote less
not 51.212941 or 51.228371 or 51.2049772 or anything like that 51.200000%
and not just him, but his opponent also got an amount that had precisely 3 significant figures.
Two people getting vote counts that have precisely 3 significant figures and all zeros after that as percentages is essentially impossible under a “counting actual votes model” but is exactly what you’d expect under a “go find a calculator and take the total and multiply by 0.512” model.
Playing the devil’s advocate (I currently think that fraud occurred here): is it at all possible that some underling at the CNE got charged with pulling the numbers from a sheet and first pulled the percentages and total votes, then multiplied? It’s a common mistake that I have seen people make in other areas.
Ryan:
Indeed, we should not take the rejection of a null hypothesis as a demonstration that a particular alternative hypothesis is true. In this case, you’d want to know exactly where those numbers came from.
Zambrano wrote, “Can it be, that instead of calculating the percentages from the number of votes, someone decided the percentages and then calculated the number of votes?” But that “someone” could’ve been sloppily reporting results, not necessarily fabricating. I have no idea.
Relatedly, here is the pre-registration of a parallel voting tabulation effort that is also taking place in Venezuela: https://osf.io/5tmjg/?view_only=a34faa818f0d4bdfbce2ddc8562f5922
Link to the pre-registered methods report is here: https://storage.googleapis.com/project-pvt-2.appspot.com/public/Alta_Vista_PPA.pdf
I thought you would like to see it.
NYT piece about the study: https://www.nytimes.com/2024/07/31/world/americas/venezuela-maduro-election-results.html?unlocked_article_code=1._U0.3Vju._GTlUW559yVL&smid=nytcore-ios-share&referringSource=articleShare&sgrp=c-cb
Why not just open source whatever process is generating these numbers?
Even if these methods are detecting real fraud, they will be easily defeated if someone a bit more sophisticated does it.
Here’s a thought exercise (because I don’t understand this):
Suppose with 80% of the votes counted, a total of 10,058,774 have been cast, 5,150,092 for Maduro, 4,445,978 for Gonzalez, and 462,704 for others. The percentages, rounded to one decimal place are 51.2%, 44.2%, and 4.6%. If those vote totals and the calculated percentages are reported, it looks exactly like the first table of numbers in the post. As Zambrano writes, “So…What about it?” The “fishy” analysis comes after he expands the percentages to a large enough number of digits. What in the world is fishy about that? Those expanded percentages in the second table do round to the percentages in the first table.
I just don’t see anything fishy at all, if you believe the given vote numbers. If someone gave me those 3 votes and the total and asked me to report the percentages to one decimal place, I would give the first table. If you ask me whether someone “could” have started with some percentages and derived vote totals from that, I’m sure they could have done that. But it would be even easier to just make up vote totals to begin with.
The first table does not look fishy to me, nor does the second table. I really don’t get how Andrew’s simulation changes that. It almost seems like a demonstration that any one particular outcome has a very low probability, like the issue a few days ago on this blog.
The real “fishy” results seem to be more like what Raphael links to above – that the vote counts are not realistic. But I don’t see any statistical oddity in the percentages reported if those vote counts had been accurate.
> But I don’t see any statistical oddity in the percentages reported if those vote counts had been accurate.
Nobody does.
Dale- here it may help to go into Bayesian autopilot. Compare
P(all those zeros|real counts)/P(all those zeros|crude fraud).
The numerator is tiny, the denominator is hard to estimate but not tiny. As Ryan points out
P(all those zeros|sloppy reporting)/P(all those zeros|crude fraud)
requires two subjective estimates even before you get to subjective priors.
So with any plausible priors P(real counts) is negligible. Stupid sloppy reporting vs. stupid sloppy fraud is more disputable.
Dale the fishy part is that if the vote totals are derived by multiplying numbers exactly to 3 digits like 51.2 then the vote totals will land precisely on a quantized lattice. The distance between such quantized locations will be about .001 times 10058774 which is a lattice spacing of 10059 votes. That one of the vote totals lands on such a lattice point isn’t too crazily suspicious, but that all three land on lattice points is crazily suspicious. In real vote totals the lattice points of possible votes are 1 vote apart. So landing on these lattice points which are precisely 10059 votes apart is a 1/10000 chance and two of them at the same time is 1/100,000,000 chance (the third one has to be on a lattice points to make the total so it’s not adding to the suspicion).
I agree that if the “vote totals are derived by multiplying numbers” then things look fishy. But the post didn’t say that – it looks like the vote totals were reported and the percentages derived from that. In that case, I don’t see why it is fishy. It seems as if everybody is looking at this post from a different perspective than I was. Carlos says nobody finds it strange if the vote totals are assumed to be correct. But the post goes into examining the percentages derived from the vote totals. Which is it – do we start with the totals and derive the percentages or start with the percentages and derive the totals? The first seems natural to me while the latter seems backwards (although I did hear something to the effect that it was the percentages that were the official reports).
> It seems as if everybody is looking at this post from a different perspective than I was.
I wonder how would you look at this post if instead of
5,150,092 (51.2[0000]%)
4,445,978 (44.2[0000]%)
462,704 (4.6[0000]%)
the reported results were
5,150,000 (51.2%)
4,450,000 (44.2%)
458,774 (4.6%)
Maybe you don’t see anything strange with that table either. Accepting that with 80% of the votes counted, a total of 10,058,774 have been cast, 5,150,000 for Maduro, 4,450,000 for Gonzalez, and 458,774 for others everything looks fine.
Which hypothesis is more likely?
1) Real people cast real votes, whose vote totals could be any integer (ie on a lattice with spacing 1) and it just happened that they all landed on lattice points spaced 10059 apart?
2) Someone took the vote totals, multiplied them by desired percentage outcomes rounded to 3 digits, rounded the results to the nearest integer, which mathematical MUST result in them being on these lattice points?
That’s the question.
The fishiness is that if 1) occurred it’s about a 1 in 100 million chance, but if 2) occurred then it’s 100% chance of getting lattice points.
Put it this way p(lattice points | fair election ) ~ .00000001
p(lattice points | rigged by mechanism 2) = 1.0 exactly
I’m sorry, but I am not getting any closer to understanding. All of these explanations appear to depend on the use of the exact percentages to one significant decimal. I agree that if these are the exact percentages, then the vote counts are fishy. But, if you go to enough decimals, then they match the vote counts. Saying 52.10000 gives fishy results is meaningless, if you use 51.1999971 as the actual percentage. Either way, I would want the percentage reported as 52.1% (Andrew has fussed about the excessive display of decimals numerous times). So, is the whole issue really about the rounding?
I see people are losing patience with what must seem like my denseness, but I really don’t understand the focus on the rounded percentages.
Dale:
I’ll give it a try. Suppose we had 10,000,000 votes and three options: Maduro, Gonzales, and “others”. Then only 1 in 10,000 vote counts would give Maduro a final vote percentage exactly equal to one decimal point, and the same holds for Gonzales (in which case “others” must also fulfill this, so we have two degrees of freedom). This combination becomes even more unlikely (e.g. by Andrew’s simulations), making it exceedingly rare to see in a normal election.
As the total reported votes here is actually 10,058,774, it is impossible to get some such one-decimal percentages exactly, however it remains (roughly) as unusual to get votes that are the closest possible to an exact such point. This is what we have for the votes here.
Say we had 10,000,001 votes in the example above, and suppose each candidate got 5,120,001 (rounded up from 5,120,000.512), 4,420,000 (rounded down from 4,420,000.442), and 460,000 (rounded down from 460,000.046). This would be equivalent to getting percentages to exactly one decimal point in the 10,000,000 vote example, and this is what we appear to see in the reported votes.
> I’m sorry, but I am not getting any closer to understanding. All of these explanations appear to depend on the use of the exact percentages to one significant decimal.
You didn’t address my question which doesn’t depend on the use of the exact percentages to one significant decimal. Do you find anything suspicious with the following alternative vote count report or not?
5,150,000 (51.2%)
4,450,000 (44.2%)
458,774 (4.6%)
> So, is the whole issue really about the rounding?
No. It’s about the absence of rounding.
> I see people are losing patience with what must seem like my denseness, but I really don’t understand the focus on the rounded percentages.
I don’t know if you saw another example I wrote.
Let’s say that a company reports $7,118,975 of sales and after subtracting costs the profit is $1,423,795 (20% margin) and the following year $14,237,950 of sales and $2,847,590. Some people may be suspicious about the accounting if the profit is exactly one fifth of the revenue and it exactly doubles from one year to the next – even though such things are possible.
Carlos
Yes, I see suspicious things about both of your examples. What I don’t see is how they relate to the numbers in this election. The suspicious things I see concern the reporting of even numbers like ending in 000 or exact doubling (always raises questions). Those are of a different nature because there are clear fraudulent practices that could lead to such things. I am failing to see the parallel to the reported numbers from Venezuela.
Thanks for the clarification. So, to summarize, you do see something suspicious about this vote report
5150000 51.19908%
4450000 44.23998%
458774 4.56093%
but not about about this vote report
5150092 51.20000%
4445978 44.20000%
462704 4.60000%
Other people also find the latter suspicious. Even more so, because someone making up numbers would surely abstain for releasing the fake-looking first report – while they may fail to notice that the second one is just as implausible.
That’s how I see, it, as well. The supposedly dumb and illegal method that led to impossible percentages, while a possibility, is not any likelier to have occured than the government generating fake voter numbers and then, reasonably, rounding the percentages. What does seem unlikely is a fair and democratic election!
Carlos
I find the first series of numbers suspicious – the first two even thousands is the reason. I don’t find the second one suspicious because if you report the percentages to more digits, they don’t appear strange to me. If they are strange, it is because of how few votes would change the rounding for all 3 categories. But as I’ve said elsewhere, that strikes me much like the Iran votes evenly divisible by 3 case. Can you clarify for me why the second case is equally suspicious as the first case?
Dale:
It’s the difference between a probability of 1 in 100 million and a probability of 1 in 243.
OK, I stopped being lazy and did my own simulation using your steps a, b,c. I also get your result. But I don’t understand step c. Why are we measuring the probability of getting those exact vote totals? To me, step c looks like it is guaranteed to have a very very low probability since we are comparing a simulated vote total for 3 candidates to a single actual vote tally. Isn’t the probability of getting exactly those vote totals guaranteed to be close to zero? In other words, I don’t understand what steps a and b tell us about the answer in c – it looks to me like c will always give a very low probability, regardless of how we generate the proportions.
Dale- Any particular vote total is extremely unlikely for simple true counts. Vote totals with simple striking features (all multiples of some integer, all exactly expressible as percents to 0.1%,…) are unlikely. There are many such patterns imaginable so unless you see a simple pattern that’s extraordinarily improbable, it makes sense not to take the coincidence too seriously. This one is extraordinarily improbable. Then you ask whether there’s some plausible way it could happen in some other model, e.g. fraud. If there is, as in this case, then the evidence favors the other model over true counts.
There is at least one other semi-plausible model- that somebody reported the percents to 0.1% precision along with an exact total and then somebody presenting the results made up the individual counts by multiplying. That seems far-fetched but unlike the probability of getting this mathematical feature for true counts you can’t calculate it from a mathematical model.
Michael:
I agree with your Bayesian reasoning, and I like how you explain it. I would only disagree with one of your statements, which is that vote totals that are “all multiples of some integer” are unlikely. Under any reasonable model, the probability that all three vote totals are multiples of 2 is 1/8. That’s not so unlikely!
In any case, I agree with your Bayes-meets-Cantor point that when the data seem very unlikely to have occurred under a reasonable null model, it makes sense to look around for alternatives.
Michael
In your comment, you refer to “exactly expressible as percents to 0.1%” as one example of an unlikely pattern. This mirrors many of the comments people have made. What keeps throwing me off is that the numbers provided in the first table are not exactly expressible as percents to 0.1%. They only appear that way when rounded. The actual percentages are not exactly expressible as percents to 0.1%. So, all of the comments based on using those rounded percentages seem off the point to me.
> What keeps throwing me off is that the numbers provided in the first table are not exactly expressible as percents to 0.1%. They only appear that way when rounded.
Or maybe the numbers provided in the first table are in fact exactly expressible as percents to 0.1%. They only appear not to be when rounded.
Just try with the unrounded vote counts! The numbers below are exact:
5150092.288 51.2%
4445978.108 44.2%
462703.604 4.6%
Carlos
This does not help me. Of course, if the rounded percentages are, in fact, exact, then the vote counts are impossible. But if you ask me to choose between the vote count or percentages (to one decimal) as being exact, I think the count is more likely. At least all elections I’ve seen, show counts and then percentages derived from those counts. I reiterate that I suspect the vote counts are not genuine, but that is not a matter of statistics.
> Of course, if the rounded percentages are, in fact, exact, then the vote counts are impossible.
That’s why it’s essentially meaningless to say that “if you report the percentages to more digits, they don’t appear strange”. If we don’t get more zeros it’s mostly because it’s impossible. Adding digits doesn’t turn the “strange” percentage 51.20000% into a “normal” 51.199997% – it’s the only way it could continue, it’s the closest you can get to 51.2%.
Andrew- Yes, I agree but just was unclear in how I said it. The integer multiple case is only mildly unlikely for small integers. After allowing for implicit multiple comparisons it isn’t enough to be worth following up, at least for I=3.
I’ve heard that the Venezuelan government released the percentages, not the vote totals. If that is the case, then I see the fishiness. So, is all this based on the fact that they released the percentages, and those don’t produce sensible vote totals? I feel like some information is missing at the beginning of this post if that is the case. Because, as I keep saying, if we start with the given vote numbers, nothing seems strange to me.
The National Electoral Council gave each of the numbers in the first three rows of the table (not the last row with the totals as far as I know).
https://x.com/yvangil/status/1817787106237743565
> if we start with the given vote numbers, nothing seems strange to me.
Dude, you’re not getting it.
Suppose that I told you I measured my mile lap time, and these were my results:
Lap 1: 6:00.9200
Lap 2: 7:15.0100
Lap 3: 7:30.3700
Lap 4: 7:43.7000
How fast can I run a mile, on average?
Answer: You have no idea, because those numbers are obviously fabricated.
> I’ve heard that the Venezuelan government released the percentages, not the vote totals.
You can hear someone from the National Electoral Council reading out each of the numbers in the first three rows (votes for Maduro, Gonzalez and others and the corresponding percentages – or, more appropriately, the percentages and the corresponding counts) here: https://x.com/yvangil/status/1817787106237743565
> if we start with the given vote numbers, nothing seems strange to me.
Imagine a company that reports profits that are exactly 20% of revenue – and does so quarter after quarter. Sure, if we start with the given numbers nothing seems strange. The question is about the plausibility of the numbers.
I don’t understand the distinction between releasing the percentages or the vote totals.
Let’s say the Venezuelan government has voting machines that tabulate the elections and they expect Maduro to win, but on actual counting, he doesn’t. At a meeting they decide “gee, wouldn’t it be nice if this for counts let to a 51.2% Maduro share of the vote, what would be the vote totals then?” And send the resident intern out to do the calculation. Upon completion, you could report the fraudulent vote totals of whatever percentage you want and it would still be fishy.
Out of all the elections involving more than two candidates in the past, how many have ever ended with vote counts that lead to percentages that essentially round themselves up to the first decimal digit?
I’m posting this because I’m really trying to understand your argument for lack of fishiness, but can’t.
The Venezuelan National Electoral Council published a video with the numbers onscreen here: https://x.com/cneesvzla/status/1817953254208110756 no Spanish necessary.
These are the results according to the opposition’s vote tally:
Candidate Votes Percentage
Nicolas Maduro 3,250,424 30.3969729 %
Edmundo Gonzalez 7,173,152 67.0811275 %
Others 251,446 2.3514462 %
Totals 10,693,249 100.0000000 %
Can someone share a hyperlink to a primary published source of these election results? I haven’t yet find one in the article, nor the NYT article linked in the comments, nor on the BBC News coverage, nor on the Internet Archive for the cne.ve domain name (at the time of writing on 2024-07-31, no archived content beyond 2024-07-28 is found for that domain when I search there).
Thanks,
James
Thanks to two other commenters on this thread: the numbers were announced by the CNE, and a video recording of that announcement is available from at least two television networks, as published on YouTube:
– Teletrace (T13) – https://www.youtube.com/watch?v=ihRoxaHRh2M#t=120
– NTN24 – https://www.youtube.com/watch?v=pB7g4y4M4s8#t=70
Actually, this case is not unique. The 2014 Syrian presidential election vote totals also look like calculated from preset percentages. More examples are found in Russia and some other post-Soviet states. A similar phenomenon is described in https://arxiv.org/abs/1410.6059
The vote numbers came from the CNE (National Electoral Council) when they announced the results, starting at minute 2:
https://www.youtube.com/watch?v=ihRoxaHRh2M
Thank you, Brian!
(I have posted an earlier comment asking for a published primary source for this data; that comment is still pending moderation as far as I know)
It seems to me that the statistics released here by the CNE were intended to be preliminary data, not a final count — as perhaps also indicated by the word ‘trend’ in the quotation mentioned early in this post.
That makes me think that their choice to include (apparent) vote counts may either have been misinterpreted by subsequent reporting, or were indeed misleading to provide in the first place. Until final counts are collated, it seems overly-precise to provide integer-valued count numbers as if they are accurate totals.
If the numbers were indeed approximated based on in-flight data collected shortly after polls closed, then it does seem possible to me that those could have been rounded to aggregate percentage figures — a valid way to reduce reported precision of a dataset to the estimated precision of the information — and yet then dubiously extrapolated back into the integer range of the anticipated voter population count.
I could well be mistaken; in any case I think a reference to a primary published source of this data could help to clarify the situation.
Here is the source for the announcements of the numbers: https://www.youtube.com/watch?v=pB7g4y4M4s8
I don’t speak Spanish but I’m pretty sure there’s never a total vote count reported. This means some other party likely took the reported percentages and worked backwards to estimate the total vote count. This seems like a huge misunderstanding that’s not even the CNE’s fault
Thank you, Culi – I believe that the vote counts are in fact spoken around the 1 minute and 10 seconds mark in the video you linked. Here’s a YouTube shortcut that should open to the around that moment, when Maduro’s total is announced: https://www.youtube.com/watch?v=pB7g4y4M4s8#t=70
“Cinco milliones, …” for example is five million in Spanish.
Thanks to statistical analysis, we now know that there’s somethign fishy going on in with the Venzuelan election!!! Wow. The amazing insight we get from statistics!
Thanks for this analysis. I came up with a similar result here: https://stats.stackexchange.com/questions/651986/is-my-reasoning-about-the-likelihood-of-the-venezuelan-election-vote-totals-vali
Except that I allowed for the vote count to fall on the voter above or below the tenth of a percent boundary, leading to a 2 in 10000 chance for a single candidate and a 1 in 25 million chance for two.
This whole situation is very upsetting.
Your explanation almost has me understanding this. The fact that one vote miscounted could simultaneously change these rounded percentages is indeed suspicious. But isn’t this really the same thing as ex post saying the probability of getting this exact vote count is very small (almost zero)? If there were only 2 candidates, then it would seem like that, but perhaps the fact that we have 3 vote counts and shifting any single vote between categories would change the rounded percentages is what everybody is finding fishy?
It still looks like the same thing as the previous discussion about the Iranian election where all the vote totals were divisible by 3 (https://statmodeling.stat.columbia.edu/2024/07/16/the-recent-iranian-election-should-we-be-suspicious-that-the-vote-totals-are-all-divisible-by-3/). Also, given the disputes in the Venezuelan election – that the votes are grossly misreported, it seems like evidence that it takes very few fake votes to change the percentages is fairly weak evidence to look at. In other words, if instead of Maduro getting 51.2% of the vote, he really got 33% of the vote, then the evidence that the reported percentages would change with a single fake vote looks like a mismatch of evidence and the real election fraud that took place.
Similar case was in russia
https://x.com/romanik_/status/1769969900741648760
https://x.com/ishukshin/status/1769997657643041142
The real numbers are here.
https://resultadosconvzla.com/
Next Maduro will arrest protestors (election deniers) for trying to overthrow an election.
Jay:
I would not label the protesters in Venezuela as “election deniers,” as there seems to be solid evidence that there was election fraud (although, as noted in my above comment, I have not looked at these claims myself). We refer to the people who claim that Biden lost the 2020 election as “deniers” because the arguments they’ve offered in support of their claims have been repeatedly refuted (see here, for example).
There are intermediate cases where there were plausible but contested accusations of fraud that took awhile to resolve, as for example in the 2019 Bolivian election, as discussed here.
There’s not a bright line separating a legitimate dispute about an election from a specious election denial. The recent Venezuelan election seems to me to be clearly on the legitimate side, at least given the information available so far; the 2000 U.S. election is clearly on the specious denial side, and the Bolivian case was somewhere in the middle.
Andrew refers us back to his blog (about the Bolivian election of 2020) dated
https://statmodeling.stat.columbia.edu/2020/06/08/bolivia-election-fraud-fraud-update/
where I find this troubling statement:
” if the election were fairly conducted, some feature of the observed 2020 [Bolivian] election result would be unlikely or impossible. In each case, we find that the purportedly anomalous fact is either not a fact or not anomalous.”
The statement is troubling to me because it sounds like what Aubrey Clayton labels as a “transposed conditional.” That is, we would like to determine
Prob (fair election| data)
but instead, the (English language) phrasing often has us (Bernoulli and many, many others) calculate instead
Prob (data|fair election)
which leads to famous things such as the prosecutor’s fallacy and the misunderstanding of medical test results.
Why not label people “deniers” when denial is true? I deny that the moon is made of green cheese, go ahead and call me a lunar cheese denier.
“My first reaction is, no, I don’t find this amusing.”
maybe not, but it’s pretty hilarious you think a few hundred unarmed rowdies (several of whom were killed with little provocation and no accountability) abetted by Nancy “I take full responsibility” Pelosi’s refusal to provide Trump’s requested National Guard, were in any way a threat to defeat all of America’s nukes and F-15s and take over the country
you are the victim of a media hoax, a hysterical panic that even a child could see through
not one of the officials who pushed the Hunter’s laptop hoax, the Russia collusion hoax, the Trump spying have seen a day in prison
to this day people who PEACEFULLY PROTESTED on Jan 6 are being hunted down, arrested, and falsely charged with Enron document destruction violations
by the same political party that lied to you over and over again, that is passing legislation all over the country to make cheating as easy as possible
protesting a stolen election is quite the opposite of stealing an election
do the math
I was doing same calculations 2 daya ago and getting same result numbers. My conclusion was translating it to the Statistics language: The probability in a voting process like this one to get the CNE report numbers is 0.00001, almost nill, impossible.
Prof. Ing. Gonzalo Aguerrevere Ruiz. M.Sc.
Anon:
You say 0.00001 which is 1 in 100,000, but I say 1 in a 100 million. In practice, though, yeah, both are unlikely events.
Can someone explain where the 1001 number comes from
“There are 1001 possible vote counts you can get by rounding vote percentages that are multiples of 0.01”
Sorry—that was a typo, it was supposed to be 0.001. I went in and fixed it. The 1001 possibilities are 0, 0.001, 0.002, … 1.000.
Thanks!! And thank you for the insightful post.
These people didn’t understand the following. Rounding happens because there is no such thing as half a voter or cents of a voter. Voters are always whole numbers. So, let’s say that Maduro asked the intern to give him a result of 51.2% for himself, 44.2% for Gonzales, and 4.6% for the other candidate. The person then took the only data he could use at that moment (that 80% of the ballots had been counted and there were 10,508,774 votes) and used that data to calculate the results:
10,508,774 * 51.2% = 5,150,092.288
Since there is no such thing as 0.288 of a voter, he presented the number 5,150,092 voters, and that’s why if you expand up to 7 digits, this imprecision appears. In a “normal” election, the percentage numbers don’t exactly match the reported vote counts. This happens because no one wants to read that Lula got 50.834628% of the votes. So it is reported as 50.83% and that’s it.
In a rigged election, by mathematically ignorant people, on the other hand… the candidate has exactly the number of votes corresponding to 50.83%.
In this case, any number of voters between 5,145,100 and 5,155,100 for Maduro (a universe of approximately 10,000 possible numbers) will generate a result that will be presented on TV as 51.2%, but only one of those results is the result of 51.2% times the total number of voters.
If one possibility out of 10,000 already seems like an exaggerated coincidence, it becomes even more grotesque because the same happens with González’s numbers. Any number between 4,440,950 and 4,451,005 (a universe of 10,055 possibilities) will also generate a number that will be presented as 44.2% in the newspapers, but only one of those numbers is the result of the total number of voters x the percentage of votes shown in the newspapers. 10,508,774 * 44.2% = 4,445,978.108… again, the non-integer values are discarded and there is González’s result.
A one in a hundred million chance. It was fraud.
Now we are getting somewhere. I understand the logic – but I find the starting point strange. Your assumption is that Maduro, running a fraudulent election, states a percent of the vote (to one decimal place) for his intern to implement. I would envision a different scenario – modify the vote counts from particular polling places to systematically skew the total votes. Either way can produce 51.2% for Maduro, even if the “real” votes where 33% for Maduro (as claimed by the opposition). Either fraud can be detected with information from the paper ballots, or possible with disaggregated vote counts by location. The 51.2% strategy would then require some scheme to record votes by location to give the appropriate total – or the fraud would become immediately detectable when the disaggregated vote counts are looked at. Starting with manipulating the vote counts so that the total produces a rounded 51.2% for Maduro instead of the “true” 33% would require misreporting the disaggregated vote counts to add up to the invented total.
At this point, I can see some logic to believing that Maduro said I want 51.2% of the total, with the scenarios people have described. It seems too easy to show there was fraud, but I’ll admit I know little about Venezuela’s voting particulars (observers, paper ballots, etc.). My natural impulse would be to see fraud as being implemented by lying about the votes reported precinct by precinct. Detecting that fraud would require more granular data from each precinct, in my mind.
I have no personal knowledge on which to base an opinion on what fraud scenario is likely. But at least I can now see why many people are starting with the percentages in their analysis. I guess I’ll move on to begin worrying about what kind of fraud might occur in the November election.
Venezuelan here.
Initially we made your same mistake thinking they would be more sophisticated committing fraud. It was an Argentinian journalist from Cordoba who felt the vote numbers looked suspect, calculated the percentages and tweeted that it seemed strange. I couldn’t believe my eyes when I saw it. Keep in mind there was fraud and abuse all across the process and our attention was on other issues. We never thought possible that they would be this sloppy, because they weren’t in previous elections.
What probably happened is that the opposition lead in the polls was so massive that their classic electoral process frauds and abuses weren’t going to be enough to make a difference. So they got rushed, and they delegated the task to calculate the votes to the dumbest guy of all, the Director for the National Electoral Center.
Thanks for this.
I did a simulation and got 8 matches in a 100million simulation. I dont know if any mistakes were made on my part but i’ll leave the code below.
import numpy as np
# Number of simulations and total votes
num_simulations = 100_000_000
total_votes = 10058774
# Voting probabilities derived from the provided data
probabilities = [5150092 / total_votes, 4445978 / total_votes, 462704 / total_votes]
# Monte Carlo simulation
results = np.random.multinomial(total_votes, probabilities, size=num_simulations)
# Function to calculate the percentage precision
def calculate_precision(votes):
return np.round(votes / total_votes * 100, 7)
# Actual precise percentages for comparison
actual_precisions = calculate_precision(np.array([5150092, 4445978, 462704]))
# Simulated precise percentages
simulated_precisions = np.array([calculate_precision(result) for result in results])
# Checking for exact matches
matches = np.all(simulated_precisions == actual_precisions, axis=1)
match_count = np.sum(matches)
print(match_count, match_count / num_simulations)
Anon:
The number you get in any particular simulation is itself random. You could try a billion and see what you get. Also, I don’t think the multinomial model you’re using makes much sense as a null hypothesis, as it’s centered at the published numbers, which are suspect, and the multinomial distribution will give you too narrow a range compared to uncertainties in actual votes.
I’m a bit lost with the numbers, shouldn’t any possible vote distribution have the same probability as others? In this case the numbers look “nice”, but if we compare any distribution with “weird” numbers against any other possible distribution we’d get the same chances. What point am I missing?
Anon:
It’s not literally true that any possible vote distribution has the same probability as others. For example, given that ahead of time the election was expected to be closely contested, an outcome in the range of 50/50 or 40/60 would be more probable than an outcome in the range of 90/10. But, yes, when it comes to the trailing digits of the vote, all those possibilities should have essentially the same probability under the “null hypothesis” that these numbers represent actual vote counts.
Regarding the statistical inference, there are two ways of looking at the problem.
1. From a classical hypothesis-testing perspective, yes, all possibilities of trailing digits are roughly equally likely under the null hypothesis, but for each candidate’s vote to be exactly-to-the-nearest-integer of a multiple of 0.001 of the total vote is a notable event, hence the definition of the test statistic.
2. From a Bayesian perspective, again, all possibilities of trailing digits are roughly equally likely under the null hypothesis. But there are (at least) two alternative hypotheses under which the event that each candidate’s vote to be exactly-to-the-nearest-integer of a multiple of 0.001 is much higher. One of these alternative hypotheses is that the vote totals were rigged by taking a total vote number and then multiplying it by pre-chosen numbers that were multiples of 0.001; the other is that votes were counted, then the proportions were computed to the nearest 0.001, and then those numbers were post-processed and multiplied by the total number of votes. In Bayesian terminology, the likelihood of the data is about 100 million times higher for these alternative hypotheses than for the null.
Its not really the presence of an anomaly, its that there is a simple explanation that makes the otherwise surprising result guaranteed. Ie, calculate number of votes from the percentages.
However, jumping to the conclusion this was due to fraud is logically unsound. I mean really who knows what people will do with numbers in excel/etc.
People should expect the votes are processed in a transparent and reproducible way. So the numbers can be rejected on those grounds even if no anomaly was noticed.
But we would reject (almost?) all modern elections due using closed source software at this point, even ones half the voters like. So I guess we are stuck with untrusted election results now.
I’ve been digging through resultadosconvzla.com’s scans of the computer receipts. Only ~10% of their receipts have actual certifications from poll workers on them:
https://diode.zone/w/dGcCfyH9zPYT8LfpdToDec
The remainder are blanks. The source of truth here is *not* the computer’s receipts. It is the *ballots*, which poll workers double-check to confirm that they converge to what the computer receipt says, prior to certifying the computer’s receipt with their physical, inked signature or fingerprint.
That the opposition’s evidence is 90% uncertified receipts should be garnering way more skepticism than it is at this point.
And it also makes the CNE’s improbable numbers have a reasonable explanation: they *are* improbable, because the only reliable, certified data that they had at the time was in percentage form, garnered from poll workers as they sampled the actual ballots. Rather than confirm at the time that they suspected foul play, and only release the percentages, they ran with the percentages and worked backwards to get absolute counts, a serious mistake that is going to cost them a significant amount of trust.
In any event, the supreme court over there is now on the case as well.
(Feel free to follow along in the fediverse: https://octodon.social/deck/@aspensmonster/112884327977911215)
The number is actually exact, 51’20000%
There is no sense on going beyond fifth digit as the sixth represents <1 person.
Interesting discussion, particularly bringing p-values and Bayes in. But what we have in the first place is forking paths! If we wanted a p-value that properly formalises how surprised we should be, wouldn’t that need to take into account anomalies of *any* kind that somebody would’ve found strange enough to discuss here, not just the specific rounding/backprocessing of percentages issue discussed here?
Same with Bayes – for doing a Bayesian calculation we’d need to decide post hoc a prior probability for a fraud/stupid mistake explanation for this specific anomaly, and thinking about this, chances are we’d implicitly assign other kinds of anomalous situations prior probability zero because we just don’t think of them right now.
I’d suspect that there is pretty much no way around this. We’re basically lost if we want to work out how much something should have surprised us a priori only being able to work out based on being surprised post hoc.
The argument relies on the p-value/Bayesian probability being very very small indeed (to allow for the fact that because not all possibilities for anomalies have been taken into account, it should actually be somewhat higher, and we don’t really know how much higher). 1/1000 would probably not have been low enough – anybody who wants to talk thresholds? ;-)
There is always a “god/aliens” hypothesis that can be used to explain anything (ie, “god of the gaps”). But it is consistent with any outcome. Thus the likelihood is spread out uniformly over all values.
In contrast, the “multiplying total votes by rounded percentages” explanation is *only* consistent with exactly what we observe. So all the probability mass is concentrated rather than spread out. It makes a much “riskier” prediction and much more likely to be the case when observed.
Then we can go a level higher. Was this due to “Maduro saying give me 51.2%, Gonzales 44.2%…” as proposed in the OP? But why not 52.2%, and so on? There is nothing special about those values.
However, if those percentages and total votes values were actual data, then you would get exactly what we see. So the “unsophisticated rounding” explanation is again more precise.
> Same with Bayes – for doing a Bayesian calculation we’d need to decide
> post hoc a prior probability for a fraud/stupid mistake explanation for
> this specific anomaly, and thinking about this, chances are we’d
> implicitly assign other kinds of anomalous situations prior probability
> zero because we just don’t think of them right now.
I’m not sure what you are saying. There isn’t much point worrying about the prior for situations that a quick glance at the data shows aren’t relevant.
I’ve just got back 2 instances of those numbers running the simulation with “S <- 1e8", so I guess IT IS POSSIBLE after all!
The article offers an interesting exploration of a possible irregular pattern in the election results. The mathematical methodology employed is adequate, but can benefit from further evaluation and analysis of systematic errors. The conclusion of fraud must be supported by additional evidence and consider both alternative explanations and the broader context of the election. Criticism should consider the political and social context in which the results occurred. Mathematical interpretation must be accompanied by an understanding of the environment in which the election was held and the possible pressures that could influence the reported results. However, it is clear that, for the person presenting the data, the only notable error would have been avoided if the source table had been this one:
Candidato Votos Porcentaje
Edmundo González 5,000 51.2%
Maduro 4,400 44.2%
Otros 460 4.6%
Or put another way, the error is avoided by permuting the names in the table, and then no one would have noticed it.
I have discussed this in my Facebook page:
https://www.facebook.com/danielvictor.tausk/posts/pfbid0C4o4wfdZKNzNYW318suEWTn1M2NcNVTbBcTKmbMX1SYHv46FJVV9rPT1gmRnhpEsl
the post is in portuguese, but you can easily get automatic translation. I used a simple heuristic to get to the approximate probability of 1 in 10^8 like Andrew did and then I tried a little more serious approach, assuming a multinomial model for the number of votes. Given the probability vector p with the probability parameteres for the multinomial it is easy to compute the desired probability exactly with the following simple R code:
calcprob = function(p){
q = p[2]/(p[2]+p[3])
return(sum(sapply(valores,function(n1) sum(dbinom(valores[valores <= n-n1],n-n1,q))*dbinom(n1,n,p[1]))))
}
keeping in mind that the marginals and conditionals obtained from a multinomial model are binomial. You can then play with some choices for the parameter p, like using just the point estimate or sampling it from the Dirichlet posterior using a uniform prior. Even by taking the maximum of a 100-element sample I can't get a probability higher than 1 or 2 in 10^7.
Daniel:
I disagree with your claim that the multinomial model is “more serious.” I don’t think that sort of model makes sense at all for forecasting votes. For more detail on the general topic, I recommend some of these papers:
What is the probability your vote will make a difference?
Estimating the probability of events that have never occurred: When is your vote decisive?
Standard voting power indexes don’t work: An empirical analysis.
(Links here: https://stat.columbia.edu/~gelman/research/published/)
The short story is that a multinomial distribution is not a sensible model for an election forecast. The longer story is that if you use a multinomial model, there will be uncertainty about its parameters, and the uncertainty about those parameters will represent essentially all the uncertainty in the forecast.
I definitely agree that the multinomial model is too simplistic. I see you are using linear regression models in your papers, but in the present context I don’t think that is an option — I don’t have explanatory variables or number of votes per region or anything, just the total number of votes of each candidate. Originally I considered the possibility of making the model more realistic by adding another level, i.e., making the probability parameters of the multinomial random. But then I decided to check if my test works in practice (see the other comment https://statmodeling.stat.columbia.edu/2024/07/31/suspicious-data-pattern-in-recent-venezuelan-election/#comment-2376972 ) and it turned out that in more than ten thousand Brazilian ellections the p-values follow a distribution very close to uniform (the test is actually somewhat conservative for large significance levels, but that seems mostly due to the fact that many ellections included were on small cities with a few thousand voters, so the distribution of the test statistic becomes “too discontinuous”). I suspect that for the purpose at hand — checking if proportions of votes are oddly close to integer multiples of negative powers of 10 — the correctness of the model for the number of votes is not too important.
A more interesting discussion arises by looking at the official final results presented by the regime. Here we have the number of votes for all candidates:
candidate;votes
null;50785
Maduro;6408844
Gonzales;5326104
Luiz Martins;152360
Antonio;116421
Benjamim;92903
Jose Brito;84231
Javier;64452
Claudio;40902
Marquez;29611
Ceballos;20056
We don’t find here the same exact coincidence as before and I wasn’t expecting to find it as the news about the extraordinary coincidence was already out there so they would probably be more careful. This lead me to do a more interesting analysis:
https://www.facebook.com/danielvictor.tausk/posts/pfbid06tMkHMzfDKGiaCcfEa21jjTFLdKvmx9Q4JB5UHEFcyNkxTrY4to3xRD5KJMLAfHgl
My thought was that they would possibly pick some percentages with a few number of decimal places, compute the numbers of votes and then change the values a little bit to make them more realistic. But in this process they would probably screw up, not disturbing the numbers enough. So I designed a test to check how “weirdly round” to a certain number of decimals places the proportion of votes are. The following simple R code computes a bayesian posterior predictive p-value assuming a multinomial model and a uniform prior in the simplex for the probability parameters:
library(gtools)
round_test = function(votes,ndig,nsimul=10^5){
calcstat = function(prop){
return(sum(abs(prop – round(prop,ndig))))
}
onesimul = function(){
psimul = as.vector(rdirichlet(1,votes+1))
votessimul = rmultinom(1,size=total,prob=psimul)
return(calcstat(votessimul/total))
}
total = sum(votes)
values = replicate(nsimul,onesimul())
return(sum(values <= calcstat(votes/total))/nsimul)
}
The p-value is of the order of 1 in 1 million with ndig=4 (i.e., they made up percentages with 2 decimals places this time). I validated my test using thousands of Brazilian ellections:
https://www.facebook.com/danielvictor.tausk/posts/pfbid02qqST9kxe3vB6qCLaGQRxsA9wbqUFYE6vWx7njdkKUnEfjMA1oFS2TAASuksXkjccl
and it worked perfectly, distribution of p-values is very close to uniform.
Terrence Tao’s analysis:
What are the odds, II: the Venezuelan presidential election
https://terrytao.wordpress.com/2024/08/02/what-are-the-odds-ii-the-venezuelan-presidential-election/
Patrick:
Yes, this is essentially the same analysis as above, just using math language instead of statistics language.
It’s actually one in 200 million if you account for the fact that the numbers must add up to less than the total number of votes. 1 in 400 million if you additionally require that Maduro must win.
Andrew,
I thought you would like to see Walter Mebane’s eforensics analysis of the Venezuelan elections based on the tallies provided by the opposition: https://websites.umich.edu/~wmebane/Venezuela2024.pdf
Very interesting and important stuff!
Here is a simple thought experiment. Take a random number x uniformly from some interval, say between 4 million and 6 million (or any other interval for that matter) and let N=10.058.774. Let p=x/N*100 be the percent of x in N, p’ the same percent rounded to the closest 0.1%, and x’ = p’*N rounded to the closest integer. Out of roughly 10 million, 0.1% is about 10,000 people, so our rounding error should be uniform between 0 and about 5,000 people, so, on average, the absolute difference between x and x’ should be about 2500. In the case of the votes for Maduro, this difference is 0. Moreover, in the case of votes for Gonzales, this difference is also 0. Possible, but not likely. This indicates, with overwhelming confidence, that the total number of votes (and the corresponding percents) do not come from adding individual tallies, but in some other way.
I have run extensive simulations and, yes, the mean difference between x and x’ is about 2500.